Sample Category Title
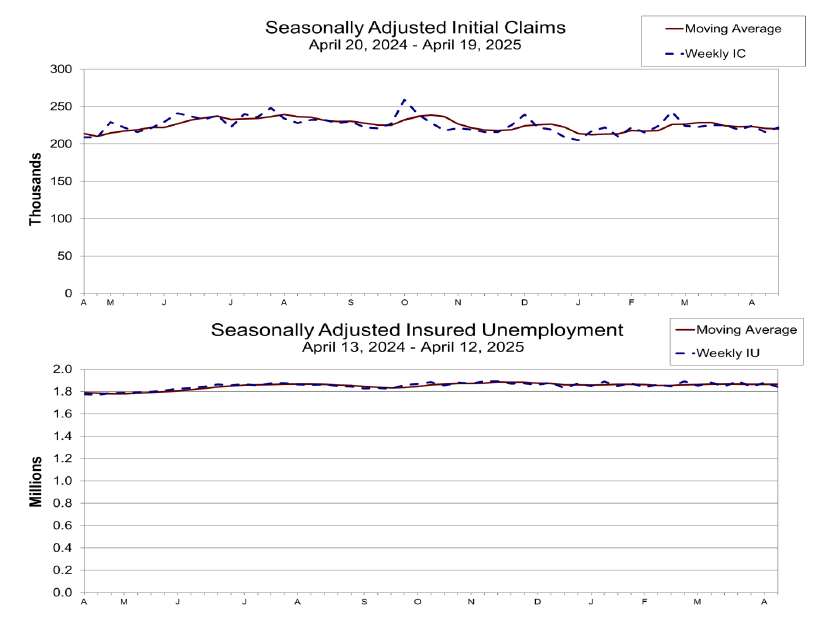
US initial jobless claims rise to 222k, matched expectations
US initial jobless claims rose 6k to 222k in the week ending April 19, matched expectations. Four-week moving average of initial claims fell -1k to 220k.
Continuing claims fell -37k to 1841k in the week ending April 12. Four-week moving average of continuing claims fell -1.5k to 1864k.
Japanese Yen Rebounds After Corporate Service Inflation Beats Estimate
The yen has bounced back on Thursday after a massive slide a day earlier. USD/JPY is trading at 142.44 in the European session, down 0.67% on the day.
Japan's corporate service inflation eased to 3.1% in March from the revised 3.2% gain in February. This was higher than the market estimate of 3.0%.
Tokyo Core CPI expected to jump
On Friday, Tokyo Core CPI is expected to jump to 3.2% in April, following a 2.4% gain a month earlier. A sharp acceleration in Tokyo Core CPI would support the case for the Bank of Japan to continue raising interest rates. Last week, National Core CPI for March accelerated to 3.2% from 3.0%, primarily due to rising food costs.
Wages and inflation are on the rise but the uncertainty over US tariffs has complicated matters for the central bank, which be looking for more clarity about the tariffs before raising rates. The BoJ kept rates unchanged last month and is expected to stay on the sidelines again at the meeting on May 1.
Yen slides after Trump says he'll reduce China tariffs
The US dollar pummelled the yen on Wednesday, surging 1.3%. The dollar was powered by President Trump announcing that he planned to "substantially" lower tariffs on China. The financial markets viewed the statement as a signal that the US was de-escalating the trade war with China, although talks have not yen started between the two sides.
The market also reacted positively as Trump said he had no intention of dismissing Fed Chair Jerome Powell. Trump had launched a blistering attack on Powell in recent days and the US dollar and US equity markets retreated as Trump's threats on Powell eroded confidence in the US financial system.
USD/JPY Technical
USD/JPY has pushed below support below 142.82. Below, there is support at 142.07
There is resistance at 144.19 and 144.94
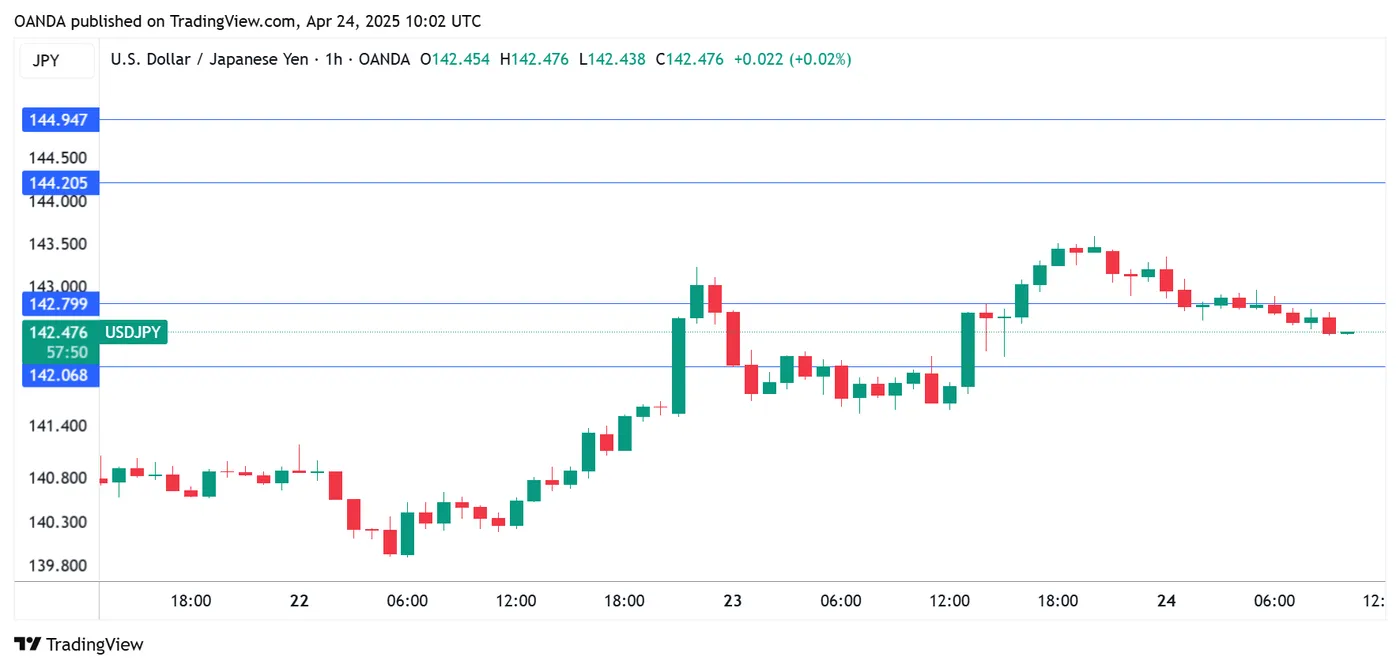
USDJPY 1-Day Chart, April 24, 2025
USD/CHF Rebounds from Multi-Year Low
As the charts show, the USD/CHF exchange rate fell below 0.810 US dollars per franc earlier this week. The pair had not traded this low since the 2008 financial crisis. Demand for the Swiss franc as a safe-haven currency was driven by concerns over the escalation of the trade war between the United States and other major economies.
However, the USD/CHF pair has since rebounded and is currently trading above 0.825. This recovery was supported by yesterday’s statement from Finance Minister Bessent at the JPMorgan Private Investors Conference, where he expressed optimism about imminent de-escalation in trade tensions with China.
Technical Analysis of the USD/CHF Chart
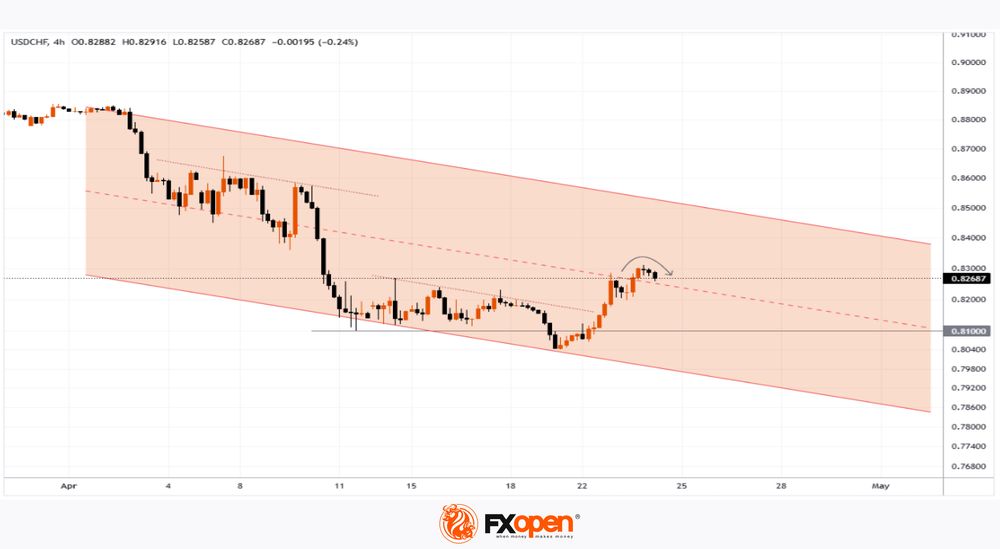
The chart indicates that the trend remains bearish, highlighted by the descending channel marked in red. A bullish attempt to push the price into the upper half of the channel earlier this morning (as shown by the arrow) failed to produce any significant momentum.
The price is fluctuating around the median line, a level where supply and demand tend to balance. It is possible that the market has already priced in the positive news from yesterday, and the bears may attempt to reassert pressure, driving the price back towards the 0.810 support level.
Nevertheless, much will depend on the fundamental backdrop. A stronger dollar could follow in response to possible developments such as:
→ a statement from China signalling readiness to de-escalate its tariff policy;
→ signs of progress in trade deals between the United States and key partners such as Japan, South Korea, and India.
Trade over 50 forex markets 24 hours a day with FXOpen. Take advantage of low commissions, deep liquidity, and spreads from 0.0 pips. Open your FXOpen account now or learn more about trading forex with FXOpen.
This article represents the opinion of the Companies operating under the FXOpen brand only. It is not to be construed as an offer, solicitation, or recommendation with respect to products and services provided by the Companies operating under the FXOpen brand, nor is it to be considered financial advice.
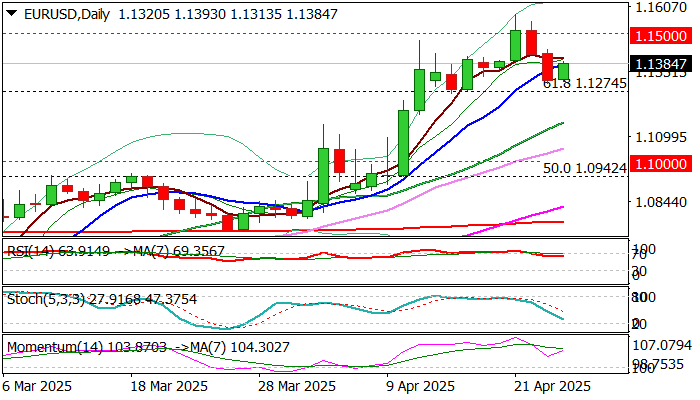
EUR/USD: Larger Bulls to Remain Intact Above Broken Fibo Level at 1.1274
EURUSD rose in early Thursday’s trading signaling that larger bulls regained traction after two-day pullback from new four -year high (1.1573) found footstep at 1.1300 zone.
Near-term bias is expected to remain firmly bullish while the price action stays above broken Fibo level at 1.1274 (61.8% retracement of 1.2349/0.9535) which reverted to solid support (after two attacks were rejected here last week).
Daily studies are returning to full bullish setup (bullish momentum is strengthening and MA’s in bullish configuration).
Fresh recovery looks for verification on close above 1.1440 (Wednesday’s high / 50% retracement of 1.1573/1.1307 pullback) that would further firm the structure and signal that larger bullish cycle is intact and about to resume.
Violation of psychological 1.1500 barrier to add to positive signals for retest of 1.1573 pivot, break of which to expose target at 1.1685 (Fibo 76.4%).
Only loss of 1.1274 support would undermine bulls and risk deeper correction.
Res: 1.1405; 1.1440; 1.1500; 1.1573.
Sup: 1.1307; 1.1274; 1.1200; 1.1146.
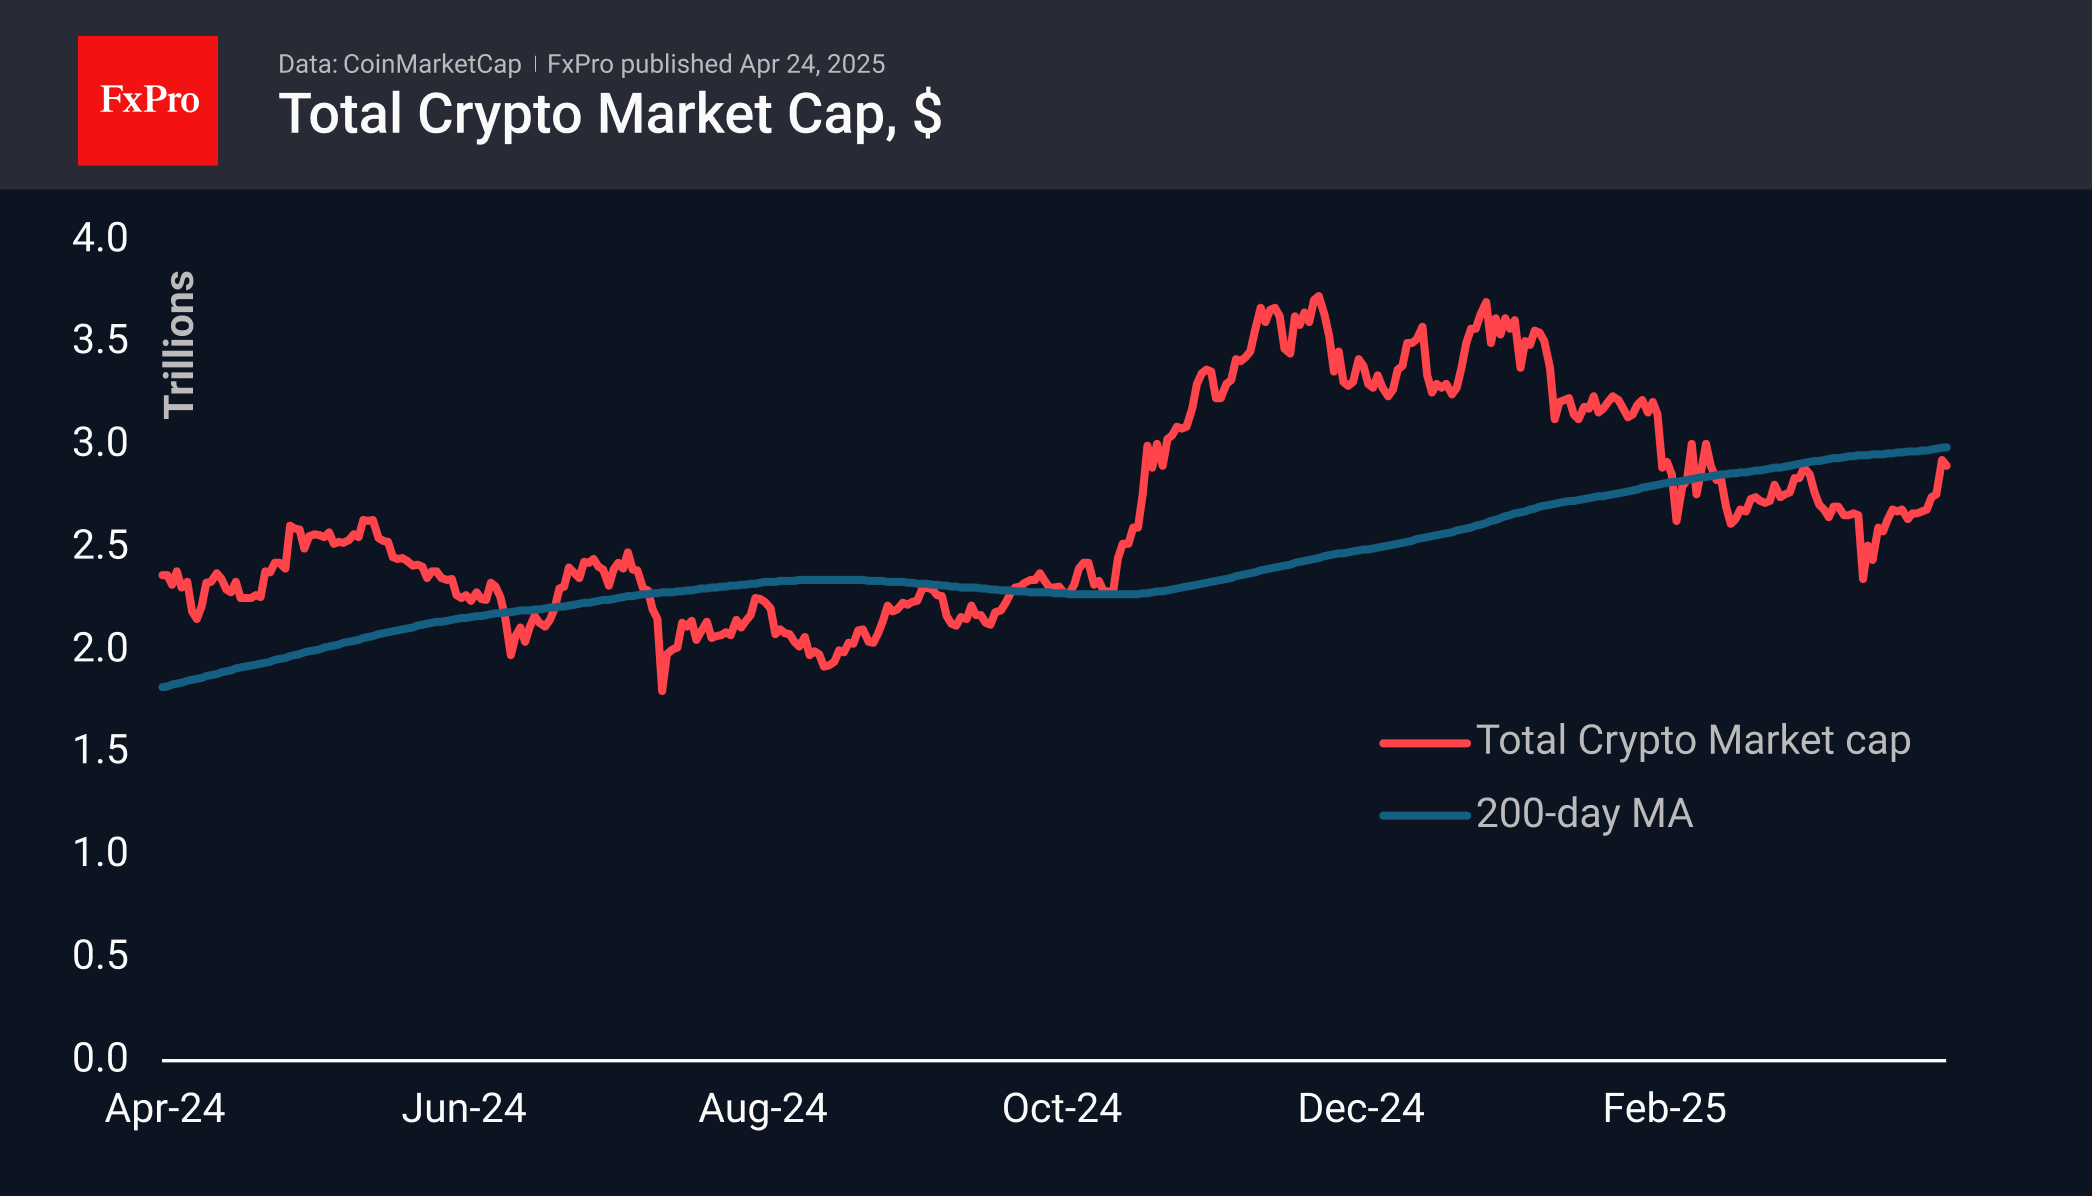
Bitcoin Consolidates Before a New Hike
Market Overview
The cryptocurrency market has corrected about 1.3% to $2.9 trillion from Wednesday’s peak but has been steadily adding over 8.5% over the past seven days. The market is bouncing off the long-term key level of $2.5 trillion, which previously acted as a significant area of resistance. Capitalisation has surpassed the recent peak, marking the breakdown of the downward resistance of the last three months. This is an important signal of the market’s willingness to move further upwards.
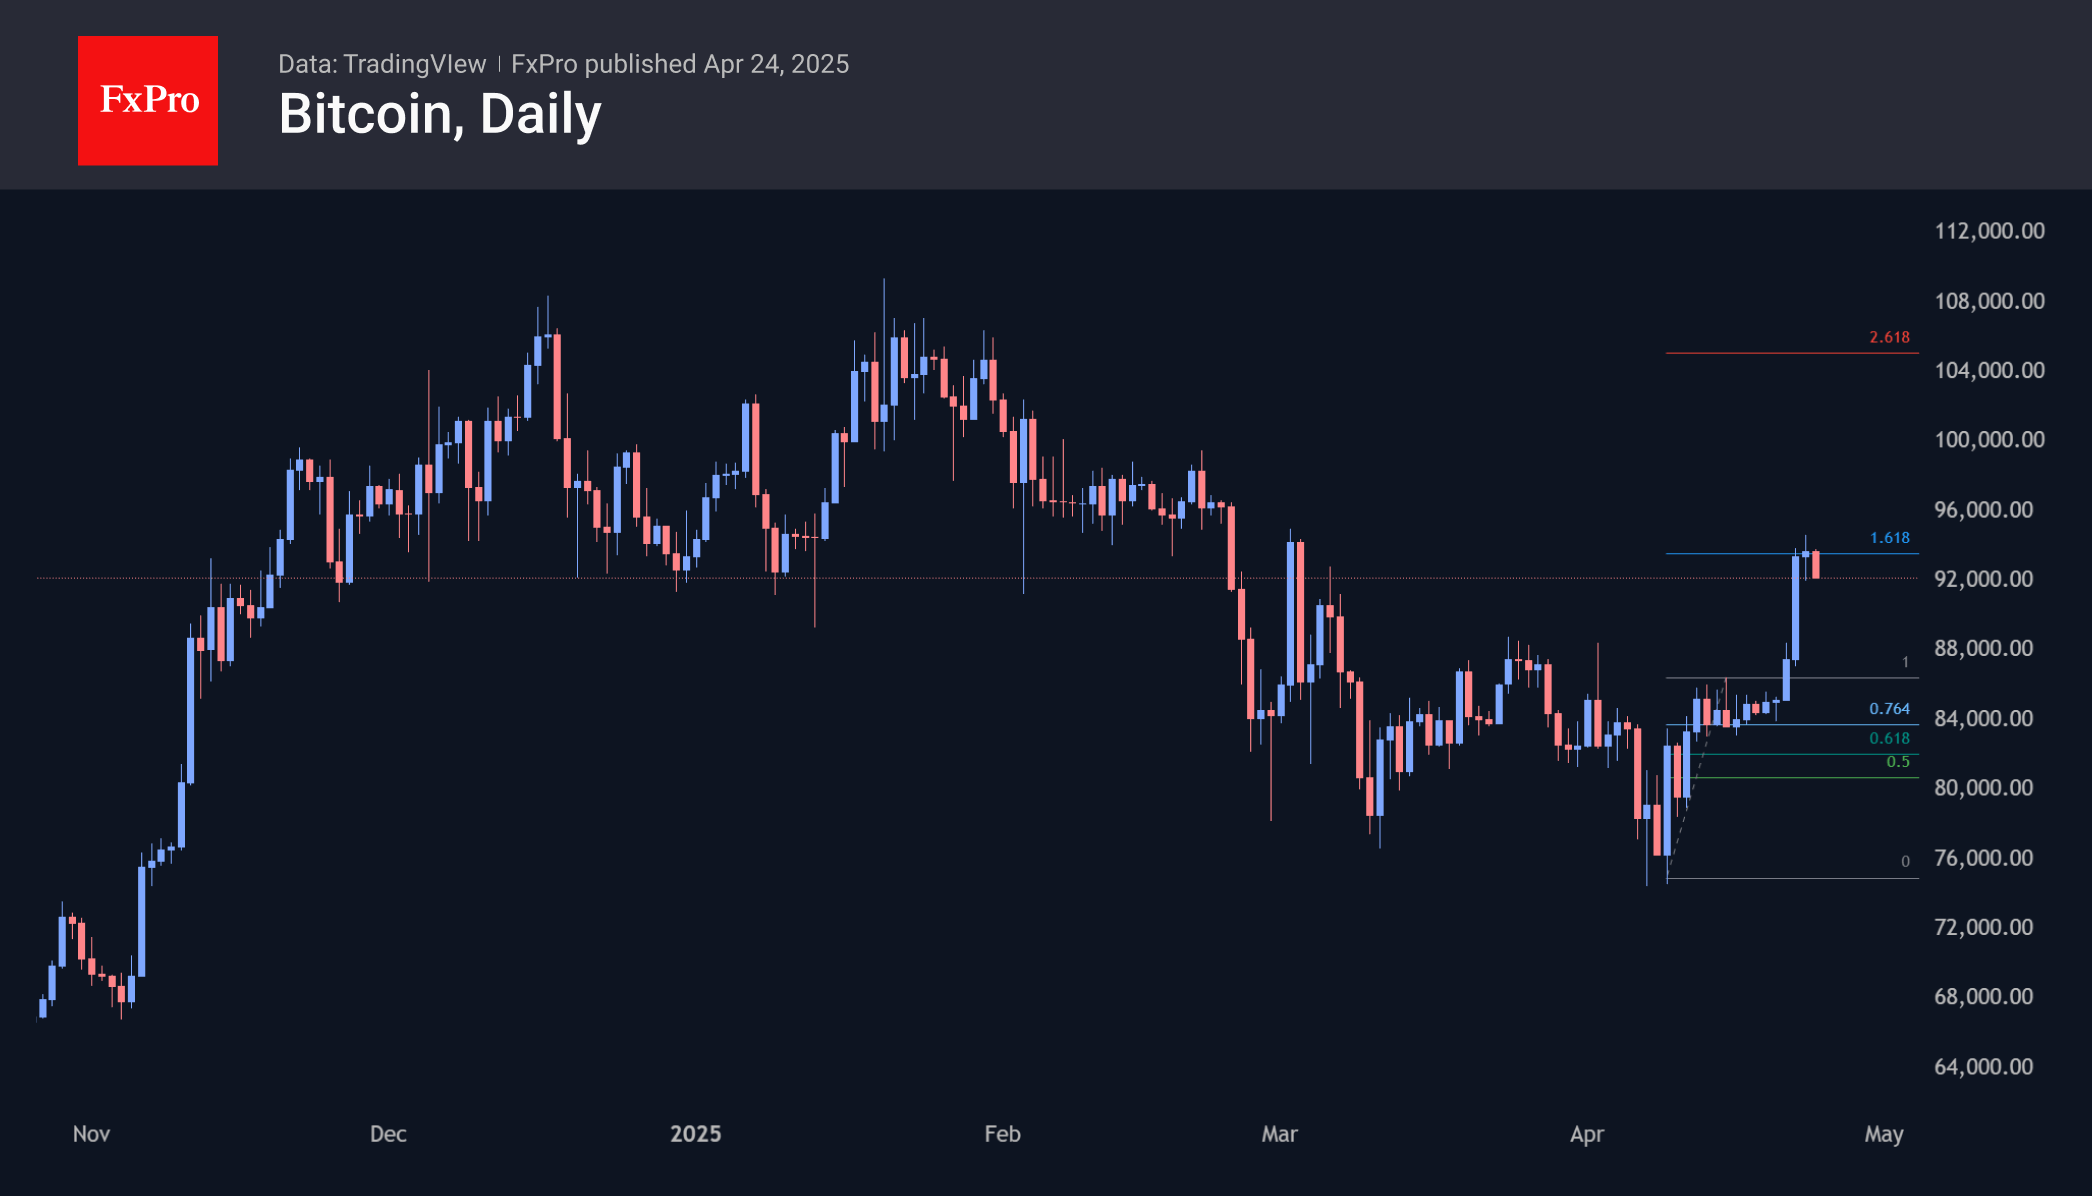
Bitcoin was climbing towards the $94,000 area during the week, more than 20k above the low point at the start of April. Reaching the recent highs aligned perfectly with the 161.8% Fibonacci extension from the initial bounce, fitting neatly into the pattern.
At the same time, it suggests a new short-term consolidation phase before an upward spurt. The technical target for a potential new rise is at $106,000, which is near the area of the first cryptocurrency’s historical highs. If the Fibonacci pattern works, we will see a third test of these levels.
News Background
Trump’s change in rhetoric has fuelled enthusiasm in the cryptocurrency market. According to Velo, total open positions soared 10% to $17.83bn. Funding rates also sharply moved from negative to positive.
Bitcoin will continue to grow if threats to the Fed’s independence persist, Standard Chartered expects. In such a scenario, the first cryptocurrency will play the role of a decentralised hedge against traditional financial systems.
According to the Financial Times, financial company Cantor Fitzgerald intends to create a $3 billion investment fund in Bitcoin. SoftBank, Tether, and Bitfinex are involved in the project, which aims to create a ‘public alternative’ to Strategy.
Trump Media, the parent company of President Trump’s social network Truth Social, intends to launch a crypto-ETF together with Crypto.com and Yorkville firm America Digital. Already having regulatory approval, partners expect to launch Truth.Fi–branded products by the end of the year.
Gold’s Downturn Won’t Last: Global Risks Remain Elevated
The gold price rebounded to $3,350 per troy ounce on Thursday after two consecutive days of steep declines unsettled investors. However, this dip is likely temporary.
Key Drivers Behind Gold’s Movements
U.S. Treasury Secretary Scott Bessent noted that high tariffs between the U.S. and China must be reduced before trade negotiations progress. However, he stressed that President Donald Trump would not unilaterally remove tariffs on Chinese goods.
Trump’s immediate focus includes exempting automakers from certain tariffs following weeks of intense discussions with industry leaders—a move that has partially eased concerns over trade complications.
Gold has surged over 30% since the start of the year, and the gold-to-silver ratio has hit its highest level since 1994 (excluding the pandemic period).
The primary catalyst behind gold’s rally is waning confidence in U.S. economic exceptionalism, driven by escalating trade barriers and unpredictable policy shifts. This has prompted investors to shift from U.S. assets to gold as a safe haven.
Technical Analysis: XAU/USD
On the H4 chart of XAU/USD, the market is forming a downside wave structure to the 3225 level. Today we will consider the probability of reaching this target level. Further we will consider the probability of correction development to the level of 3363. After the completion of this correction, we will consider the probability of a new wave of decline to the level of 3055. The target is local. Technically, this scenario is confirmed by the MACD indicator. Its signal line is above the zero level and is directed strictly downwards.

On the H1 chart of XAU/USD the market formed a consolidation range around the level of 3363 and worked off the third wave of decline to the level of 3260 with a downward exit. Today the correction to the level of 6363 is executed. In the future it will be relevant to consider the development of the fifth wave of decline to the level of 3232, at least. Technically, this scenario is confirmed by the Stochastic oscillator. Its signal line is under the level of 50 and is directed strictly downwards to the level of 20.

Conclusion
Despite recent volatility, gold’s long-term bullish case remains intact, supported by persistent global risks and shifting investor sentiment.
USD/JPY Rebounds But Not Out of the Woods Yet
- USDJPY pauses meltdown near 2023–2024 base.
- Bulls act but stronger efforts are needed above 144.20.
USDJPY rebounded just above September’s low of 139.56, climbing as high as 143.56 on Wednesday.
Having formed two strong bullish candlesticks at the bottom of its recent meltdown, and with technical indicators emerging from oversold levels, the pair may push for more gains in the short term.
However, the path higher may be rocky. The 20-day exponential moving average (EMA) and the broken support trendline – both located in the 144.00–144.40 region – could quickly stall any upward momentum. Then, the 145.50 barrier may prevent an extension towards the 50-day EMA and the 38.2% Fibonacci retracement of the 2025 downtrend at 147.20. If the rally continues beyond the tentative resistance trendline at 147.85, the next target could be the 50% Fibonacci mark of 149.40 and the 200-day EMA at 150.00.
In the negative scenario, where current selling pressures persist, attention will shift back to the 140.00 round level and the support line at 139.30. The 138.00 restrictive zone, which capped both upside and downside moves between December 2022 and July 2023, could keep the bears busy, delaying a freefall toward the 134.65–135.00 area.

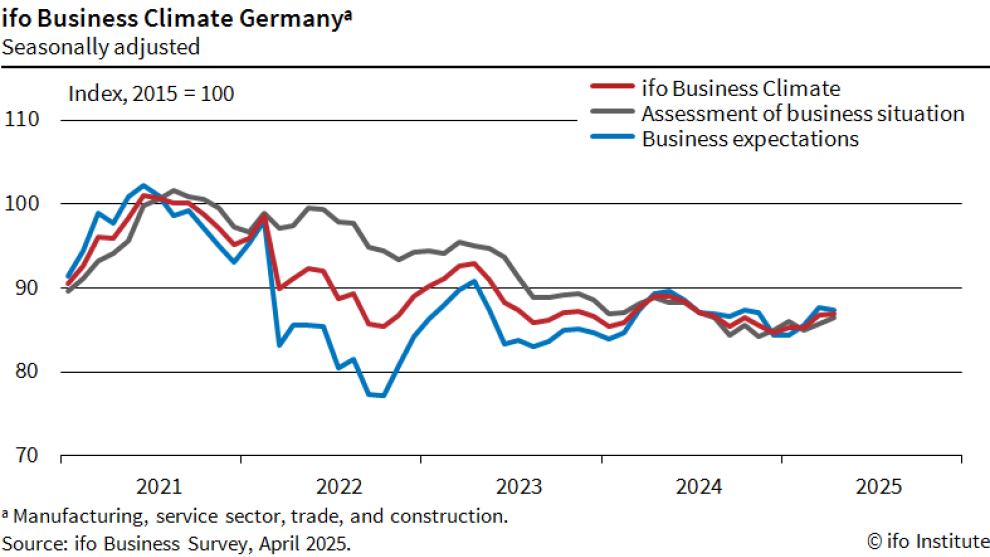
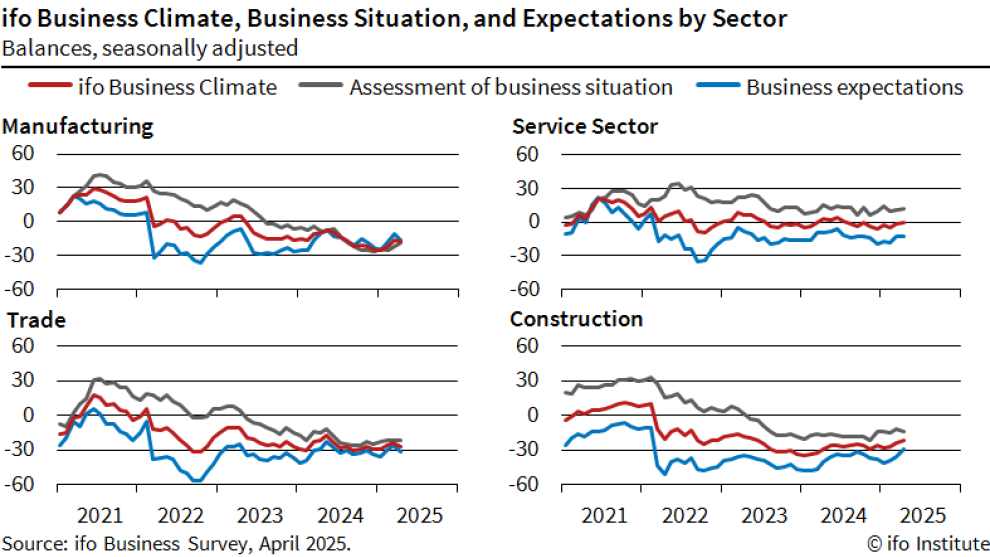
German Ifo climbs slightly to 86.9, but rising uncertainty signals turbulence ahead
Germany’s Ifo Business Climate Index edged higher in April, rising from 86.7 to 86.9 and beating market expectations of 85.2. Current Assessment Index climbed to 86.4 from 85.7. Expectations, while slightly lower at 87.4 compared to March’s 87.7, still surpassed the anticipated 85.0.
However, a closer look at the sectoral breakdown reveals growing divergence and fragility. Manufacturing sentiment deteriorated further, dropping from -16.6 to -18.1, while trade confidence took a notable hit, falling from -23.8 to -27.0. On the other hand, modest gains in services (from -1.1 to -0.8) and construction (from -24.3 to -21.9) offered some relief, though both remain firmly in negative territory.
The Ifo Institute cautioned that “uncertainty among the companies has increased,” adding that “the German economy is preparing for turbulence.”
Relief Rally Loses Steam as Trump Administrations U-turns Raise Concerns
Asian stocks ended their five-day winning streak as a short-lived global rally lost steam due to mixed messages from the Trump administration about China tariffs.
A regional stock index dropped 0.3% after Treasury Secretary Scott Bessent raised doubts about resolving the US-China trade war soon. Hong Kong's stocks fell 1.2%, their first drop in four days, and US and European futures also slipped..
Over the past week, President Trump criticized Fed Chair Jerome Powell but later backed off from asking for his resignation, leaving investors unsure about the future of tariffs on China despite numerous updates. A source told Reuters that the administration may lower tariffs on Chinese imports if talks with Beijing progress, following a Wall Street Journal report on the possibility.
However, Treasury Secretary Scott Bessent clarified that any tariff cuts would require agreements with China, a stance echoed by White House spokesperson Karoline Leavitt.
This constant flip-flopping from the White House is not inspiring any form of confidence at present and thus weighing on market sentiment once more.
The yen flipped after two days of losses and the dollar weakened. Gold jumped 1.2% in increased demand for the safe- haven asset as it trades around the $3325/oz handle heading into the European Open.
Currency Strength Chart, Strongest - Weakest: JPY, CHF, EUR, NZD, AUD, CAD, GBP, USD

Source: FinancialJuice
U.S. futures gave up some of their earlier gains, with Nasdaq futures dropping 0.32% and S&P 500 futures falling 0.23%. EUROSTOXX 50 futures fluctuated before settling flat, while FTSE futures slipped 0.04%.
Oil prices leveled off after dropping in the US session, as sources said OPEC+ might speed up oil production increases in June.
Tariff developments will remain front and center heading into the European session with China's Foreign Ministry Spokesperson Guo stating that China and the US are not in talks yet while stressing that respect is key for such talks to take place.
According to reports, the Trump administration could be looking to cut certain tariffs on the auto industry that carmakers say could badly hurt profits and jobs. Such a move could lead to improved sentiment and potentially another short-term relief rally.
Economic data releases
From a data standpoint, it’s a bit of a quieter one where European data is concerned with German Ifo the main data release.
From the UK we have the UK CBI data and some US earnings which will be released ahead of the US open and could have an impact on US futures and general sentiment as well.

For all market-moving economic releases and events, see the MarketPulse Economic Calendar. (click to enlarge)
Chart of the day - Gold (XAU/USD)
From a technical standpoint, Gold prices have seen wild swings this week rising to a high of 3500 before falling to a low yesterday of around 3259.
The selloff was largely down to improved sentiment and profit taking as well but it does appear that bulls have returned.
The confusion on the path forward in US-China relations has lead to renewed safe haven demand overnight which has seen Gold change structure to bullish on a four-hour timeframe.
Looking at the H4 chart below, and you can seen the rally in the Asian session to a high of around 3360 has seen a notable shift in structure.
A four-hour candle close below the 3277 handle will be needed for bears to take the upper hand once more. At present it appears as though a higher low has been printed with Gold possibly eyeing a fresh higher high beyond the 3360 handle.
All in all, Golds price action hints at further gains, but any mention of talks between the US and China could result in a complete change in market sentiment and send Gold lower once more.
Gold (XAU/USD) Four-Hour Chart, April 24, 2025

Source: TradingView.com (click to enlarge)
Support
- 3300
- 3277
- 3259
Resistance
- 3360
- 3380
- 3400
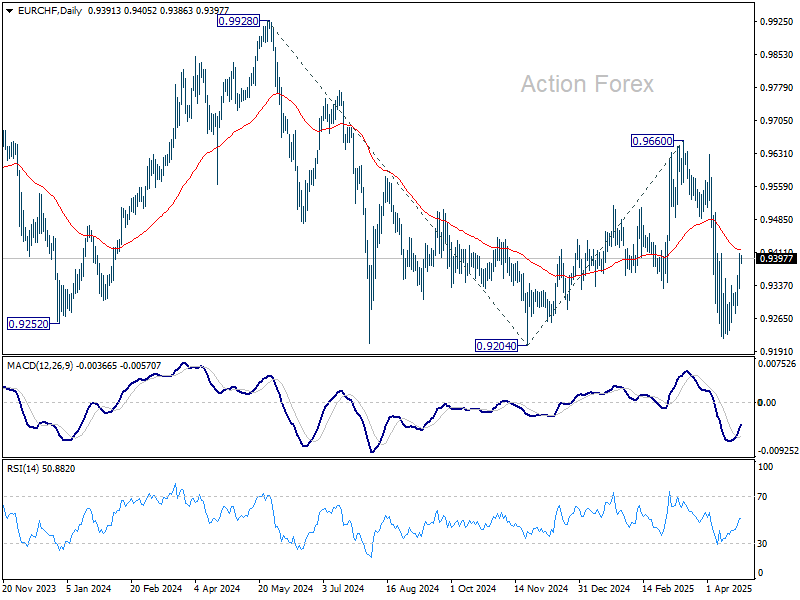
EUR/CHF Daily Outlook
Daily Pivots: (S1) 0.9352; (P) 0.9381; (R1) 0.9428; More....
Intraday bias in EUR/CHF stays neutral and outlook remains bearish with 0.9408 resistance intact. On the downside, firm break of 0.9204 low will confirm larger down trend resumption. However, sustained break of 0.9408 will suggest that fall from 0.9660 has already finished. Intraday bias will be back on the upside for this resistance instead.
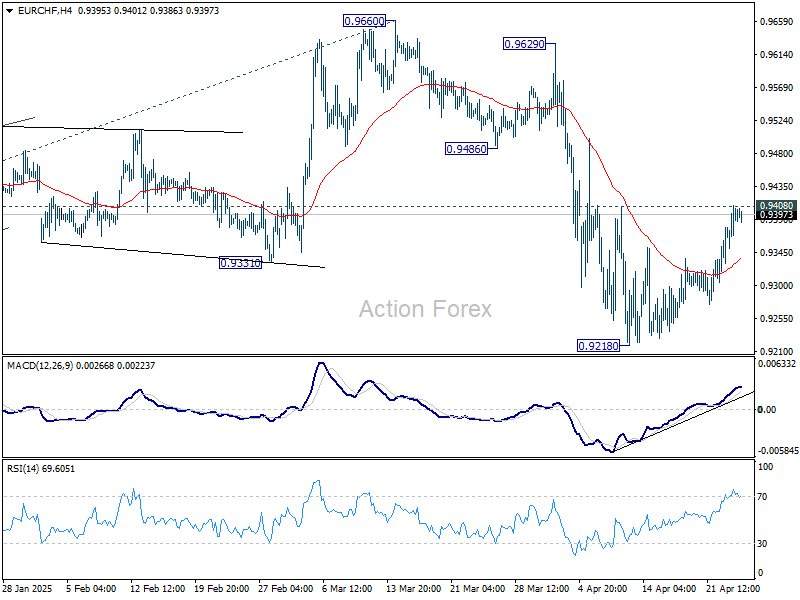
In the bigger picture, rejection by long-term falling channel resistance (now at 0.9600) retains medium term bearishness. That is, down trend from 1.2004 (2018 high) is still in progress. Firm break of 0.9204 (2024 low) will confirm resumption. Next target is 100% projection of 0.9928 to 0.9204 from 0.9660 at 0.8936.