Sample Category Title
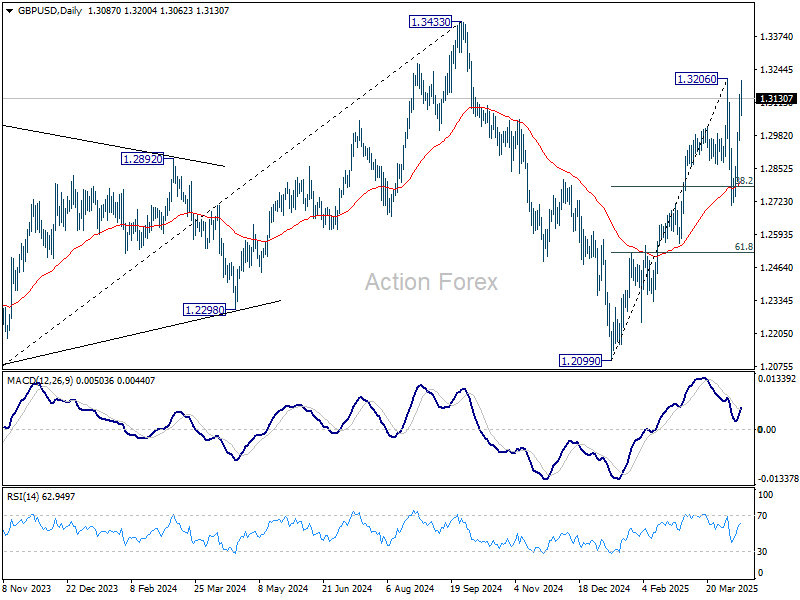
GBP/USD Mid-Day Outlook
Daily Pivots: (S1) 1.2987; (P) 1.3067; (R1) 1.3168; More...
No change in GBP/USD's outlook and intraday bias stays on the upside. Firm break of 1.3206 resistance will will resume the rally from 1.2099 to retest 1.3433 high. On the downside, below 1.3029 minor support will turn intraday bias neutral again first. But overall near term outlook will stay bullish as long as 1.2706 support holds.
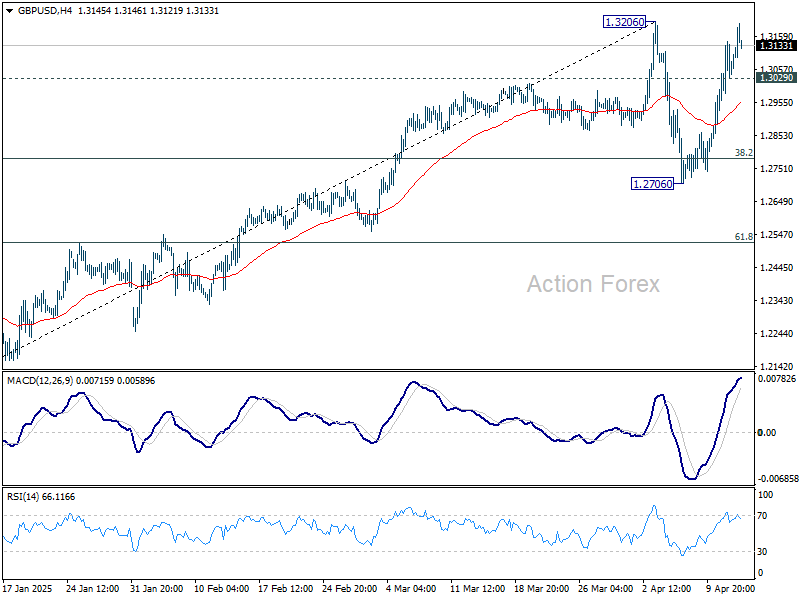
In the bigger picture, price actions from 1.3433 are seen as a corrective pattern to the up trend from 1.3051 (2022 low). Rise from 1.2099 could be the second leg. Overall, GBP/USD should target 1.4248 key resistance (2021 high) on break of 1.3433 at a later stage.
USD/JPY Daily Outlook
Daily Pivots: (S1) 142.16; (P) 143.44; (R1) 144.81; More...
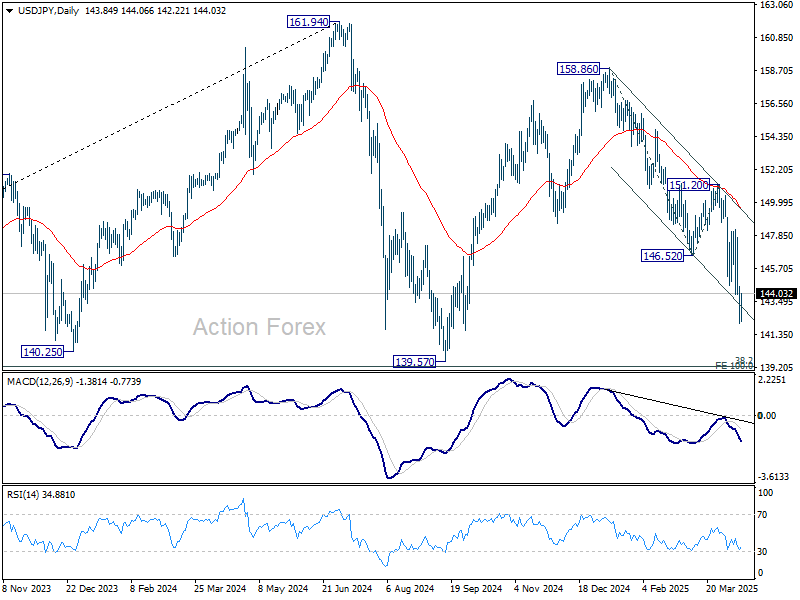
A temporary low should be in place at 142.05 and intraday bias in USD/JPY is turned neutral at this point. Stronger recovery might be seen but outlook will stay bearish as long as 151.20 resistance holds. Below 142.05 will resume the fall form 158.86 to 139.57 support.
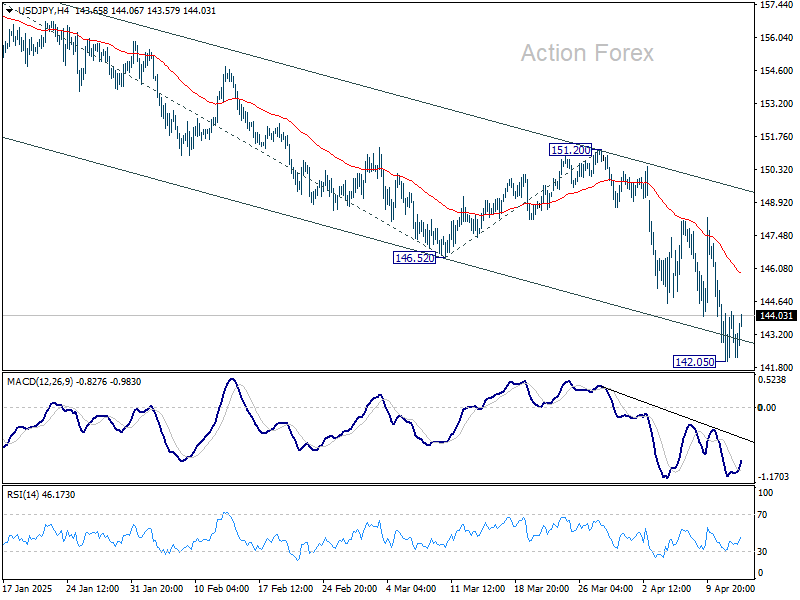
In the bigger picture, price actions from 161.94 are seen as a corrective pattern to rise from 102.58 (2021 low), with fall from 158.86 as the third leg. Strong support should be seen from 38.2% retracement of 102.58 to 161.94 at 139.26 to bring rebound. However, sustained break of 139.26 would open up deeper medium term decline to 61.8% retracement at 125.25.
USD/CHF Mid-Day Outlook
Daily Pivots: (S1) 0.8079; (P) 0.8173; (R1) 0.8246; More…
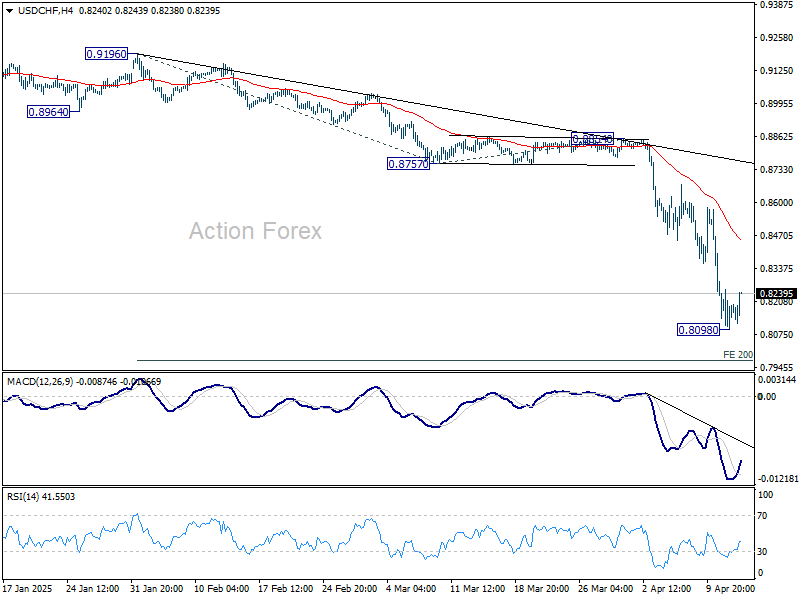
A temporary low is formed at 0.8098 in USD/CHF with current recovery. Intraday bias is turned neutral first for consolidations. While stronger rise might be seen, upside should be limited by 55 4H EMA (now at 0.8449) to bring another fall. On the downside, break of 0.8098 will resume recent down trend to 200% projection of 0.9196 to 0.8757 from 0.8854 at 0.7976 next.
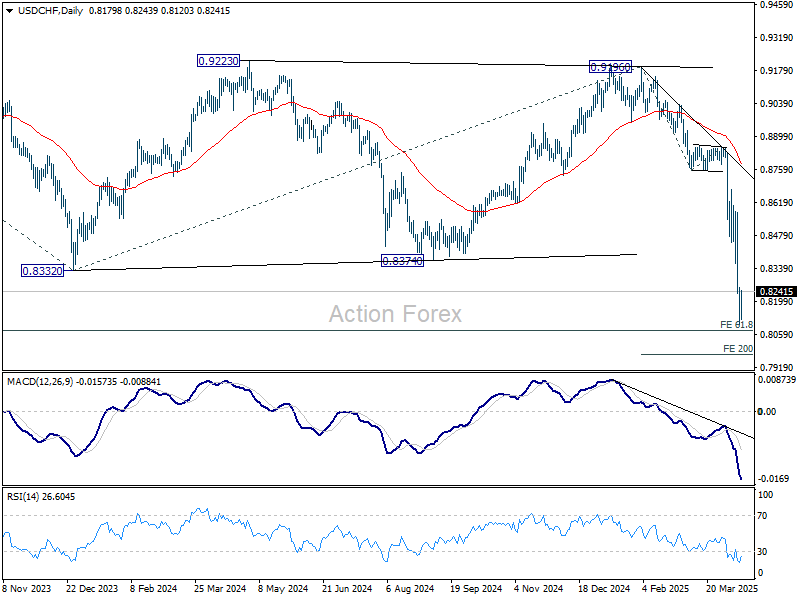
In the bigger picture, the break of 0.8332 (2023 low) confirms resumption of long term down trend from 1.0342 (2017 high). Next target is 61.8% projection of 1.0146 (2022 high) to 0.8332 from 0.9196 at 0.8075. Firm break there will target 100% projection at 0.7382.
Global Markets Rebound in Quiet Trade, Aussie Awaits RBA Insight
The global financial markets are enjoying a modest recovery today, with gains seen across Asia and Europe. US futures also point to a higher open, suggesting the bounce from last week’s dramatic selloff are having further legs. News flow is relatively light, with no major economic data releases, and tariff headlines have also slowed. The next big development on that front is expected to involve semiconductors, but traders will have to wait for details. In the meantime, markets appear to be taking a breather from the chaos.
Several Fed officials are due to speak today, though they are unlikely to provide fresh forward guidance given the highly fluid environment. Fed has so far emphasized the need for patience and data dependence, and that message is likely to be reinforced.
In the currency markets, Swiss Franc is underperforming as risk sentiment stabilizes, followed by Loonie and then Dollar. Sterling leads the day, buoyed by its risk-sensitive nature, while Kiwi and Aussie are also firm. Euro and Yen are relatively steady in the middle of the pack.
Looking ahead, RBA meeting minutes in the upcoming Asian session will be closely watched. The minutes may reiterate that the previous rate cut doesn’t necessarily start a new easing cycle. But the views may already be somewhat outdated, as the meeting occurred just before the US reciprocal tariff announcement and the subsequent market chaos. Still, they could offer insights into whether RBA board is leaning more toward inflation control or concerned about downside growth risks.
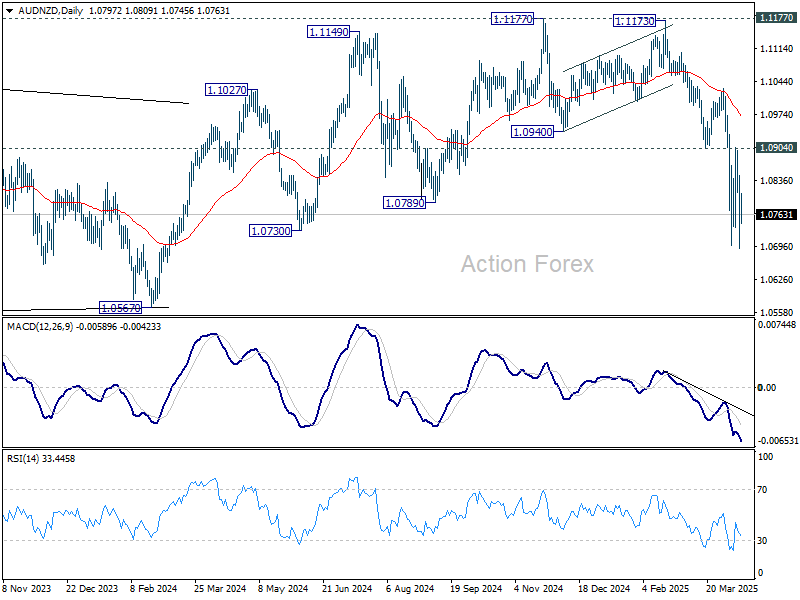
Technically, Aussie remains under pressure. It's the second-worst performer for the month, trailing only Dollar. Technically, while some extraordinarily volatility was even seen in AUD/NZD, near term outlook stays bearish with 1.0904 support turned resistance intact. Fall from 1.1177 is expected to continue to 1.0567 key medium term support next.
In Europe, at the time of writing, FTSE is up 1.78%. DAX is up 2.56%. CAC is up 2.24%. UK 10-year yield is down -0.102 at 4.665. Germany 10-year yield is down -0.051 at 2.523. Earlier in Asia, Nikkei rose 1.18%. Hong Kong HSI rose 2.40%. China Shanghai SSE rose 0.76%. Singapore Strait TImes rose 1.04%. Japan 10-year JGB yield fell -0.005 to 1.341.
OPEC trims 2025 oil demand outlook, WTI recovers mildly
OPEC has cut its forecast for global oil demand growth in 2025, now expecting an increase of 1.30m barrels per day, down -150k bpd from last month’s estimate.
In its latest monthly report, the group also lowered its projections for world economic growth for both 2024 and 2025, citing mounting uncertainties surrounding international trade policy and rising tariff tensions.
“The global economy showed a steady growth trend at the beginning of the year, however, recent trade-related dynamics have introduced higher uncertainty to the short-term global economic growth outlook,” OPEC noted.
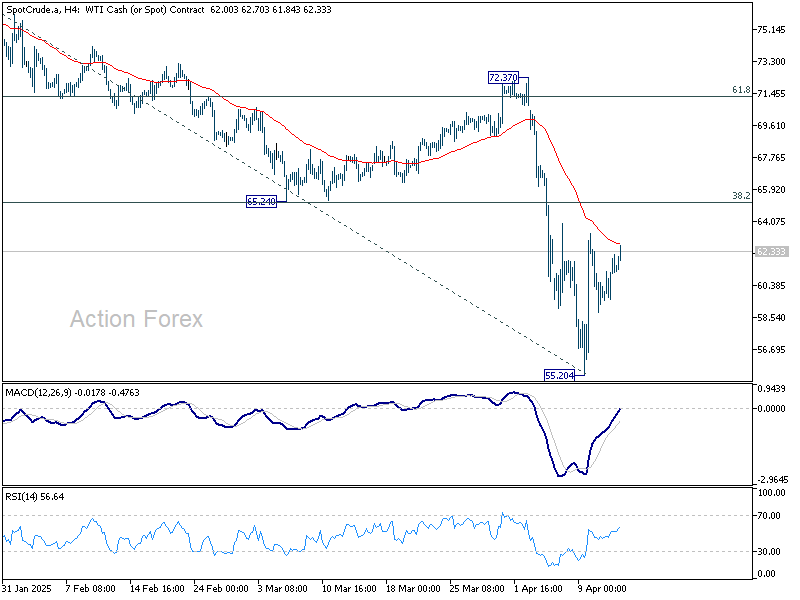
WTI crude oil recovers mildly today. But overall development suggests that it's still in consolidations above last week's low at 55.20. Outlook will stay bearish as long as 65.24 cluster resistance holds (38.2% retracement of 81.01 to 55.20 at 65.05 holds. Larger down trend is still in favor to resume through 55.20 at a later stage.
BoJ's Ueda: US tariffs add downside risks to Japan through various channels
BoJ Governor Kazuo Ueda warned today that the recently imposed U.S. tariffs are likely to exert “downward pressure” on both the global and Japanese economies through “various channels.”
While he did not specify the transmission mechanisms, the remarks reflect growing concerns that escalating trade tensions could weigh on exports, dampen corporate sentiment, disrupt supply chains, as well as trigger volatility in the financial markets including currencies.
Ueda reiterated BoJ’s commitment to achieving its 2% inflation target sustainably, noting that monetary policy would be guided appropriately based on evolving economic, price, and financial developments. He emphasized that the central bank will maintain a data-dependent approach and continue to scrutinize conditions “without any pre-conception”.
NZ BNZ services rises to 49.1, subdued despite hints of stabilization
New Zealand’s services sector remained in contraction in March, with the BusinessNZ Performance of Services Index inching up slightly to 49.1 from 49.0. This marks another month below the long-run average of 53.0 highlighting the ongoing weakness.
While the headline improvement was minimal, underlying components showed a mixed picture—activity/sales dropped from 49.1 to 47.4. But new orders/business climbed from 49.5 to 50.8, the highest since February 2024, suggesting some pickup in future demand. Employment rose from 49.1 to 50.2, ending a 15-month streak of contraction, and offering early signs that firms may be regaining confidence in hiring.
The share of negative comments from survey participants fell slightly to 56.7%, with ongoing concerns about high interest rates, inflation, weak consumer sentiment, and broader economic uncertainty. Businesses also cited external pressures such as global tariffs and rising input costs.
China’s export surge 12.4% yoy in Mar, imports down -4.3% yoy
China's exports jumped an impressive 12.4% yoy to USD 313.9B in March, significantly beating expectations of 4.4% yoy and marking a sharp acceleration from the 2.3% yoy growth recorded in January-February.
Particularly notable was the 9.18% yoy rise in shipments to the US, likely due to front-loading ahead of tariff tensions. Exports to ASEAN also strengthened with 11.6% yoy growth , with double-digit growth to major partners like Thailand (27.8% yoy) and Vietnam (18.9% yoy).
However, Vietnam, a key intermediary in China's export supply chain, is now under pressure to tighten controls on the origin of goods and materials. According to a ministry document, authorities in Hanoi are urging companies to clamp down on origin fraud to avoid punitive US tariffs, highlighting growing scrutiny on Chinese goods routed through third countries.
Meanwhile, the strength in exports contrasted with a -4.3% yoy decline in imports, resulting in a larger-than-expected trade surplus of USD 102.6B.
USD/CHF Mid-Day Outlook
Daily Pivots: (S1) 0.8079; (P) 0.8173; (R1) 0.8246; More…
A temporary low is formed at 0.8098 in USD/CHF with current recovery. Intraday bias is turned neutral first for consolidations. While stronger rise might be seen, upside should be limited by 55 4H EMA (now at 0.8449) to bring another fall. On the downside, break of 0.8098 will resume recent down trend to 200% projection of 0.9196 to 0.8757 from 0.8854 at 0.7976 next.
In the bigger picture, the break of 0.8332 (2023 low) confirms resumption of long term down trend from 1.0342 (2017 high). Next target is 61.8% projection of 1.0146 (2022 high) to 0.8332 from 0.9196 at 0.8075. Firm break there will target 100% projection at 0.7382.
OPEC trims 2025 oil demand outlook, WTI recovers mildly
OPEC has cut its forecast for global oil demand growth in 2025, now expecting an increase of 1.30m barrels per day, down -150k bpd from last month’s estimate.
In its latest monthly report, the group also lowered its projections for world economic growth for both 2024 and 2025, citing mounting uncertainties surrounding international trade policy and rising tariff tensions.
“The global economy showed a steady growth trend at the beginning of the year, however, recent trade-related dynamics have introduced higher uncertainty to the short-term global economic growth outlook,” OPEC noted.
WTI crude oil recovers mildly today. But overall development suggests that it's still in consolidations above last week's low at 55.20. Outlook will stay bearish as long as 65.24 cluster resistance holds (38.2% retracement of 81.01 to 55.20 at 65.05 holds. Larger down trend is still in favor to resume through 55.20 at a later stage.
EUR/USD Outlook: Major Bullish Breakout Supported Stagflation Risk in the US
- The narrowing of the Germany Manufacturing PMI to U.S. ISM Services PMI spread suggests that Germany's growth prospects have improved relative to those of the US.
- The preliminary April data from the University of Michigan’s Consumer Sentiment survey has heightened concerns about stagflation in the U.S.
- EUR/USD rallied to a 52-week high and may have kick-started a multi-month impulsive up move sequence.
This is a follow-up analysis of our prior publication, “EUR/USD Outlook: Germany's fiscal bazooka ignites Euro bulls, but a minor pullback is imminent as ECB looms” dated 5 March 2025.
Since our last analysis, the price actions of the EUR/USD have rallied towards 1.0940 on 17 March before it staged the expected minor corrective pull-back to retest the key 200-day moving average acting as a support at 1.0730 (printed an intraday low of 1.0733 on 27 March) as highlighted.
Thereafter, the EUR/USD resumed its bullish impulsive up move sequence with a rally of 6.9% to hit a 52-week high of 1.1474 on last Friday, 11 April, on the backdrop of the uncertainty surrounding the implementation of US reciprocal and sectoral-based trade tariffs.
US dollar confidence eroded due to rising stagflation risk
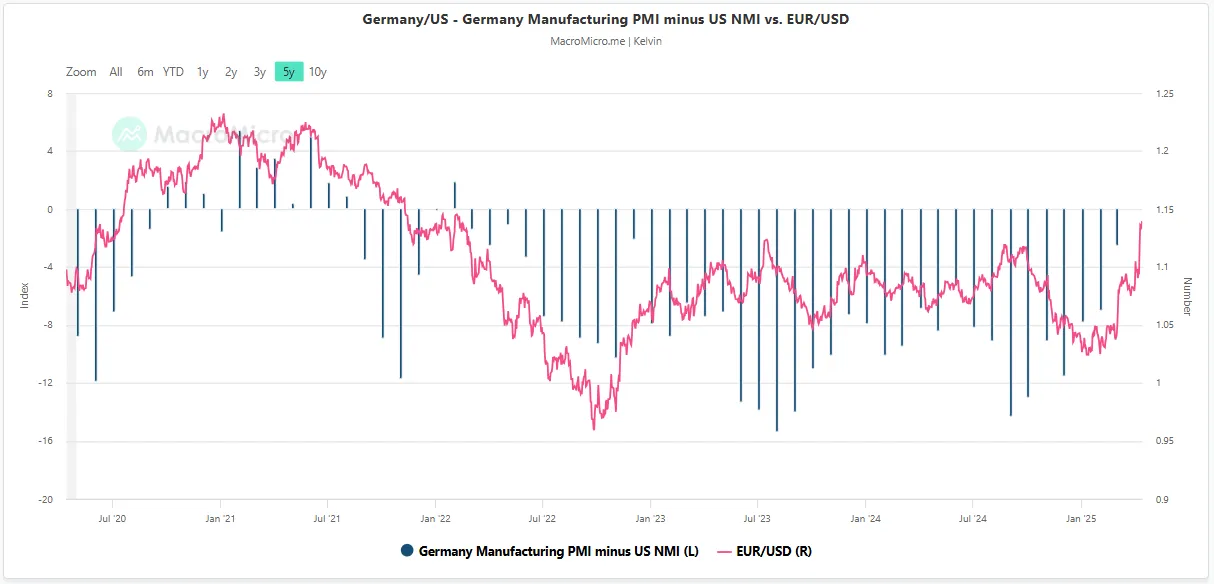
Fig 1: Germany Manufacturing PMI/US ISM Services PMI ratio with EUR/USD as of 14 Apr 2025 (Source: MacroMicro)
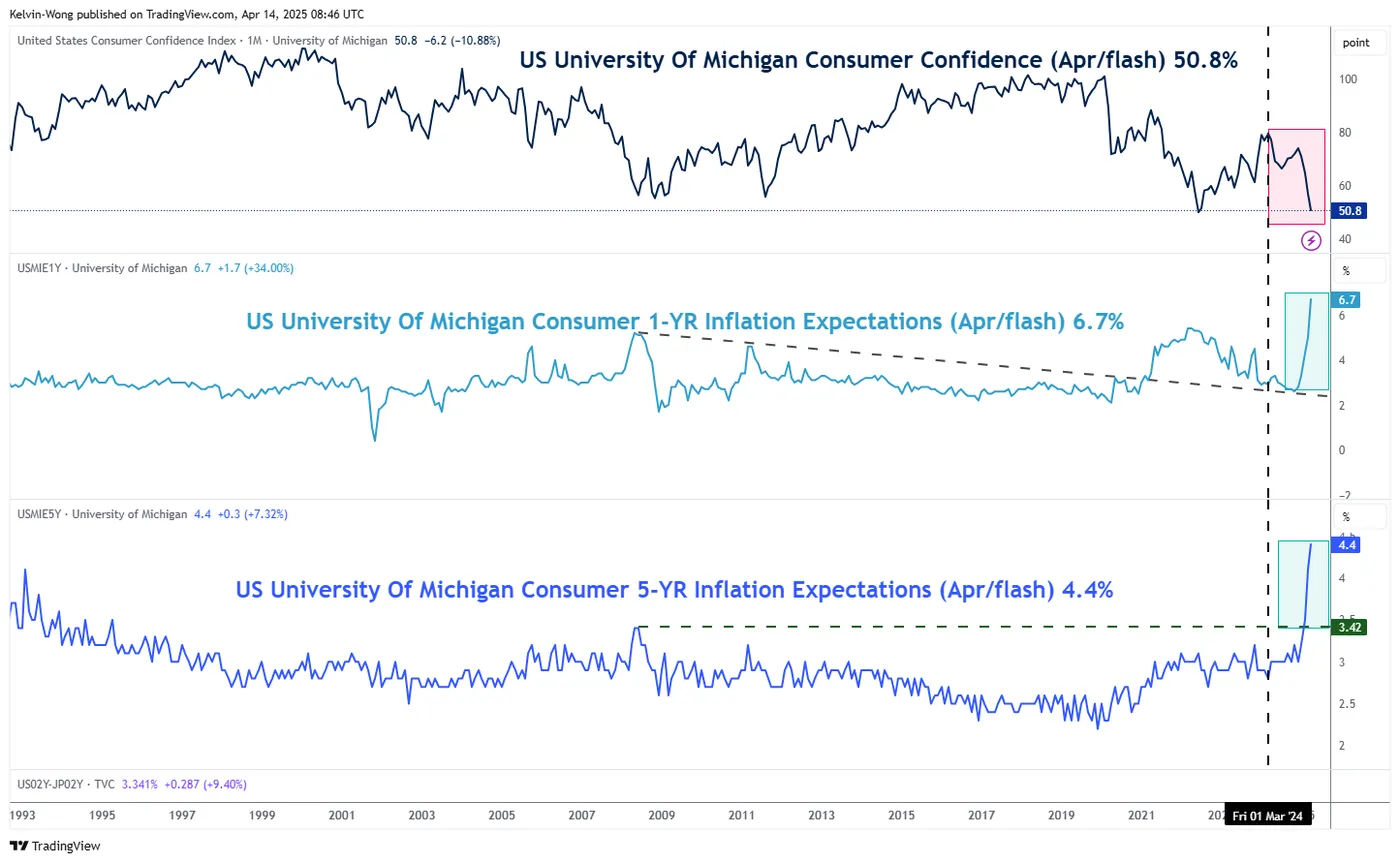
Fig 2: University of Michigan consumer sentiment with inflation expectations as of Apr 2025 (Source: TradingView)
Following the victory of the centre-right CDU/CSU in Germany's federal election on February 23, and with newly appointed Chancellor Friedrich Merz proposing aggressive fiscal policies aimed at boosting infrastructure and defence spending, business sentiment in Germany's key manufacturing sector has improved notably. This uptick contrasts with a decline in confidence within the U.S. services sector, an essential pillar of the American economy.
Reflecting this shift, the spread between Germany’s Manufacturing PMI and the U.S. ISM Services PMI narrowed to -2.5 in March, from -7.0 in February, highlighting a relative improvement in German economic momentum (see Fig 1)
Meanwhile, consumer confidence in the U.S, a leading indicator of future retail spending—has continued to deteriorate. According to preliminary data from the University of Michigan, sentiment fell for the fourth consecutive month, dropping to 50.8 in April from 57 in March. This marks the lowest reading since June 2022.
Adding to concerns, inflation expectations among U.S. consumers have surged. One-year-ahead inflation expectations jumped to 6.7% in April, the highest since November 1981 from 5.0% in March. Long-term five-year expectations also climbed to 4.4%, the highest since June 1991, up from 4.1% in the previous month (see Fig 2)
This combination of slowing growth and persistent inflation—hallmarks of a stagflation environment, poses a significant challenge for the U.S. Federal Reserve, which may find it increasingly difficult to implement counter-cyclical monetary policies to support the economy.
As a result, global investors may begin to question the “U.S. exceptionalism” narrative that has underpinned markets over the past five years. A shift in sentiment could prompt a reallocation away from U.S. fixed income and risk assets, potentially triggering a sustained weakening trend in the U.S. dollar.
Start of a multi-month bullish impulsive up move for EUR/USD
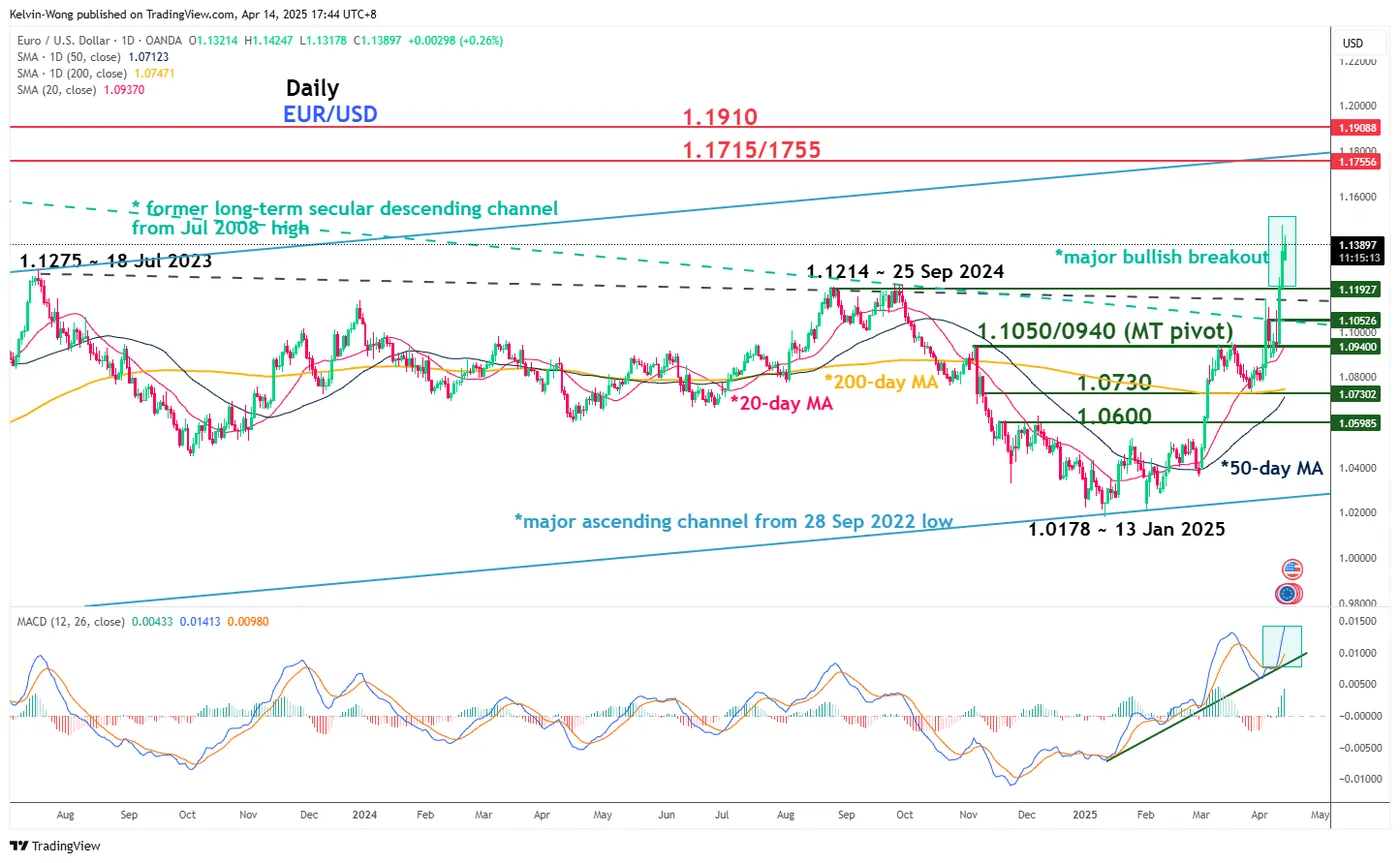
Fig 3: EUR/USD medium-term & major trends as of 14 Apr 2025 (Source: TradingView)
The recent strong up move seen in the EUR/USD on last Friday, 11 April, where it has staged a daily and weekly close above a former long-term secular descending channel resistance from its July 2008 major swing high.
In addition, the significant rebound sequence has occurred after a retest on the key 200-day moving average on 27 March, which suggests a major bullish breakout has occurred on the EUR/USD (see Fig 3).
Watch the 1.1050/1.0940 key medium-term pivotal resistance where a potential multi-month impulsive up move sequence may unfold for the EUR/USD for the next medium-term resistances to come in at 1.1715/1.1755, and 1.1910 in the first step.
However, a breakdown below 1.0940 negates the bullish tone to expose the major supports at 1.0730 (intersection point of the 50-day and 200-day moving averages), and 1.0600.
Dow Jones (DJIA), S&P 500 Forecast: Tech Tariff Pause Boosts Sentiment But Risks Remain
- Technology tariff pause boosts market sentiment, but uncertainties and potential volatility remain.
- Dow Jones and S&P 500 technical analysis highlights key support and resistance levels to watch.
- RSI indicator is approaching crucial level for monitoring potential shifts in market momentum.
Technology stocks surged, boosting Asian and European shares on Monday, after President Trump excluded smartphones and computers from China tariffs. This gave markets a breather after a week of sharp ups and downs.
Wall Street Indexes look set to follow suit with gains expected for major tech giants. There was still uncertainty as President Trump said on Sunday that tariffs on semiconductors would be announced within a week, and a decision on phones would come "soon."
Having finished last week on a positive note, market participants will be hoping for further gains this week. There are however, a host of risks to consider and markets are by no means out of the woods just yet. Expect further volatility as the tariff picture continues to develop.
On Friday last week, the fear and greed index was around the 13 mark which leaves it in extreme fear territory despite the positive end to the week. This should not come as a surprise as the recent US equity market sell-off ranks among the most severe short-term declines since 1929.
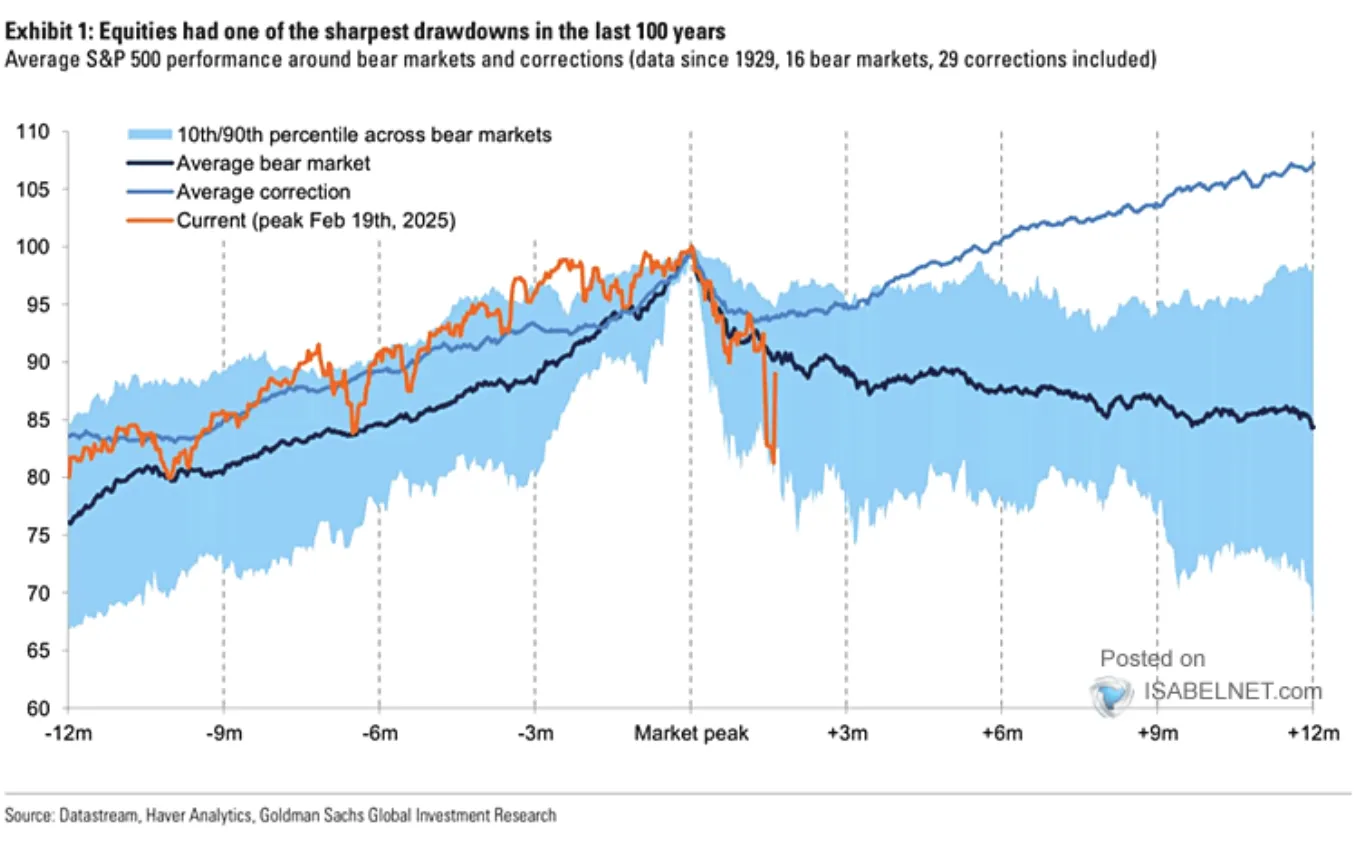
Source: IsabelNet, Haver Analytics, Goldman Sachs Global Investment Research
Monday will be a quiet day in terms of data, but tariff announcements or updates may move the needle for US indices. There is also a host of Federal Reserve policymakers on the docket later in the day which could add further uncertainty for market participants to navigate.
Technical Analysis - Dow Jones and S&P 500
Dow Jones (US30) Daily Chart, April 14, 2025
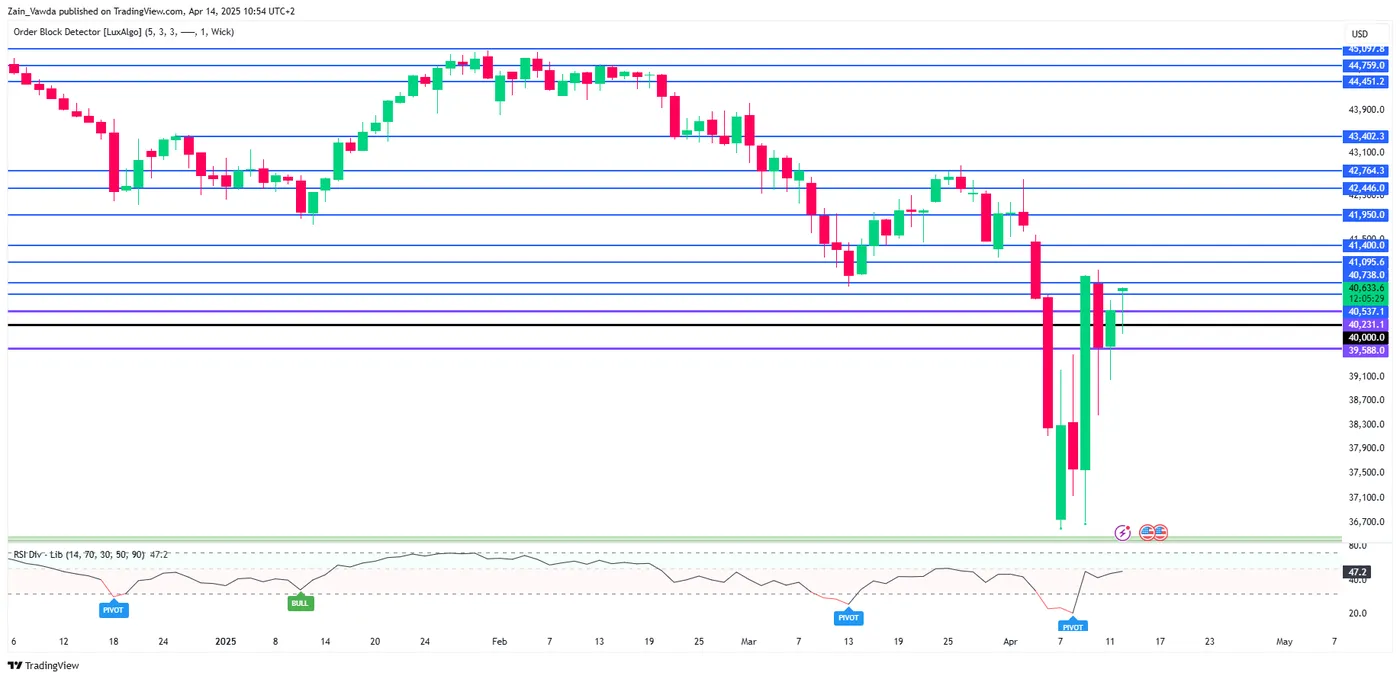
Source: TradingView (click to enlarge)
From a technical standpoint, the Dow Jones finished last week with a gain of around 5.22% and gapped higher over the weekend.
The gap higher down to the developments over the weekend regarding technology equipment being exempt from tariffs, for the time being.
The 14-period RSI on a daily timeframe may be a good indicator to keep an eye on. The RSI is currently approaching the 50 neutral level with a rejection likely to lead to fresh lows and a sign that momentum remains in favor of bears. A break above the 50 mark may be seen as a sign of a shift in momentum and could embolden bulls.
Should bulls prevail, markets will be eyeing 41095 and 41400 before the 41950 handle comes into focus.
A bearish push from here may find support at the psychological 40000 mark before 39588 and 39000 come into focus.
Support
- 40000
- 39588
- 39000
Resistance
- 41095
- 41400
- 41950
S&P 500
Looking at the S&P 500 and the chart almost mirrors the Dow Jones.
I will also be paying close attention to the period-14 RSI on a daily timeframe to monitor any potential momentum shifts.
A break higher does face some crucial levels with the 5500 handle also hosting the 20-day MA before markets eye 5538 and 5635.
A push lower for the S&P 500 and markets will look for potential support at 5391, 5330 and 5267 respectively.
For both indexes tariff developments and overall sentiment hold the keys. Any moves will largely depend on how this develops over the course of the day and week ahead.
S&P 500 Daily Chart, April 14, 2025
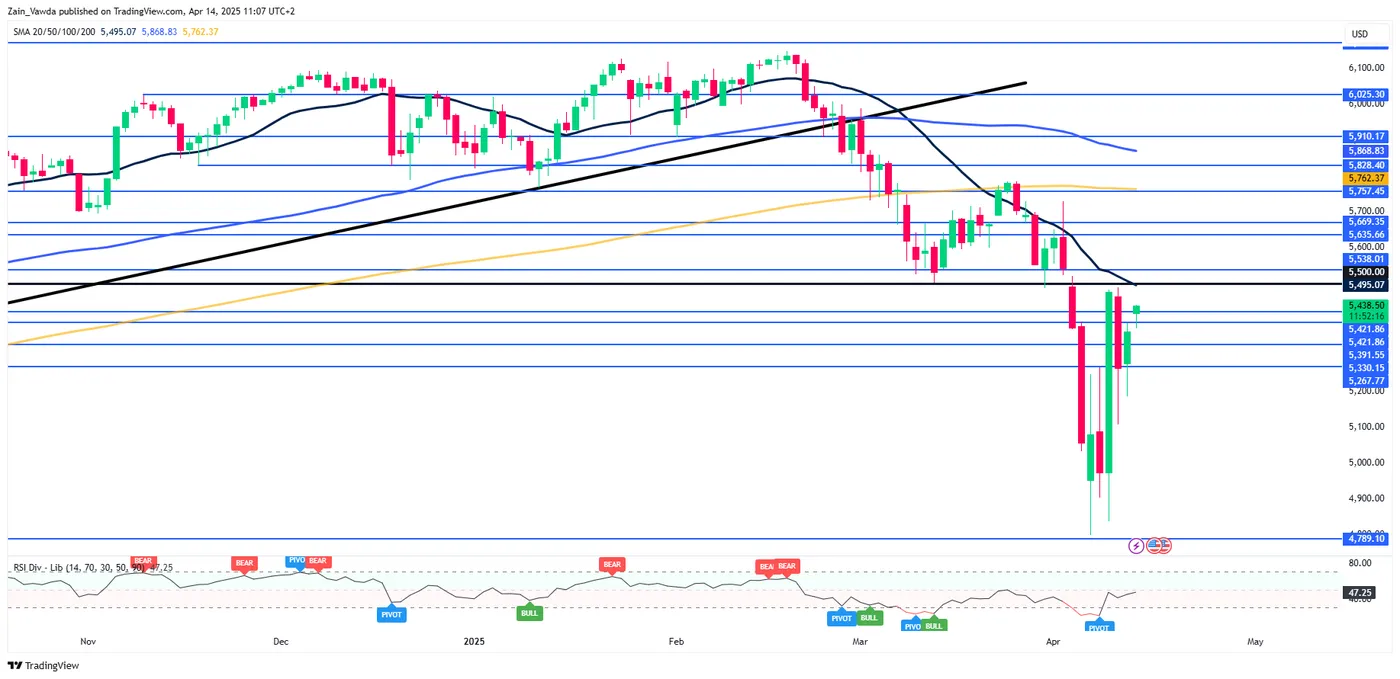
Source: TradingView (click to enlarge)
Support
- 5391
- 5330
- 5267
Resistance
- 5500
- 5538
- 5635
Trump Exempts Electronics from Tariffs; Nasdaq 100 Opens with Bullish Gap
Despite the weekend, the news flow remained intense amid the escalating trade war. According to media reports:
→ Certain tech products, including those made by Apple, have been exempted from Trump’s tariffs.
→ Trump announced he would make a significant statement regarding semiconductor tariffs on Monday, 14 April.
Stock Indices React to Trump’s Tariff Moves
These announcements were taken positively by the markets. As shown on the chart of the Nasdaq 100 index (US Tech 100 mini on FXOpen), the new week opened with a bullish gap exceeding 1.5% – a stronger performance than the S&P 500 (US SPX 500 mini on FXOpen), which also saw a bullish gap.
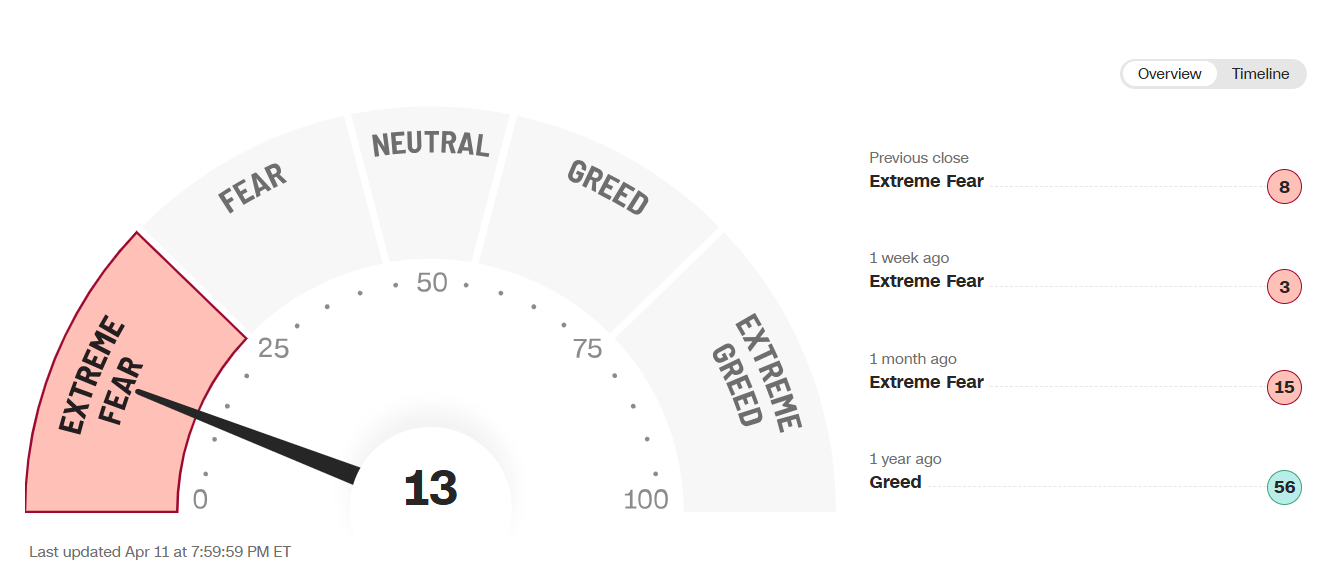
This may suggest that market participants are cautiously optimistic that the sweeping tariff measures might be eased through exemptions, delays, or negotiation concessions. Nevertheless, the CNN Business Fear & Greed Index remains in "extreme fear" territory, despite inching higher compared to last week.
As of this morning, the Nasdaq 100 (US Tech 100 mini on FXOpen) has recovered approximately 15% from its 2025 low.
Technical Analysis: Nasdaq 100 (US Tech 100 mini on FXOpen)
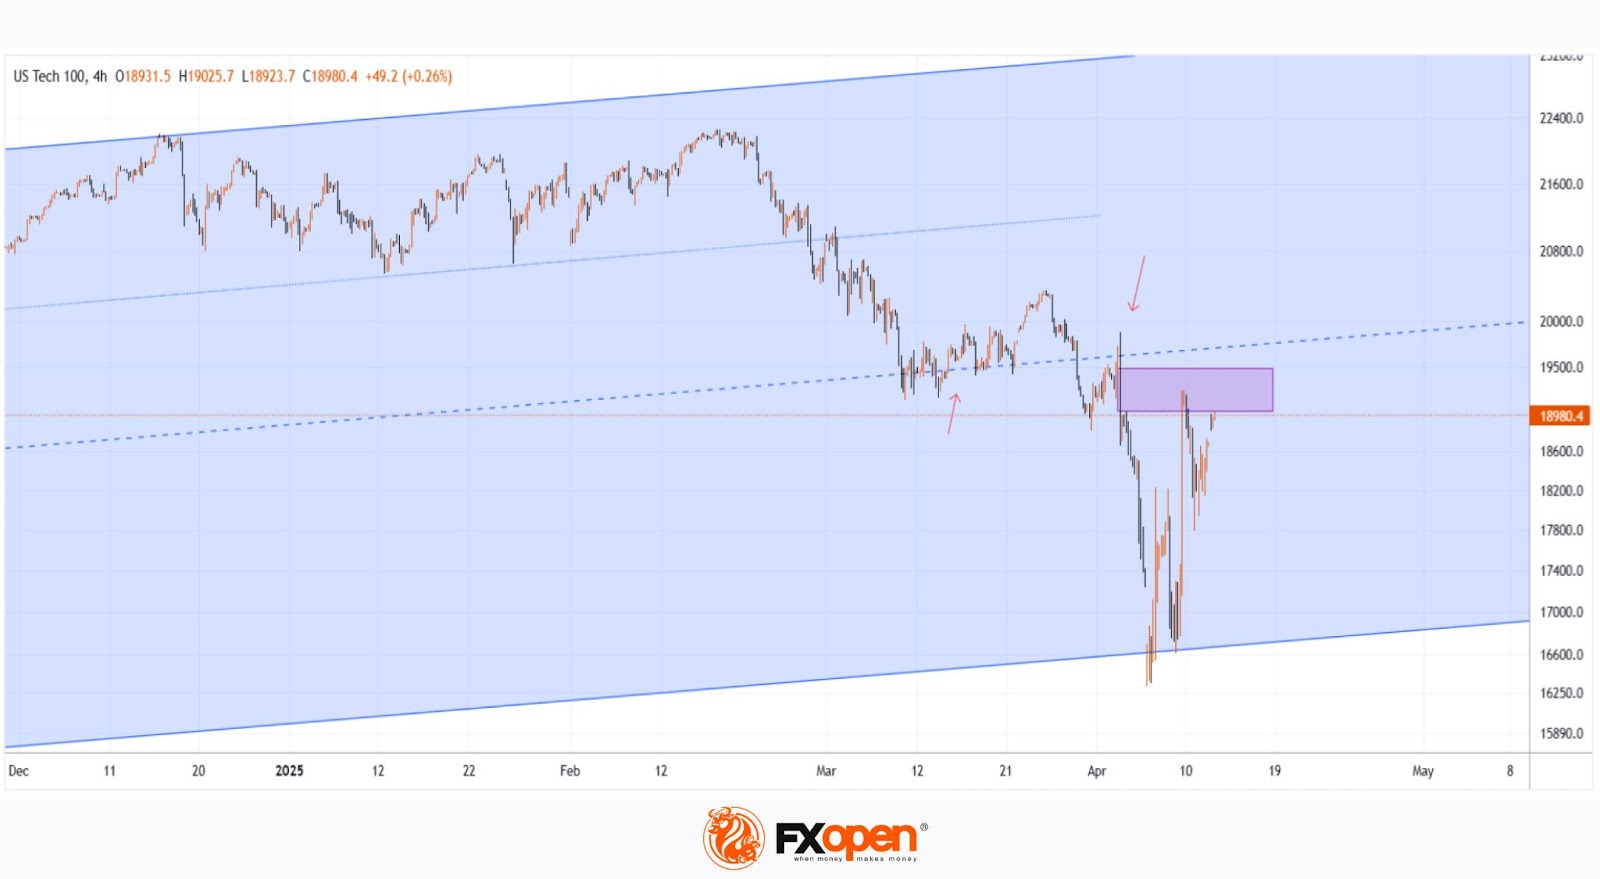
Seven days ago, we plotted an ascending blue channel and suggested that its lower boundary could act as support – which has indeed played out.
With the latest data in hand, there is reason to believe that bulls may now be aiming to push the price up toward the channel’s median line. However, as indicated by the arrows on the chart, this median appears to have shifted from acting as support to acting as resistance.
Bulls may also face headwinds from the wide bearish candle to the left, which was formed in reaction to Trump's tariff announcements. According to Smart Money Concept methodology, this area – marked by a bearish Fair Value Gap (highlighted with a rectangle) – may now serve as resistance.
Trade global index CFDs with zero commission and tight spreads. Open your FXOpen account now or learn more about trading index CFDs with FXOpen.
This article represents the opinion of the Companies operating under the FXOpen brand only. It is not to be construed as an offer, solicitation, or recommendation with respect to products and services provided by the Companies operating under the FXOpen brand, nor is it to be considered financial advice.
Trade Complicates Japan’s Delicate Dance Toward Rate Normalisation
Above-target inflation and relatively robust activity growth have allowed the Bank of Japan to slowly step away from the zero lower bound. But Japan now faces the challenge of negotiating a trade agreement with the US while trying to support the confidence that has been key to this success.
The world has shifted monumentally since the Bank of Japan’s last meeting. Above-target inflation and relatively robust activity growth has allowed the Bank to slowly step away from the zero lower bound. But Japanese authorities are now faced with the challenge of negotiating a trade agreement with the US while supporting the confidence that has been so critical to their success with inflation and growth. Success will be critical if the policy rate is to reach the 1.0% ‘neutral’ terminal rate as hoped.
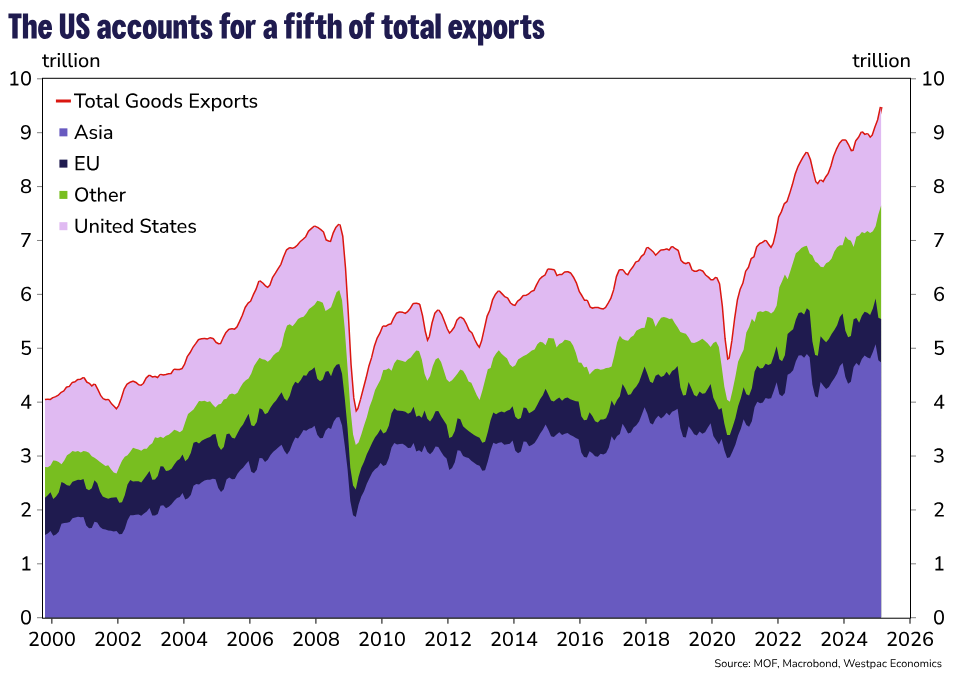
In considering what is at stake for the Japanese economy, it is worth contextualising the US-Japan trade relationship and its links to the domestic economy. Just over 20% of Japan’s goods exports go to the US, over 70% of which is machinery and transport equipment, an industry that accounts for 15% of GDP. The OECD estimates that the value added in exports to the US equate to 2% of Japan’s GDP.
The US ‘reciprocal’ tariffs included a 24% tariff on Japanese goods. The 90-day pause has set that back to 10% with the whole tariff reportedly up for negotiation. Any Japanese deal is likely to see some of its manufacturing relocated to the US in exchange for softer tariffs.
At present, many Japanese companies have factories across Asia to capitalise on cheaper labour. We have previously argued this poses structural downward pressure on the yen as earnings from these subsidiaries are often reinvested back into offshore operations instead of being repatriated. Increased investment by Japan into US auto manufacturing is likely to be a key part of the expected agreement.
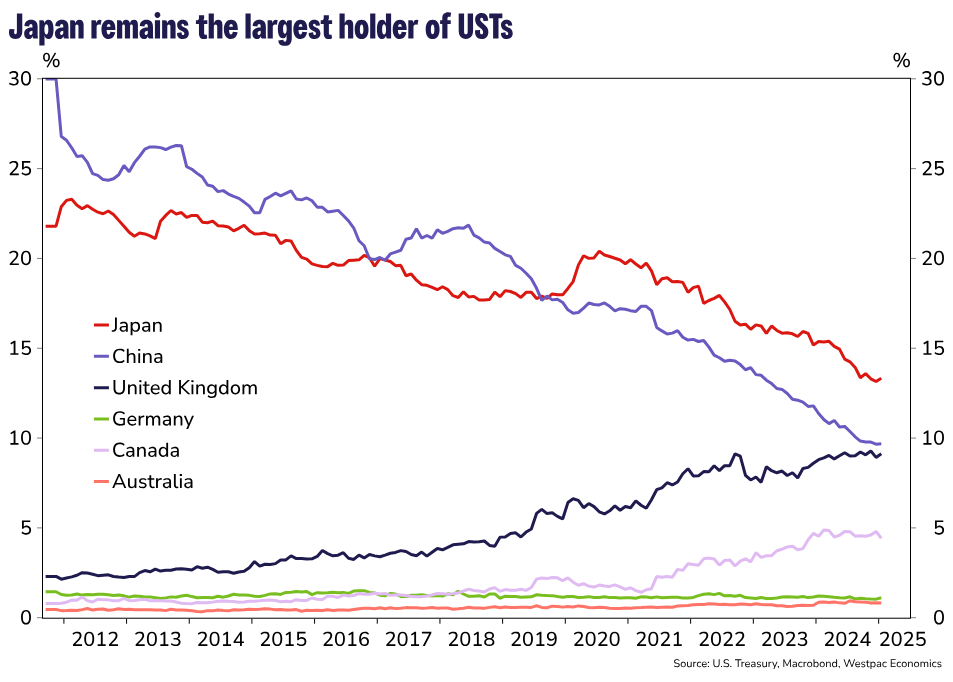
Japan comes to the negotiating table with its own strengths. Japan is the second largest holder of long-term US securities. US holdings of Japanese securities are about half that of Japanese holdings of US securities. Japan is also currently the largest single-country holder of US Treasuries according to US Treasury International Capital data. Looking ahead, the US will need buyers for its Treasuries as deficits persist and if, as Westpac Head of Financial Markets Strategy Martin Whetton noted, US government bonds erode their status as a safe haven, this task will become increasingly difficult. Japan’s status as an ‘investor to the developed world’ will likely hold significant weight in these negotiations, even if a pledge to continue investing in Treasuries is not explicitly made.
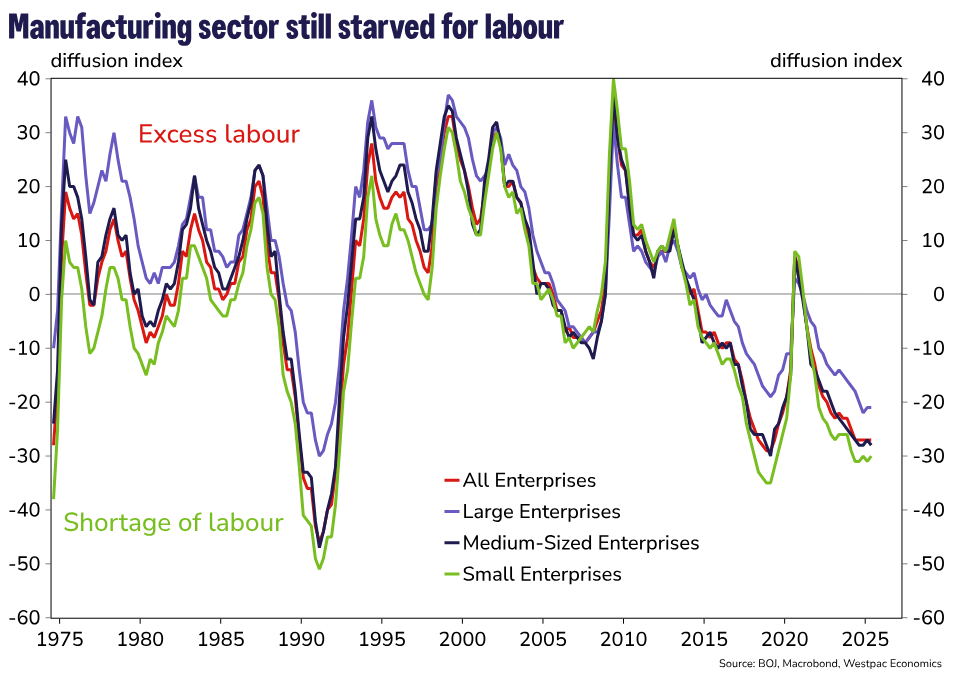
The manufacturing sector has been a bedrock of the Japanese economy for decades. Looking ahead, with a declining population, it is difficult to see output in the economy expanding on the back of services alone, which tends to be quite labour intensive with moderate-to-low marginal returns on capital. Investment into efficient manufacturing and strength in exports will be a key support of economic growth for years to come and is required for a neutral monetary policy rate meaningfully above the zero-lower bound to be sustained. While the fruits of productive expansion may seem like a thought for the distant future, the investment needed to yield those outcomes is required now.
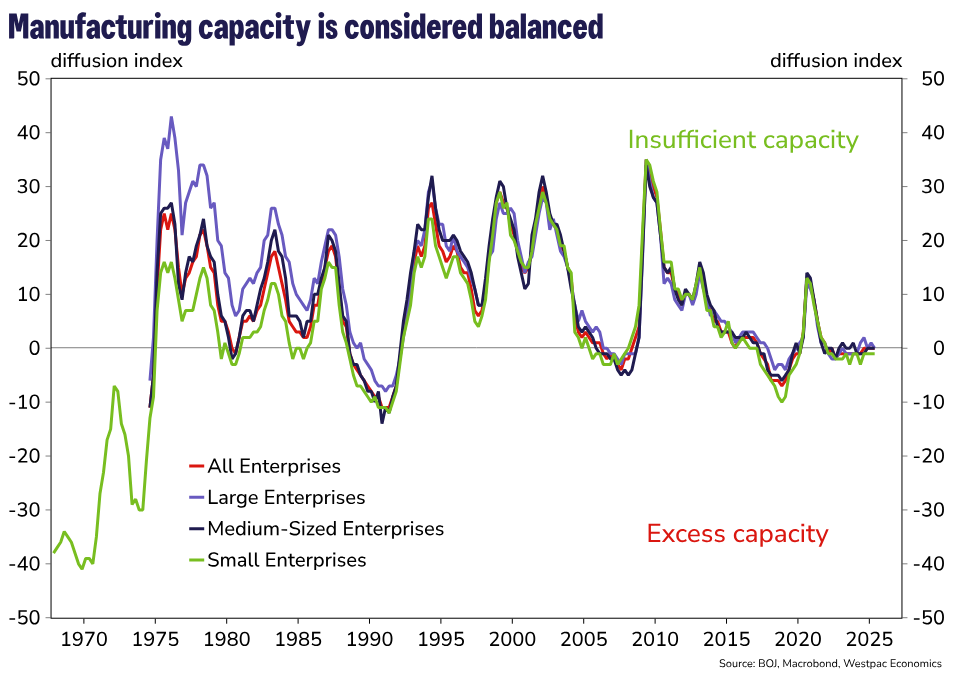
Crucially, it is confidence amongst Japanese businesses that will help the nation realise its economic potential. The latest Tankan results, which were collected prior to recent trade developments, showed manufacturing firms expect a relatively higher degree of labour shortages versus history and a net neutral assessment of productive capacity in the future. That is, there is no expectation for excess capacity across the manufacturing sector.
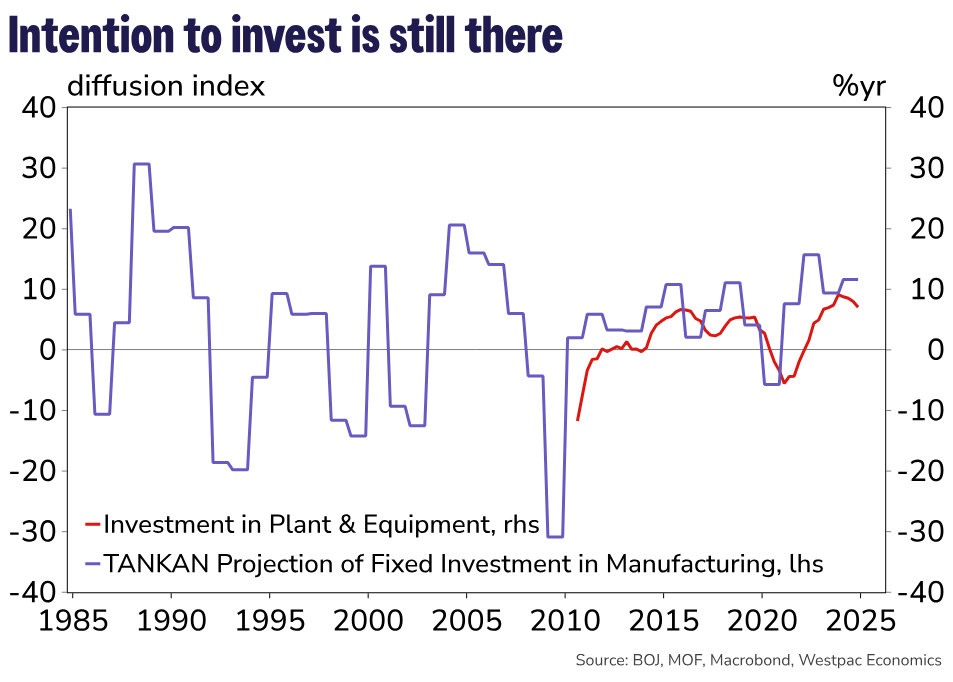
Sentiment around investment, as reported in the annual survey in December, was near the pre-Asian financial crisis peak. Japanese businesses have also walked the walk – investment in plant and equipment has not been this high on a sustained basis since data collection began in 2010. The appetite for investment has certainly been there but it may have been lost in the chaos of the US tariff shock.
Maintaining business confidence through successful trade negotiation with the US will be crucial in determining how the path for policy evolves. Despite the enormity of the challenge, we anticipate Japan’s strong position as an exporter of manufactured goods and net lender to the world will help secure favourable terms for Japan-US trade with limited concessions.
Our baseline view is that tariffs on Japanese goods remain capped at 10%, explicitly or implicitly in exchange for continued purchases of US Treasuries and further investment and collaboration between Japan and the US in the auto industry.
We now anticipate that the Bank of Japan will raise rates once more in 2025 at the July meeting and again in March 2026 to a 1.0% terminal rate. By July, there should be greater clarity on trade policy in the US as well as Japanese domestic policy as it relates to the House of Councillors elections. From there, the outlook is predicated on how businesses adapt to a new world of tariffs and whether this hampers their ability to raise wages for FY2026. Another strong wage print will help justify the case for a final hike in 2026.
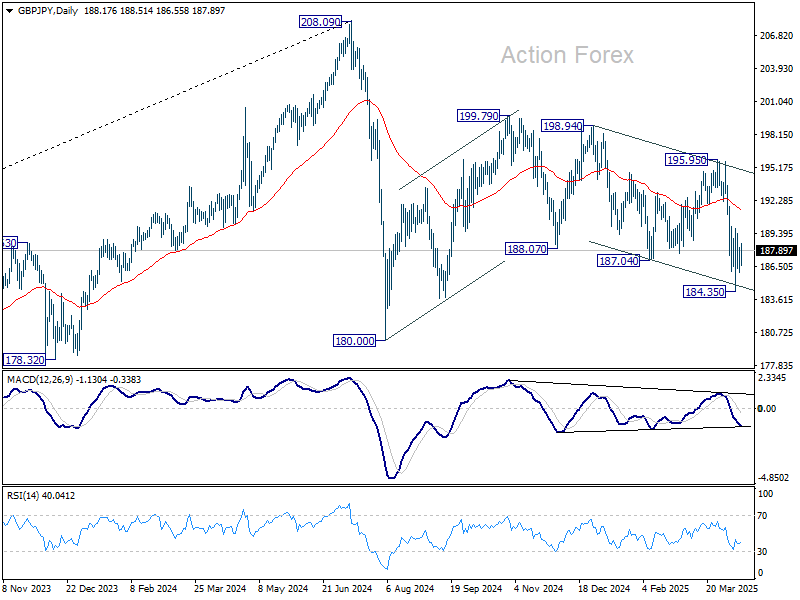
GBP/JPY Daily Outlook
Daily Pivots: (S1) 186.52; (P) 187.36; (R1) 188.71; More...
GBP/JPY is staying in consolidations above 184.35 and intraday bias remains neutral for now. Risk will stay on the downside as long as 190.06 resistance holds. Below 184.35 will target 180.00 low. Nevertheless, break of 190.06 will turn bias back to the upside for stronger rebound.
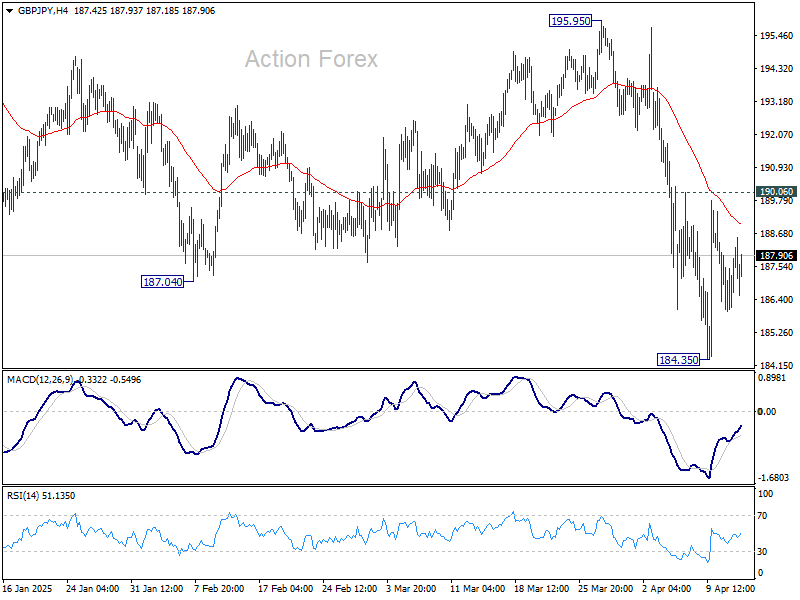
In the bigger picture, price actions from 208.09 are seen as a correction to rally from 123.94 (2020 low). Strong support should be seen from 38.2% retracement of 123.94 to 208.09 at 175.94 to contain downside. However, sustained break of 175.94 will bring deeper fall even still as a correction.