
Sample Category Title
Dow Jones (DJIA), S&P 500 Forecast: Tech Tariff Pause Boosts Sentiment But Risks Remain
- Technology tariff pause boosts market sentiment, but uncertainties and potential volatility remain.
- Dow Jones and S&P 500 technical analysis highlights key support and resistance levels to watch.
- RSI indicator is approaching crucial level for monitoring potential shifts in market momentum.
Technology stocks surged, boosting Asian and European shares on Monday, after President Trump excluded smartphones and computers from China tariffs. This gave markets a breather after a week of sharp ups and downs.
Wall Street Indexes look set to follow suit with gains expected for major tech giants. There was still uncertainty as President Trump said on Sunday that tariffs on semiconductors would be announced within a week, and a decision on phones would come "soon."
Having finished last week on a positive note, market participants will be hoping for further gains this week. There are however, a host of risks to consider and markets are by no means out of the woods just yet. Expect further volatility as the tariff picture continues to develop.
On Friday last week, the fear and greed index was around the 13 mark which leaves it in extreme fear territory despite the positive end to the week. This should not come as a surprise as the recent US equity market sell-off ranks among the most severe short-term declines since 1929.
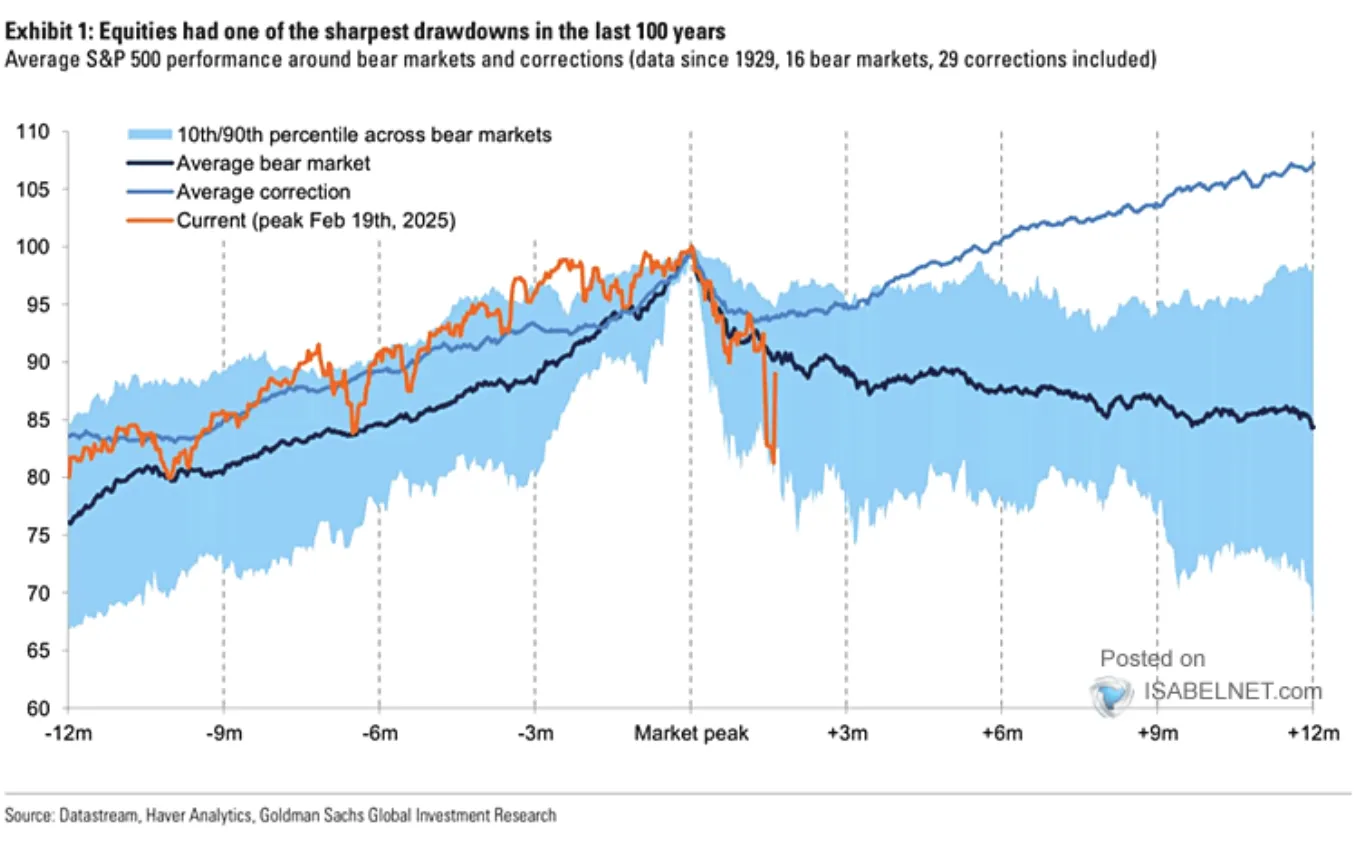
Source: IsabelNet, Haver Analytics, Goldman Sachs Global Investment Research
Monday will be a quiet day in terms of data, but tariff announcements or updates may move the needle for US indices. There is also a host of Federal Reserve policymakers on the docket later in the day which could add further uncertainty for market participants to navigate.
Technical Analysis - Dow Jones and S&P 500
Dow Jones (US30) Daily Chart, April 14, 2025
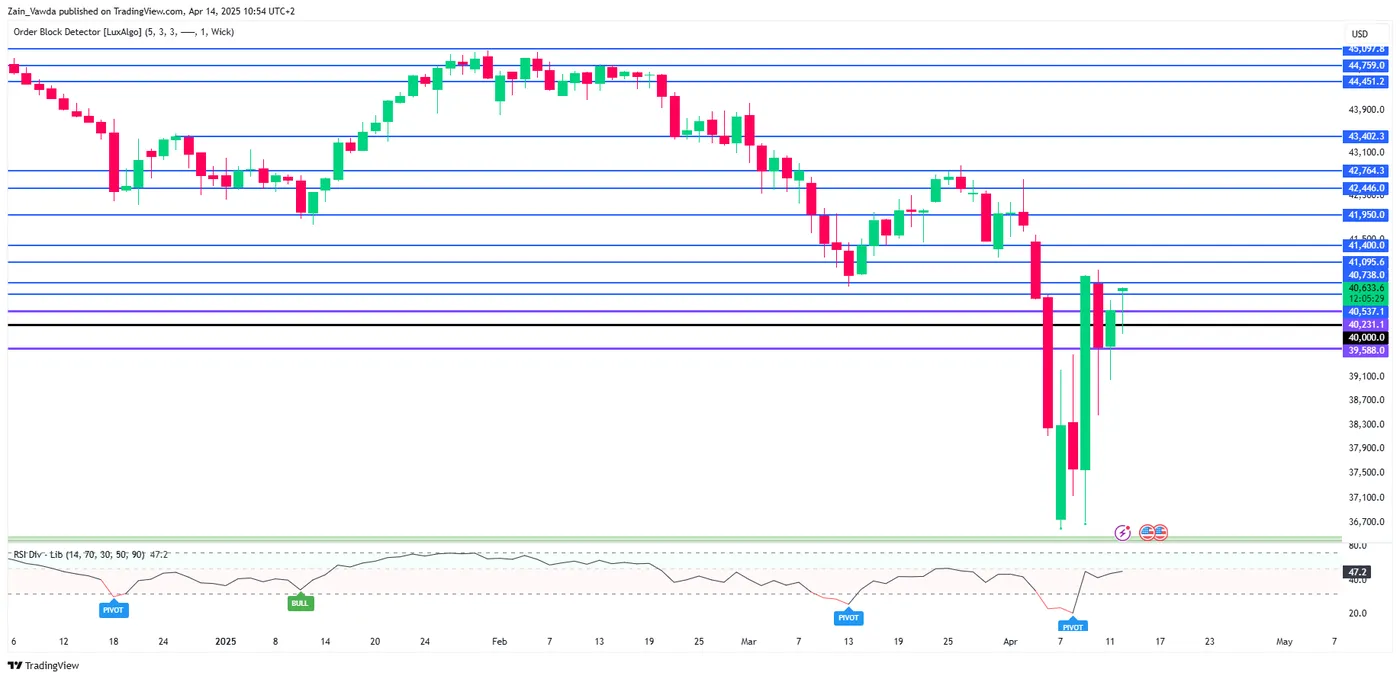
Source: TradingView (click to enlarge)
From a technical standpoint, the Dow Jones finished last week with a gain of around 5.22% and gapped higher over the weekend.
The gap higher down to the developments over the weekend regarding technology equipment being exempt from tariffs, for the time being.
The 14-period RSI on a daily timeframe may be a good indicator to keep an eye on. The RSI is currently approaching the 50 neutral level with a rejection likely to lead to fresh lows and a sign that momentum remains in favor of bears. A break above the 50 mark may be seen as a sign of a shift in momentum and could embolden bulls.
Should bulls prevail, markets will be eyeing 41095 and 41400 before the 41950 handle comes into focus.
A bearish push from here may find support at the psychological 40000 mark before 39588 and 39000 come into focus.
Support
- 40000
- 39588
- 39000
Resistance
- 41095
- 41400
- 41950
S&P 500
Looking at the S&P 500 and the chart almost mirrors the Dow Jones.
I will also be paying close attention to the period-14 RSI on a daily timeframe to monitor any potential momentum shifts.
A break higher does face some crucial levels with the 5500 handle also hosting the 20-day MA before markets eye 5538 and 5635.
A push lower for the S&P 500 and markets will look for potential support at 5391, 5330 and 5267 respectively.
For both indexes tariff developments and overall sentiment hold the keys. Any moves will largely depend on how this develops over the course of the day and week ahead.
S&P 500 Daily Chart, April 14, 2025
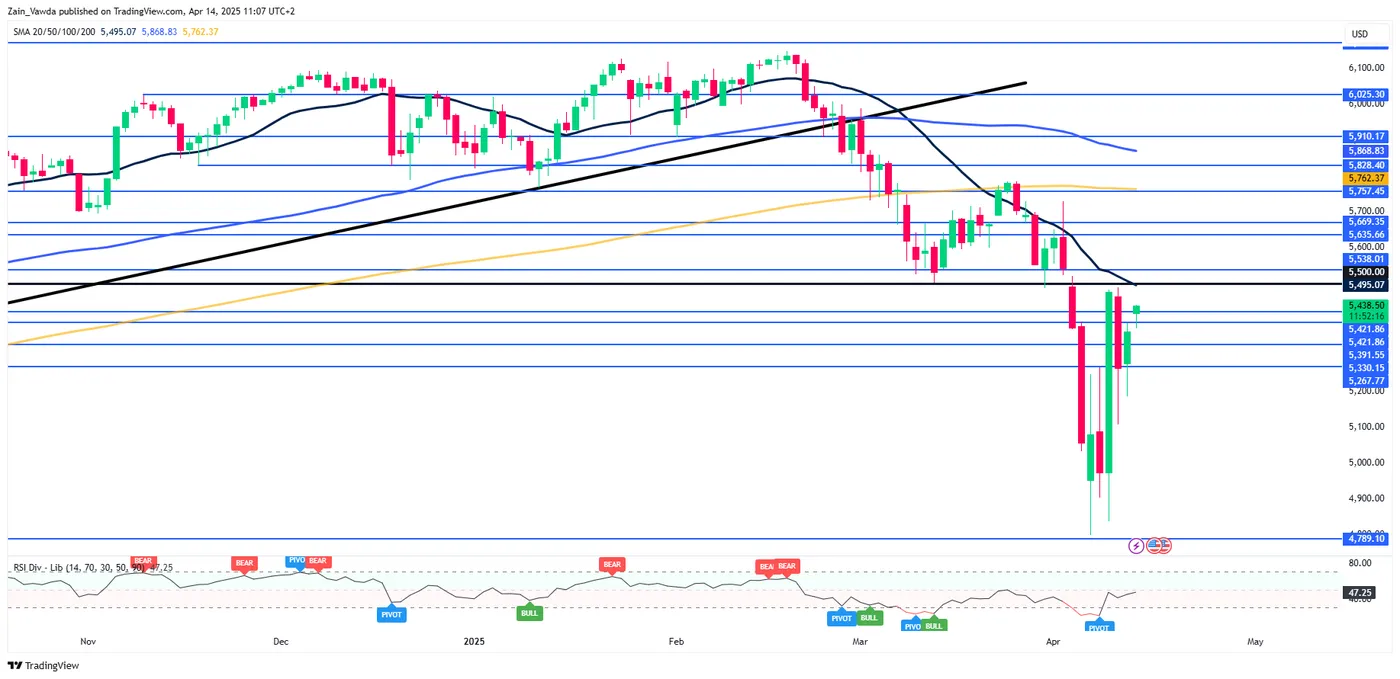
Source: TradingView (click to enlarge)
Support
- 5391
- 5330
- 5267
Resistance
- 5500
- 5538
- 5635
Trump Exempts Electronics from Tariffs; Nasdaq 100 Opens with Bullish Gap
Despite the weekend, the news flow remained intense amid the escalating trade war. According to media reports:
→ Certain tech products, including those made by Apple, have been exempted from Trump’s tariffs.
→ Trump announced he would make a significant statement regarding semiconductor tariffs on Monday, 14 April.
Stock Indices React to Trump’s Tariff Moves
These announcements were taken positively by the markets. As shown on the chart of the Nasdaq 100 index (US Tech 100 mini on FXOpen), the new week opened with a bullish gap exceeding 1.5% – a stronger performance than the S&P 500 (US SPX 500 mini on FXOpen), which also saw a bullish gap.
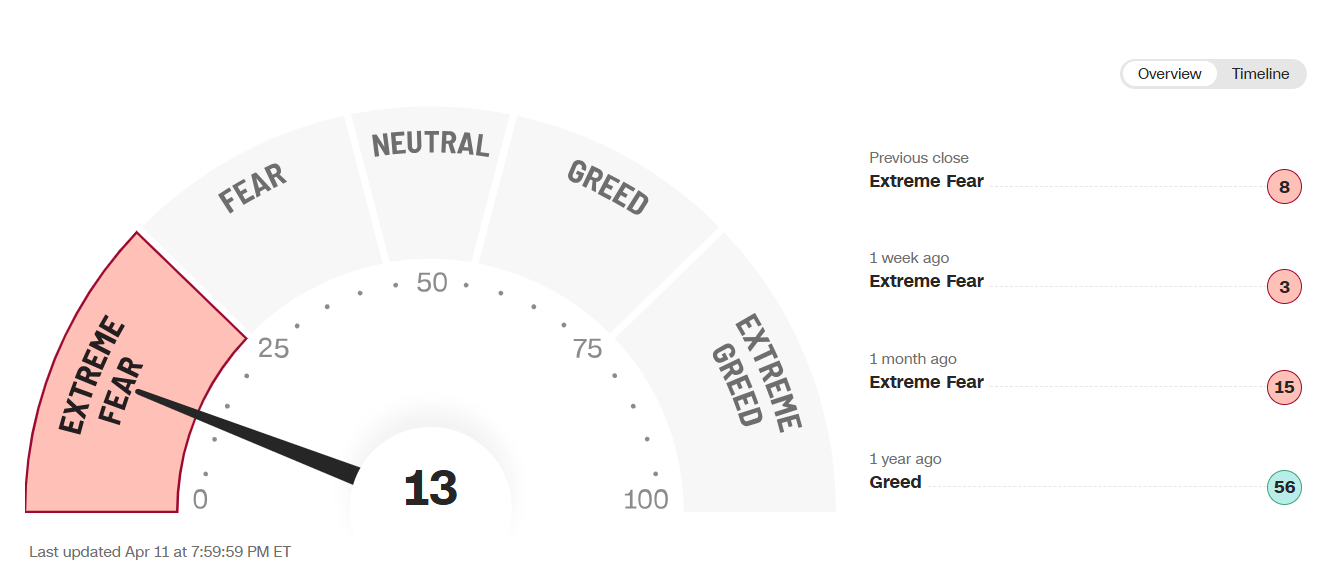
This may suggest that market participants are cautiously optimistic that the sweeping tariff measures might be eased through exemptions, delays, or negotiation concessions. Nevertheless, the CNN Business Fear & Greed Index remains in "extreme fear" territory, despite inching higher compared to last week.
As of this morning, the Nasdaq 100 (US Tech 100 mini on FXOpen) has recovered approximately 15% from its 2025 low.
Technical Analysis: Nasdaq 100 (US Tech 100 mini on FXOpen)
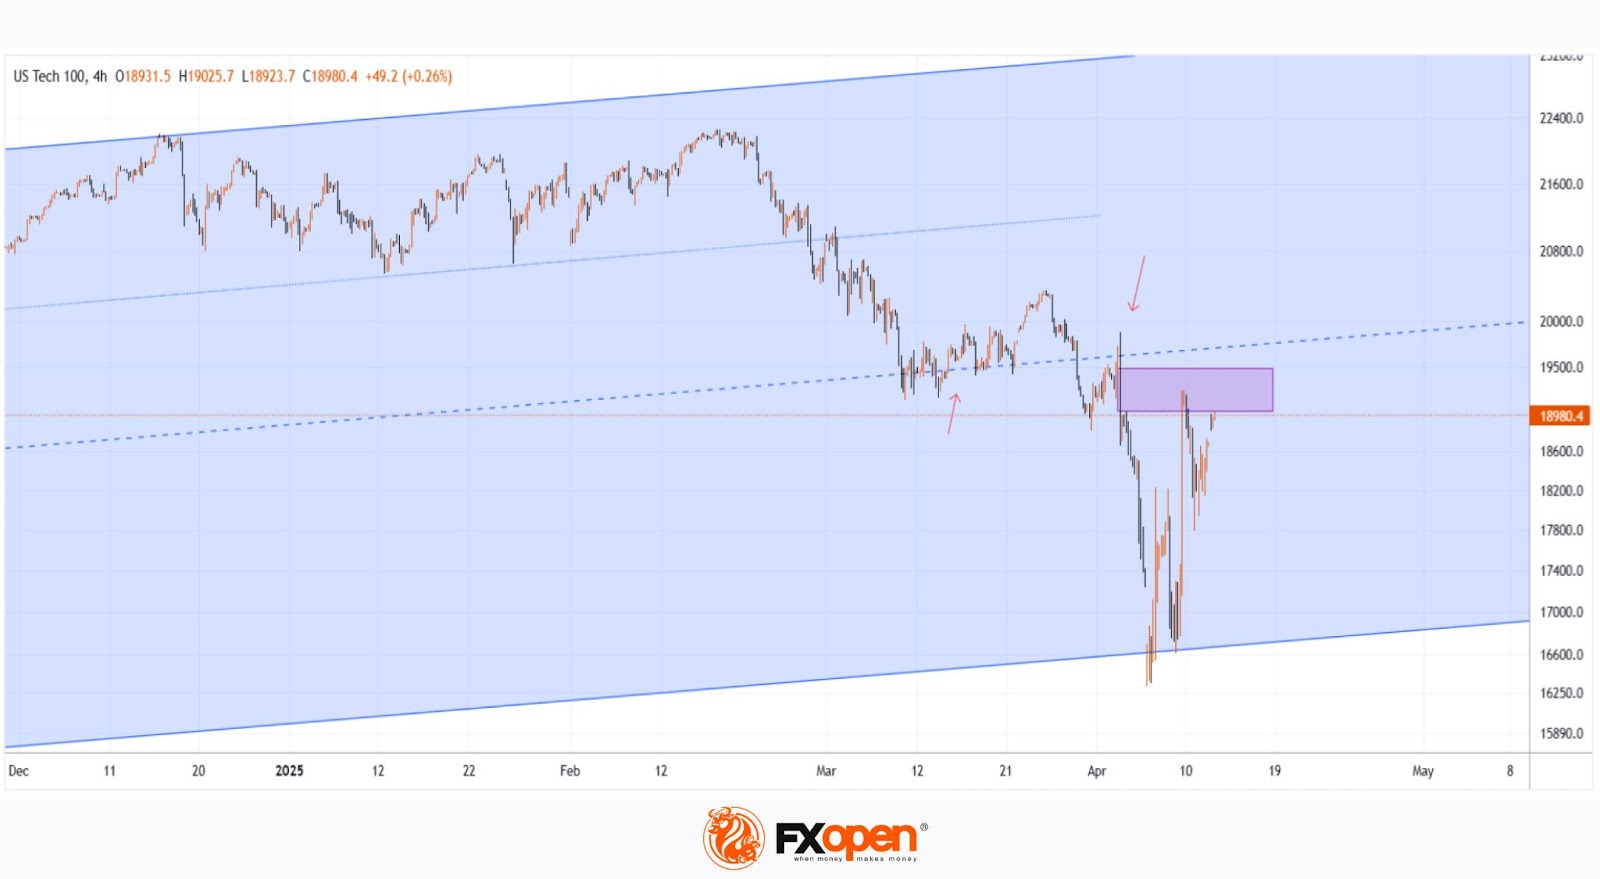
Seven days ago, we plotted an ascending blue channel and suggested that its lower boundary could act as support – which has indeed played out.
With the latest data in hand, there is reason to believe that bulls may now be aiming to push the price up toward the channel’s median line. However, as indicated by the arrows on the chart, this median appears to have shifted from acting as support to acting as resistance.
Bulls may also face headwinds from the wide bearish candle to the left, which was formed in reaction to Trump's tariff announcements. According to Smart Money Concept methodology, this area – marked by a bearish Fair Value Gap (highlighted with a rectangle) – may now serve as resistance.
Trade global index CFDs with zero commission and tight spreads. Open your FXOpen account now or learn more about trading index CFDs with FXOpen.
This article represents the opinion of the Companies operating under the FXOpen brand only. It is not to be construed as an offer, solicitation, or recommendation with respect to products and services provided by the Companies operating under the FXOpen brand, nor is it to be considered financial advice.
Trade Complicates Japan’s Delicate Dance Toward Rate Normalisation
Above-target inflation and relatively robust activity growth have allowed the Bank of Japan to slowly step away from the zero lower bound. But Japan now faces the challenge of negotiating a trade agreement with the US while trying to support the confidence that has been key to this success.
The world has shifted monumentally since the Bank of Japan’s last meeting. Above-target inflation and relatively robust activity growth has allowed the Bank to slowly step away from the zero lower bound. But Japanese authorities are now faced with the challenge of negotiating a trade agreement with the US while supporting the confidence that has been so critical to their success with inflation and growth. Success will be critical if the policy rate is to reach the 1.0% ‘neutral’ terminal rate as hoped.
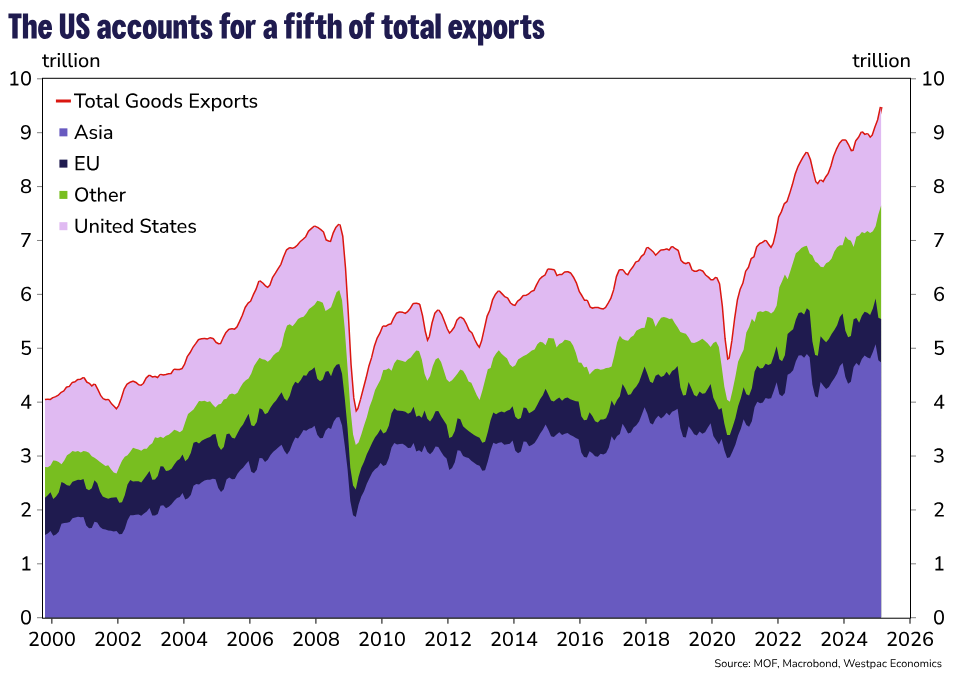
In considering what is at stake for the Japanese economy, it is worth contextualising the US-Japan trade relationship and its links to the domestic economy. Just over 20% of Japan’s goods exports go to the US, over 70% of which is machinery and transport equipment, an industry that accounts for 15% of GDP. The OECD estimates that the value added in exports to the US equate to 2% of Japan’s GDP.
The US ‘reciprocal’ tariffs included a 24% tariff on Japanese goods. The 90-day pause has set that back to 10% with the whole tariff reportedly up for negotiation. Any Japanese deal is likely to see some of its manufacturing relocated to the US in exchange for softer tariffs.
At present, many Japanese companies have factories across Asia to capitalise on cheaper labour. We have previously argued this poses structural downward pressure on the yen as earnings from these subsidiaries are often reinvested back into offshore operations instead of being repatriated. Increased investment by Japan into US auto manufacturing is likely to be a key part of the expected agreement.
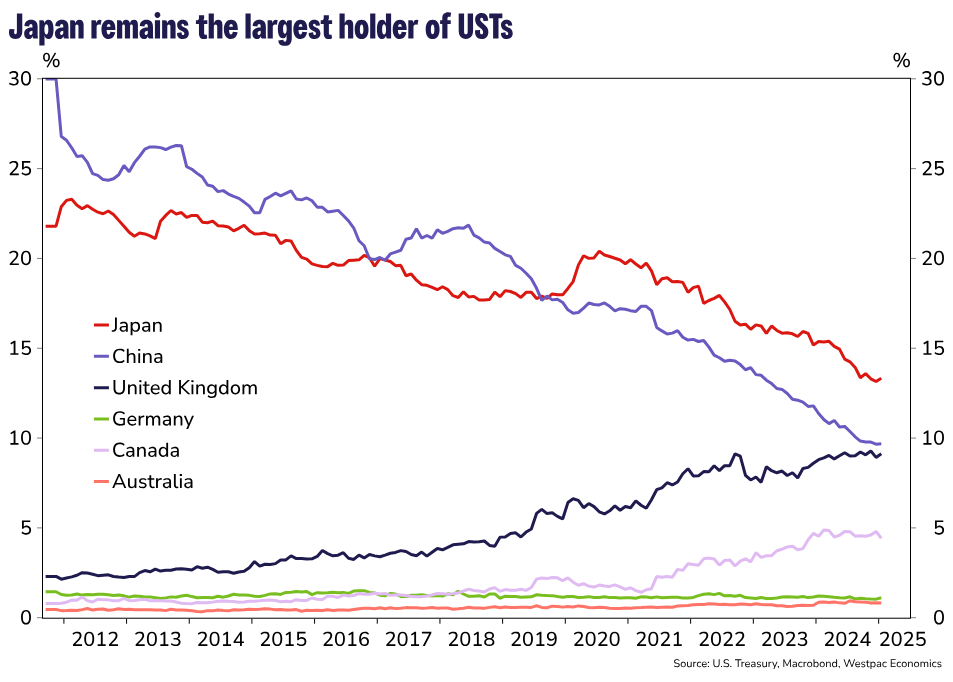
Japan comes to the negotiating table with its own strengths. Japan is the second largest holder of long-term US securities. US holdings of Japanese securities are about half that of Japanese holdings of US securities. Japan is also currently the largest single-country holder of US Treasuries according to US Treasury International Capital data. Looking ahead, the US will need buyers for its Treasuries as deficits persist and if, as Westpac Head of Financial Markets Strategy Martin Whetton noted, US government bonds erode their status as a safe haven, this task will become increasingly difficult. Japan’s status as an ‘investor to the developed world’ will likely hold significant weight in these negotiations, even if a pledge to continue investing in Treasuries is not explicitly made.
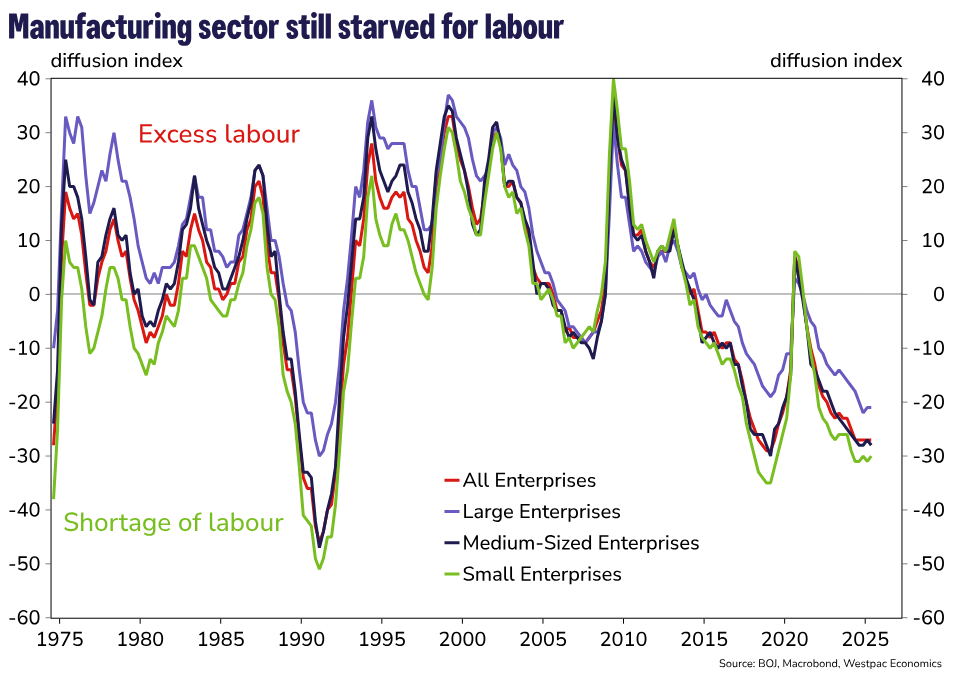
The manufacturing sector has been a bedrock of the Japanese economy for decades. Looking ahead, with a declining population, it is difficult to see output in the economy expanding on the back of services alone, which tends to be quite labour intensive with moderate-to-low marginal returns on capital. Investment into efficient manufacturing and strength in exports will be a key support of economic growth for years to come and is required for a neutral monetary policy rate meaningfully above the zero-lower bound to be sustained. While the fruits of productive expansion may seem like a thought for the distant future, the investment needed to yield those outcomes is required now.
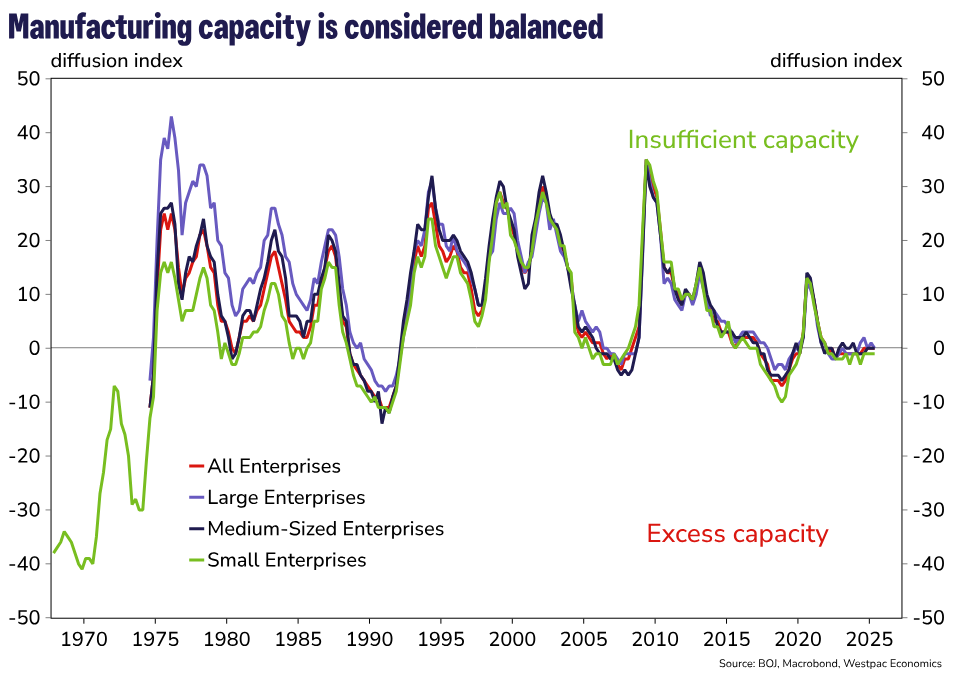
Crucially, it is confidence amongst Japanese businesses that will help the nation realise its economic potential. The latest Tankan results, which were collected prior to recent trade developments, showed manufacturing firms expect a relatively higher degree of labour shortages versus history and a net neutral assessment of productive capacity in the future. That is, there is no expectation for excess capacity across the manufacturing sector.
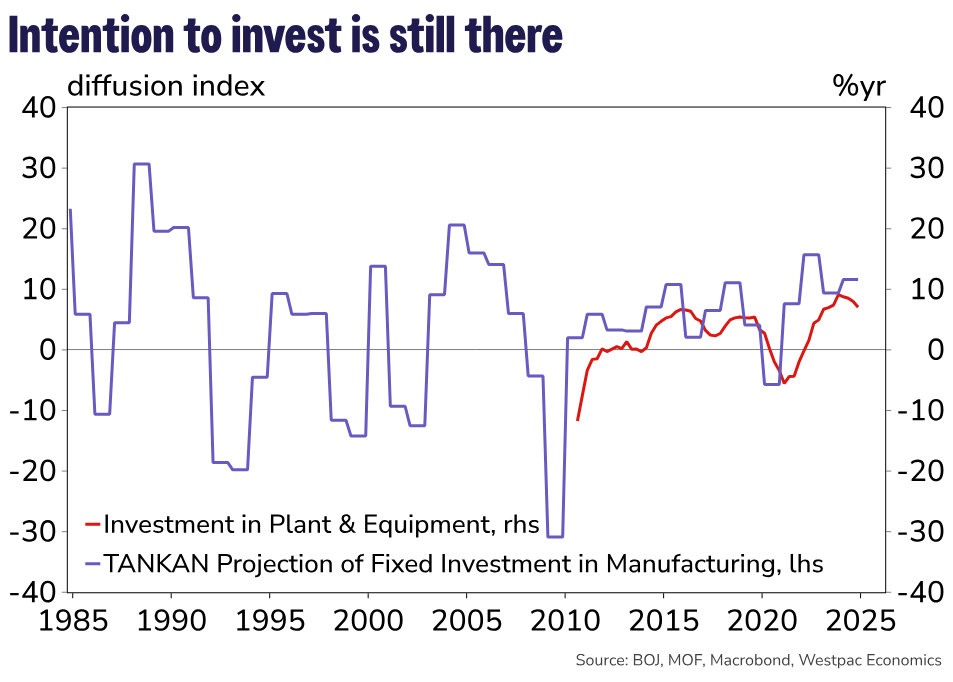
Sentiment around investment, as reported in the annual survey in December, was near the pre-Asian financial crisis peak. Japanese businesses have also walked the walk – investment in plant and equipment has not been this high on a sustained basis since data collection began in 2010. The appetite for investment has certainly been there but it may have been lost in the chaos of the US tariff shock.
Maintaining business confidence through successful trade negotiation with the US will be crucial in determining how the path for policy evolves. Despite the enormity of the challenge, we anticipate Japan’s strong position as an exporter of manufactured goods and net lender to the world will help secure favourable terms for Japan-US trade with limited concessions.
Our baseline view is that tariffs on Japanese goods remain capped at 10%, explicitly or implicitly in exchange for continued purchases of US Treasuries and further investment and collaboration between Japan and the US in the auto industry.
We now anticipate that the Bank of Japan will raise rates once more in 2025 at the July meeting and again in March 2026 to a 1.0% terminal rate. By July, there should be greater clarity on trade policy in the US as well as Japanese domestic policy as it relates to the House of Councillors elections. From there, the outlook is predicated on how businesses adapt to a new world of tariffs and whether this hampers their ability to raise wages for FY2026. Another strong wage print will help justify the case for a final hike in 2026.
GBP/JPY Daily Outlook
Daily Pivots: (S1) 186.52; (P) 187.36; (R1) 188.71; More...
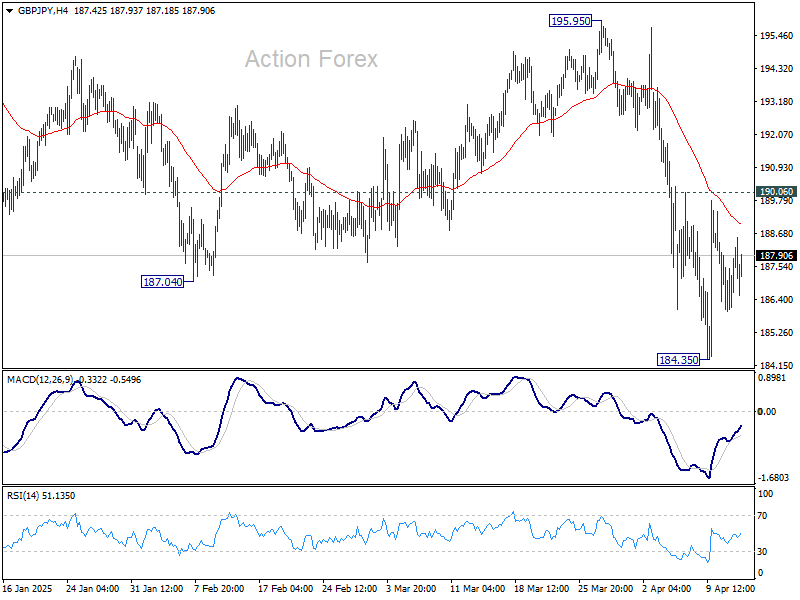
GBP/JPY is staying in consolidations above 184.35 and intraday bias remains neutral for now. Risk will stay on the downside as long as 190.06 resistance holds. Below 184.35 will target 180.00 low. Nevertheless, break of 190.06 will turn bias back to the upside for stronger rebound.
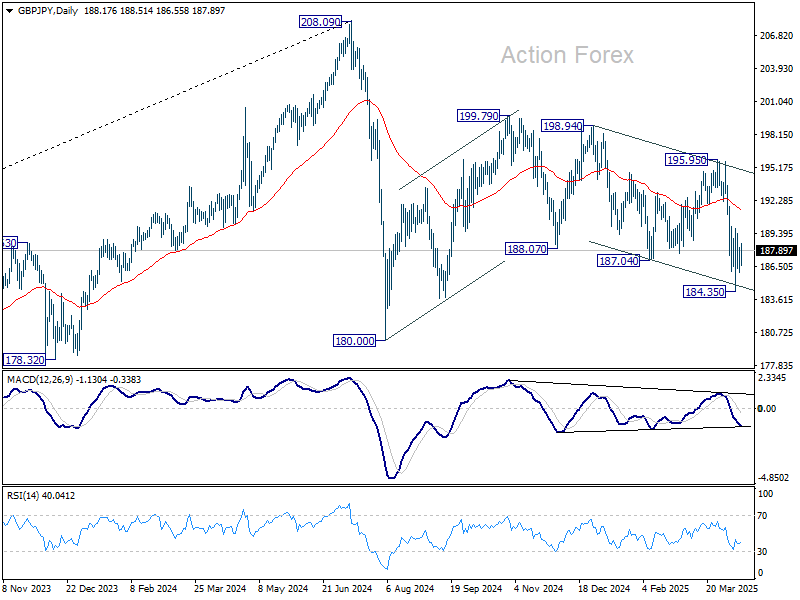
In the bigger picture, price actions from 208.09 are seen as a correction to rally from 123.94 (2020 low). Strong support should be seen from 38.2% retracement of 123.94 to 208.09 at 175.94 to contain downside. However, sustained break of 175.94 will bring deeper fall even still as a correction.
EUR/JPY Daily Outlook
Daily Pivots: (S1) 161.88; (P) 162.51; (R1) 163.72; More...
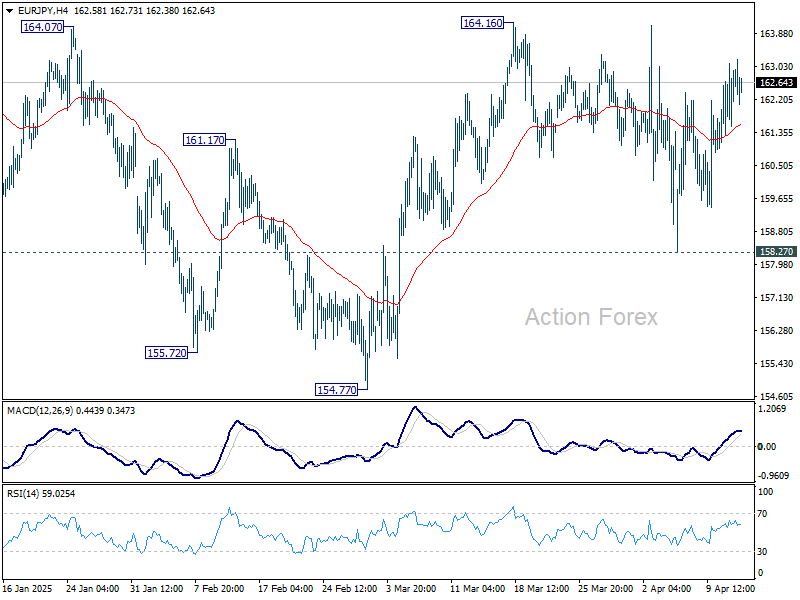
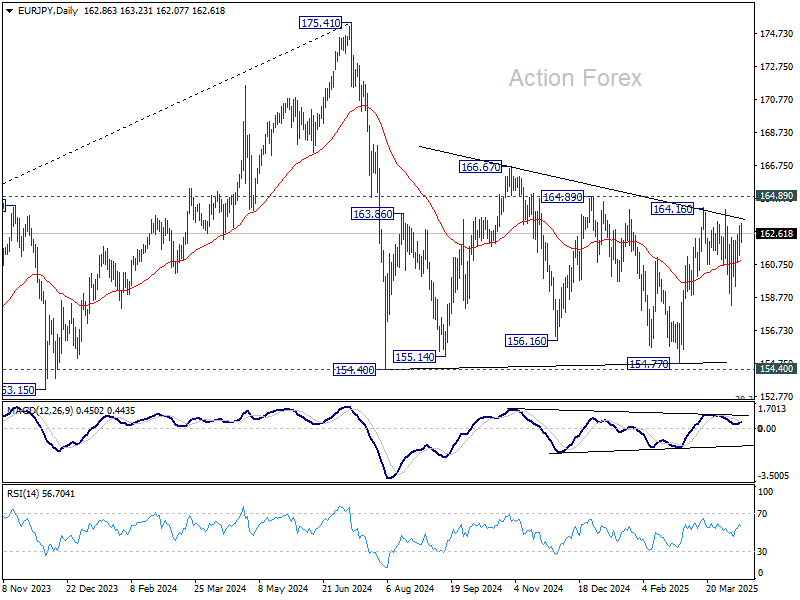
Range trading continues in EUR/JPY and intraday bias remains neutral for the moment. On the upside, above 164.16 will resume the rally from 154.77 to 164.89 resistance, and then 166.67. However, decisive break of 158.27 support will bring deeper decline back to 154.77 support. Overall, sideway consolidation pattern from 154.40 is still extending.
In the bigger picture, price actions from 175.41 are seen as correction to rally from 114.42 (2020 low). Strong support should be seen from 38.2% retracement of 114.42 to 175.41 at 152.11 to contain downside. However, sustained break of 152.11 will bring deeper fall even still as a correction.
EUR/GBP Daily Outlook
Daily Pivots: (S1) 0.8625; (P) 0.8681; (R1) 0.8737; More...
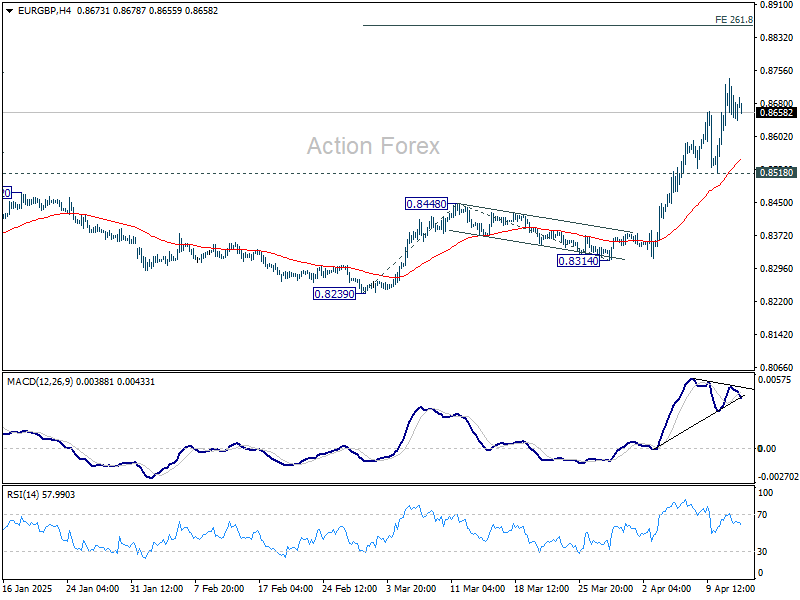
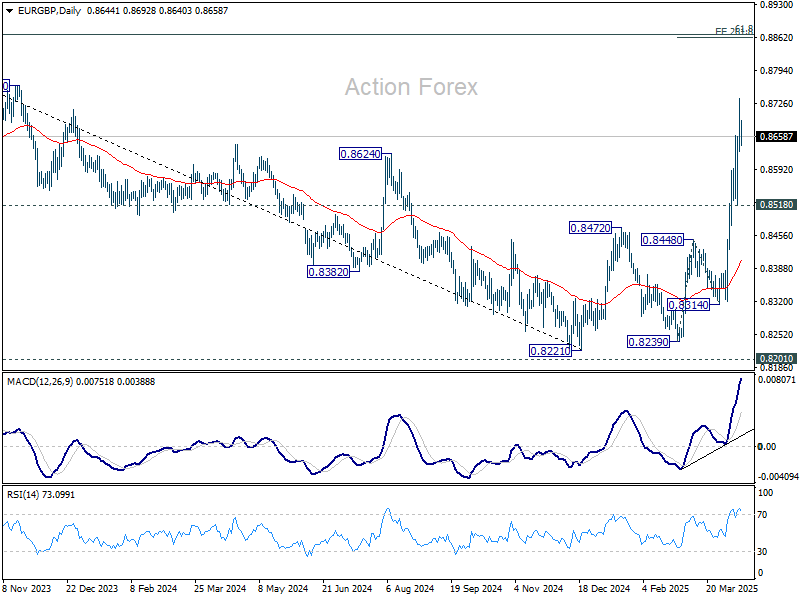
While upside momentum is diminishing slightly as seen in 4H MACD, further rally is still expected as long as 0.8518 support holds. Current rise from 0.8221 should target 261.8% projection of 0.8239 to 0.8448 from 0.8314 at 0.8861. On the downside, break of 0.8518 support is needed to indicate short term topping. Otherwise, outlook will stay bullish in case of retreat.
In the bigger picture, down trend from 0.9267 (2022 high) should have completed at 0.8221, just ahead of 0.9201 key support (2024 low). Rise from 0.8221 is likely reversing the whole fall. Further rise should be seen to 61.8% retracement of 0.9267 to 0.8221 at 0.8867 next. This will now remain the favored case as long as 0.8472 resistance turned support holds.
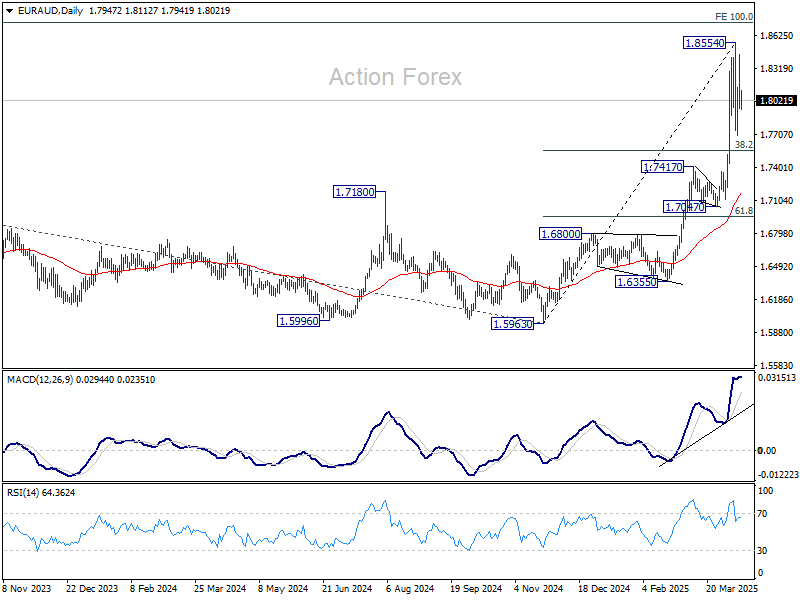
EUR/AUD Daily Outlook
Daily Pivots: (S1) 1.7851; (P) 1.8151; (R1) 1.8350; More...
Intraday bias in EUR/AUD stays neutral as consolidation continues below 1.8554 short term top. In case of another dip, downside should be contained by 38.2% retracement of 1.5963 to 1.8854 at 1.7750. On the upside, firm break of 1.8554 will resume larger up trend.
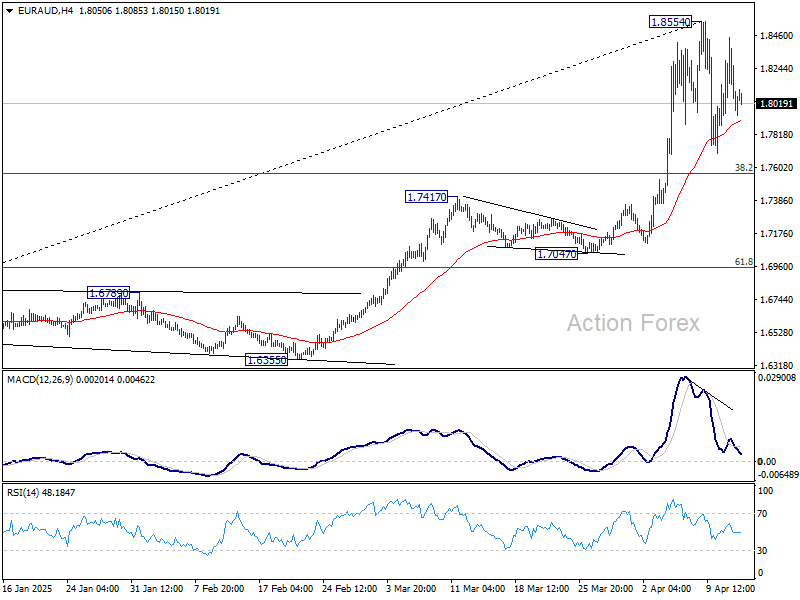
In the bigger picture, up trend from 1.4281 (2022 low) is in progress, and in reacceleration phase as seen in W MACD. Next target is 100% projection of 1.4281 to 1.7062 from 1.5963 at 1.8744. Firm break there will pave the way to 138.2% projection at 1.9806, which is close to 1.9799 (2020 high). Outlook will remain bullish as long as 1.7417 resistance turned support holds even in case of deep pullback.
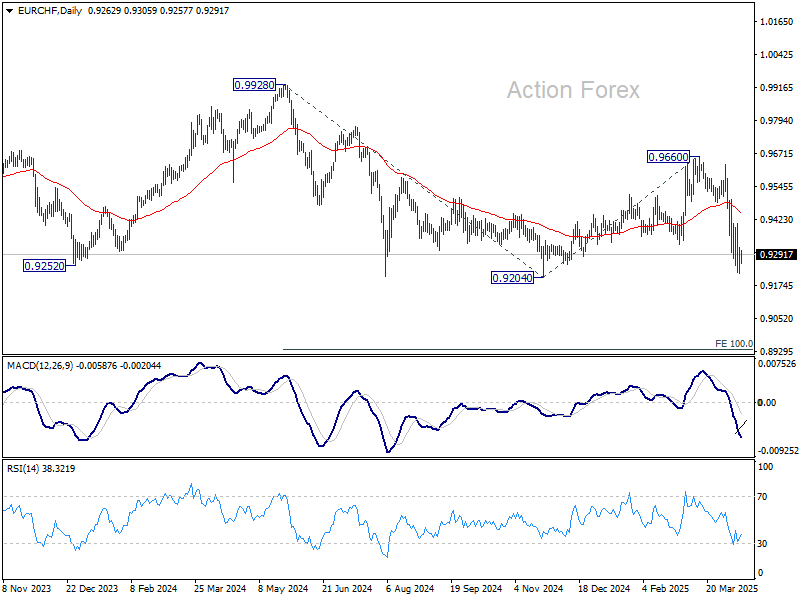
EUR/CHF Daily Outlook
Daily Pivots: (S1) 0.9216; (P) 0.9268; (R1) 0.9316; More....
While downside momentum is diminishing slightly as seen in 4H MACD, further decline is still expected in EUR/CHF with 0.9408 resistance intact. Retest of 0.9204 low should be seen next Firm break there will resume larger down trend.
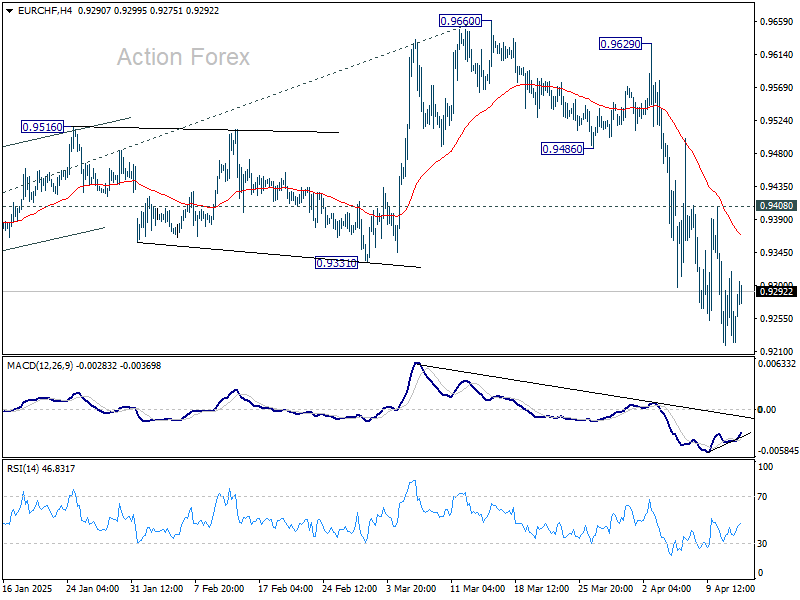
In the bigger picture, rejection by long-term falling channel resistance (now at 0.9600) retains medium term bearishness. That is, down trend from 1.2004 (2018 high) is still in progress. Firm break of 0.9204 (2024 low) will confirm resumption. Next target is 100% projection of 0.9928 to 0.9204 from 0.9660 at 0.8936.
BTC/USD Analysis: Bitcoin Price Faces Key Resistance
In our previous analysis of Bitcoin’s price (dated 4 April), we:
→ outlined a long-term ascending channel (marked by blue lines);
→ noted signs suggesting a potential bearish breakout below the channel’s lower boundary.
Since then, bears indeed managed to push the price (as shown by the arrow) below the channel's lower line – driven by a broader sell-off in risk assets amid mounting concerns over a global recession, fuelled by trade wars and the introduction of international tariffs.
But what does the BTC/USD chart tell us today?
Technical Analysis of BTC/USD Today
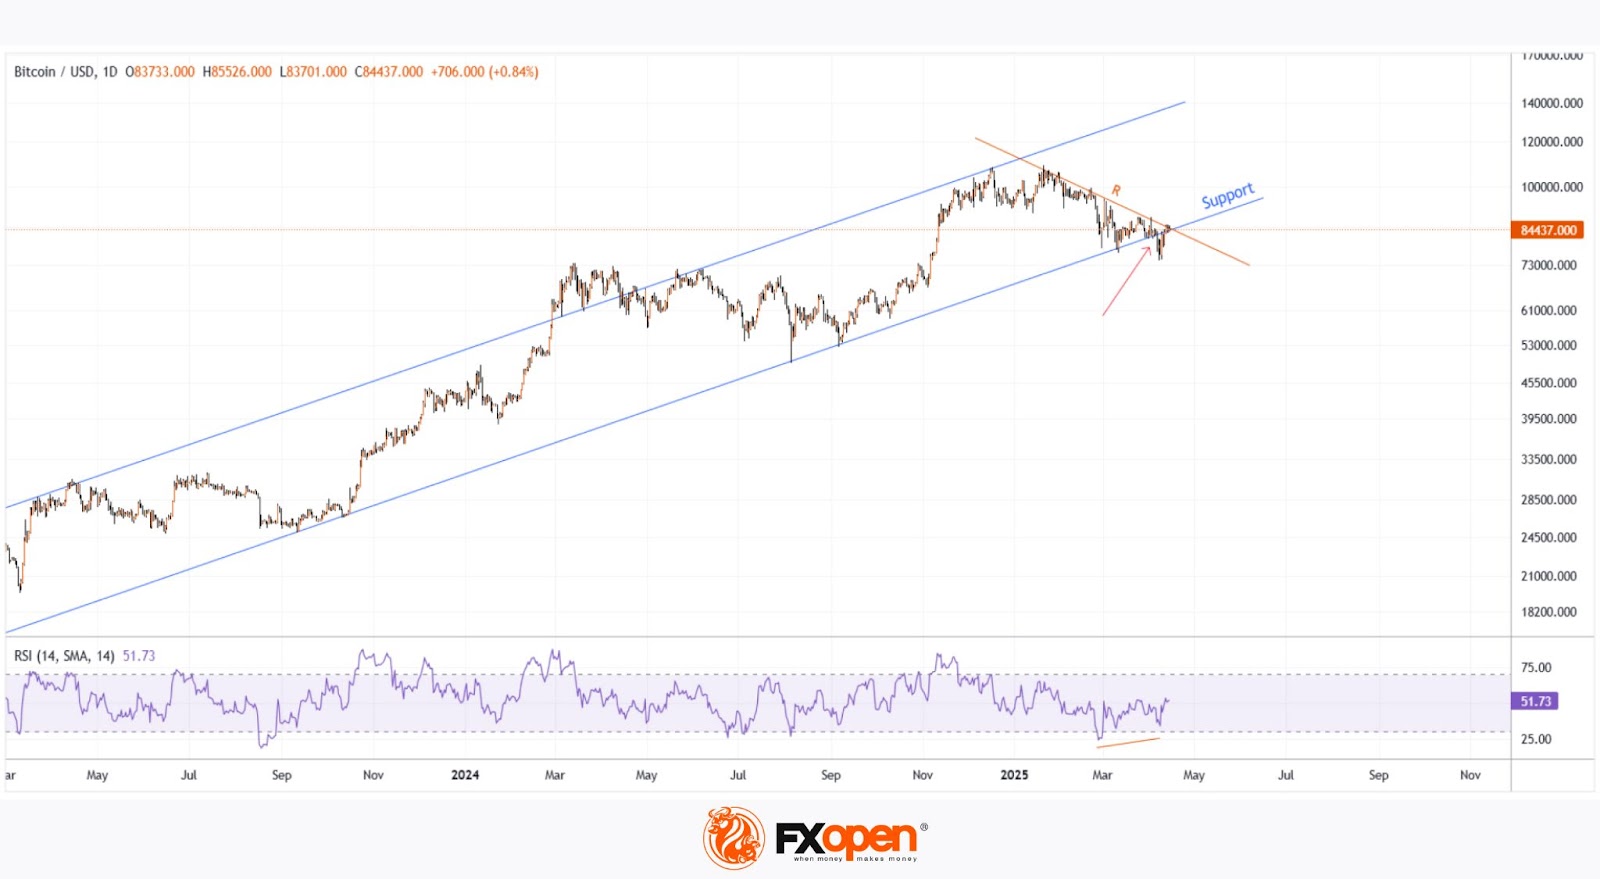
Bears have so far failed to capitalise on the break below support.
Currently, Bitcoin’s price is trading above the former breakout level, which may suggest that bulls are regaining control. If the previous bearish breakout was indeed false, this raises the possibility of a genuine breakout above resistance (marked by line R). This scenario would pave the way for a continuation of the long-term uptrend on the BTC/USD chart and reinforce the relevance of the ascending channel – as highlighted by a divergence on the RSI indicator.
Will the bullish scenario play out? Much will depend on the underlying fundamentals. It’s worth noting that the ongoing crisis in the US bond market (linked to Trump’s tariff policies) could create a favourable backdrop for further bullish momentum. Or, in the words of BitMEX co-founder Arthur Hayes in a post on X, it may signal the start of “only up” mode for Bitcoin’s price.
FXOpen offers the world's most popular cryptocurrency CFDs*, including Bitcoin and Ethereum. Floating spreads, 1:2 leverage — at your service. Open your trading account now or learn more about crypto CFD trading with FXOpen.
*Important: At FXOpen UK, Cryptocurrency trading via CFDs is only available to our Professional clients. They are not available for trading by Retail clients. To find out more information about how this may affect you, please get in touch with our team.
This article represents the opinion of the Companies operating under the FXOpen brand only. It is not to be construed as an offer, solicitation, or recommendation with respect to products and services provided by the Companies operating under the FXOpen brand, nor is it to be considered financial advice.
AUD/USD & NZD/USD Gain Pace, Bulls Are Back?
AUD/USD started a decent increase above the 0.6150 and 0.6200 levels. NZD/USD is also rising and might aim for more gains above 0.5850.
Important Takeaways for AUD USD and NZD USD Analysis Today
- The Aussie Dollar rebounded after forming a base above the 0.6000 level against the US Dollar.
- There is a connecting bullish trend line forming with support at 0.6260 on the hourly chart of AUD/USD at FXOpen.
- NZD/USD is consolidating gains above the 0.5765 zone.
- There is a key bullish trend line forming with support at 0.5825 on the hourly chart of NZD/USD at FXOpen.
AUD/USD Technical Analysis
On the hourly chart of AUD/USD at FXOpen, the pair started a fresh increase from the 0.5940 support. The Aussie Dollar was able to clear the 0.6065 resistance to move into a positive zone against the US Dollar.
There was a close above the 0.6200 resistance and the 50-hour simple moving average. Finally, the pair tested the 0.6315 zone. A high was formed near 0.6314 and the pair recently started a consolidation phase.
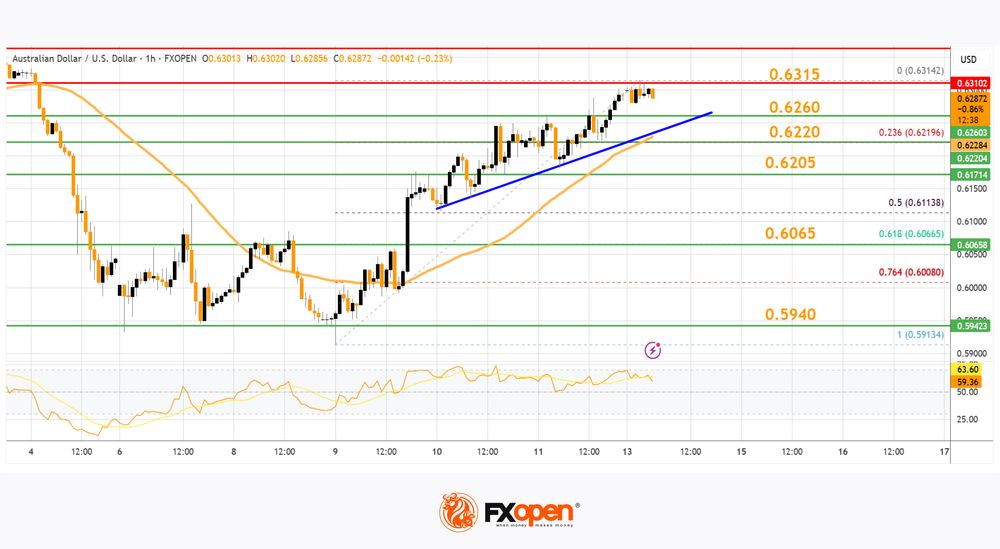
There was a move below the 0.6300 level. The pair remained above the 23.6% Fib retracement level of the upward move from the 0.5913 swing low to the 0.6314 high.
On the downside, initial support is near the 0.6260 level. There is also a connecting bullish trend line forming with support at 0.6260. The next major support is near the 0.6220 zone. If there is a downside break below the 0.6220 support, the pair could extend its decline toward the 0.6205 level.
Any more losses might signal a move toward 0.6065 and the 61.8% Fib retracement level of the upward move from the 0.5913 swing low to the 0.6314 high.
On the upside, the AUD/USD chart indicates that the pair is now facing resistance near 0.6315. The first major resistance might be 0.6340. An upside break above the 0.6340 resistance might send the pair further higher.
The next major resistance is near the 0.6385 level. Any more gains could clear the path for a move toward the 0.6450 resistance zone.
NZD/USD Technical Analysis
On the hourly chart of NZD/USD on FXOpen, the pair started a steady increase from the 0.5515 zone. The New Zealand Dollar broke the 0.5670 resistance to start the recent increase against the US Dollar.
The pair settled above 0.5765 and the 50-hour simple moving average. It tested the 0.5850 zone and is currently consolidating gains. The pair corrected lower below the 0.5840 level. However, the bulls are active above the 0.5825 level.
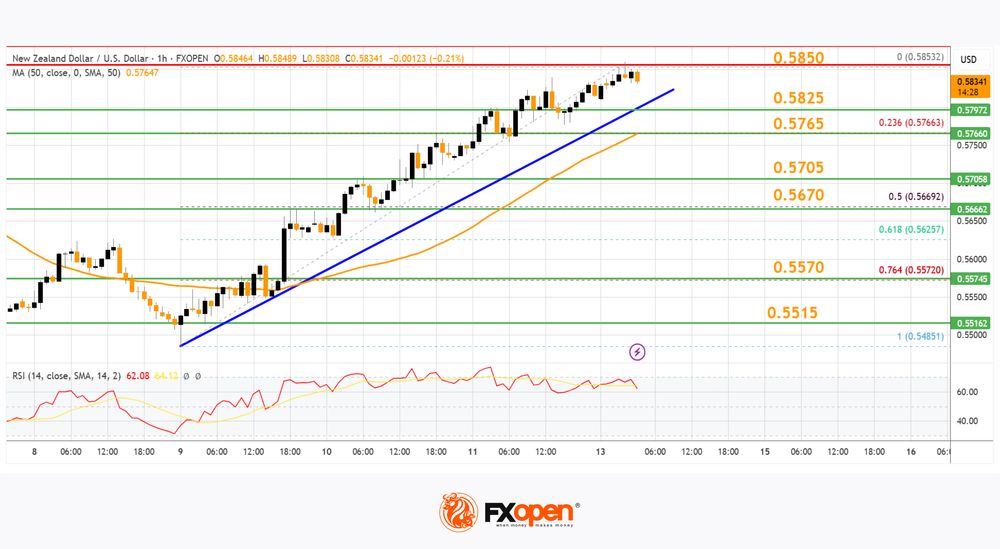
The NZD/USD chart suggests that the RSI is stable above 50. On the upside, the pair might struggle near 0.5850. The next major resistance is near the 0.5880 level.
A clear move above the 0.5880 level might even push the pair toward the 0.5920 level. Any more gains might clear the path for a move toward the 0.6000 resistance zone in the coming days.
On the downside, immediate support is near the 0.5825 level. There is also a key bullish trend line forming with support at 0.5825. The first key support is near the 0.5765 level. The next major support is near the 0.5670 level and the 50% Fib retracement level of the upward move from the 0.5485 swing low to the 0.5853 high.
If there is a downside break below the 0.5670 support, the pair might slide toward the 0.5570 support. Any more losses could lead NZD/USD in a bearish zone to 0.5515.
Trade over 50 forex markets 24 hours a day with FXOpen. Take advantage of low commissions, deep liquidity, and spreads from 0.0 pips. Open your FXOpen account now or learn more about trading forex with FXOpen.
This article represents the opinion of the Companies operating under the FXOpen brand only. It is not to be construed as an offer, solicitation, or recommendation with respect to products and services provided by the Companies operating under the FXOpen brand, nor is it to be considered financial advice.