
Sample Category Title
Australian Inflation Expectations Jump, Aussie Gains Ground
- The Australian dollar has extended its gains on Thursday.
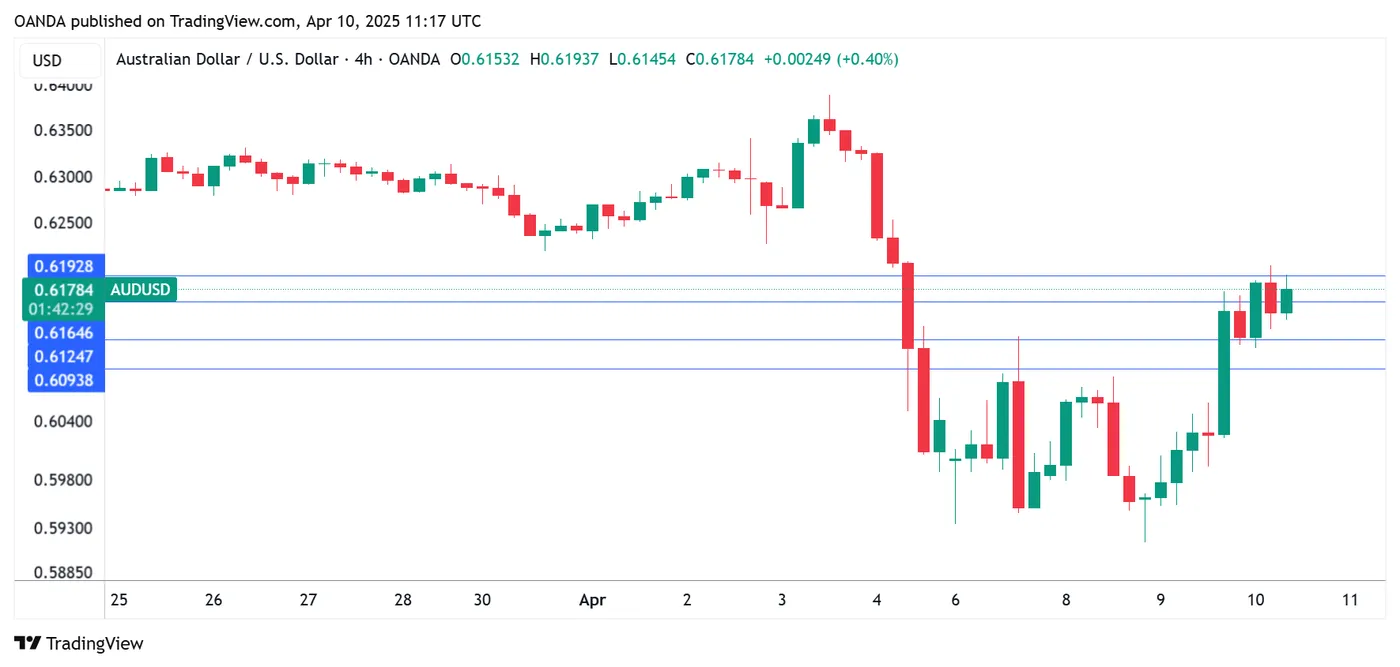
- AUD/USD is trading at 0.6172 in the European session, up 0.39% on the day.
Australian dollar on a wild ride
The Australian dollar continues to take market participants on a wild roller-coaster ride. AUD/USD soared 3.2% on Wednesday, recovering from a three-day slide in which the Aussie plunged 6%. The sharp swings are a direct result of the massive moves in the global equity markets.
The week started with sharp losses in equities in response to the latest round of US tariffs. This triggered flows away from risk currencies like the Australian dollar to safer assets, such as the Japanese yen. The equity markets completely reversed directions and soared on Wednesday after Trump dropped tariffs to a universal 10% on all countries except China, and the Australian dollar surged higher.
Australian inflation expectations jumps to 4.2%
Australian consumer inflation expectations climbed to 4.2% in April, up from 3.6% in March and above the forecast of 3.6%.
The sharp gain reflects the concern that the latest escalation in trade tensions could boost Australia's inflation rate. The Reserve Bank of Australia has only lowered rates once after holding rates for over a year but may have to accelerate its easing due to the tariff turmoil.
China's CPI decline for second consecutive month
China's consumer prices declined for a second successive month as domestic consumption has weakened. CPI dropped by 0.1% y/y in March after a sharp 0.7% decline in February, below the market estimate of 0.1%. Monthly, CPI declined by 0.4%, down from -0.2% in February and below the market estimate of -0.2%.
Producer Price inflation also eased as China could face more unsold exports due to the trade war with the US. A decrease in domestic demand in China could translate into less demand for Australian exports.
AUD/USD Technical
- AUD/USD pushed above resistance at 0.6164 and tested 0.6193 earlier
- 0.6125 and 0.6094 are providing support
RBA’s Bullock: Too early to call rate path amid tariff-driven uncertainty
RBA Governor Michele Bullock stated today that it is “too early” to judge how escalating global trade war will shape the path of Australian interest rates. "it’s too early for us to determine what the path will be for interest rates," she added.
Bullock noted that “a period of uncertainty and adjustment” is inevitable as countries react to Washington’s trade moves. RBA plans to stay patient while assessing how these global shocks might affect both supply and demand dynamics. “It will take some time to see how all of this plays out,” she said.
Nasdaq 100 Technical Outlook: 12% Monster Rally May be a Bull Trap
- Market breadth measured by the percentage of Nasdaq 100 component stocks above their 20-day and 50-day moving averages remains lacklustre.
- An elevated widening trend of US high-yield corporate bonds credit spread may trigger another jump in the implied volatility of the Nasdaq 100.
- Key intermediate resistance stands at 19,290 on the Nasdaq 100.
This is a follow-up analysis of our prior analysis “Nasdaq 100 Technical Outlook: Bearish move materialised; how low can it go?” dated 1 April 2025.
Since our last publication, the Nasdaq 100 CFD Index (a proxy for the Nasdaq 100 E-mini futures) has tumbled 16%, breaking below the 17,300/17,250 medium-term support zone highlighted in our report. It went on to test the major support level at 16,590, printing an intraday low of 16,335 on 7 April before recovering to close higher at 17,508 by the end of the U.S. trading session.
In a dramatic move on Wednesday, April 8, U.S. President Trump announced a 90-day suspension of the increased reciprocal tariff rates for countries that choose not to retaliate, excluding China from this exemption.
Tensions between the U.S. and China remained high, as the White House imposed additional tariffs on Chinese goods, raising the tariff rate to 125% in response to Beijing's retaliatory measures of imposing 84% duties on all US imports.
The U.S. stock market skyrocketed, posting significant gains across major indices. Mega-cap-focused benchmarks, the S&P 500 and Nasdaq 100, surged by 9.5% and 12%, respectively. The Dow Jones Industrial Average and the small-cap Russell 2000 also rallied, climbing 7.9% and 8.7%, respectively, as investor optimism fuelled a broad-based market upswing.
Yesterday's massive rally in the Nasdaq 100 marked its largest single-day gain since 2001, and the second biggest on record, trailing only the 19% surge recorded on 3 January 2001.
The key question on most traders' minds now is whether yesterday’s stellar performance signals the start of a medium-term bullish reversal in the Nasdaq 100, or if it’s merely a corrective rebound, commonly referred to as a “dead cat bounce.”
Market breadth indicators remain weak
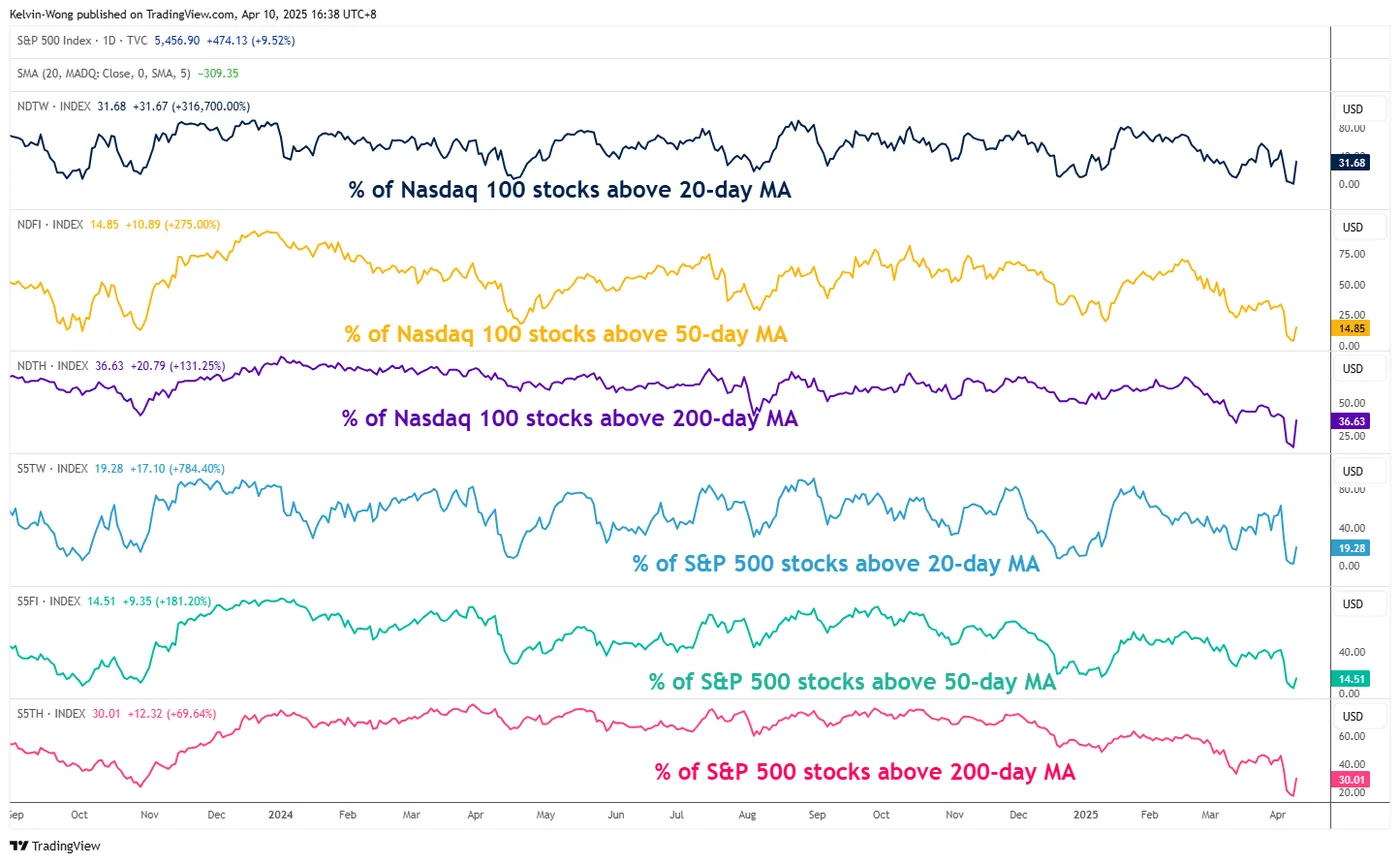
Fig 1: Percentage of Nasdaq 100 & 500 component stocks above key moving averages as of 9 Apr 2025 (Source: TradingView)
As of Wednesday, April 9, only 32% and 15% of Nasdaq 100 component stocks were trading above their respective 20-day and 50-day moving averages—both remaining below the 50% threshold (see Fig 1).
This lacklustre market breadth suggests that the Nasdaq 100’s impressive single-day rally may not necessarily signal the start of a medium-term bullish reversal.
Implied volatility may see a jump again
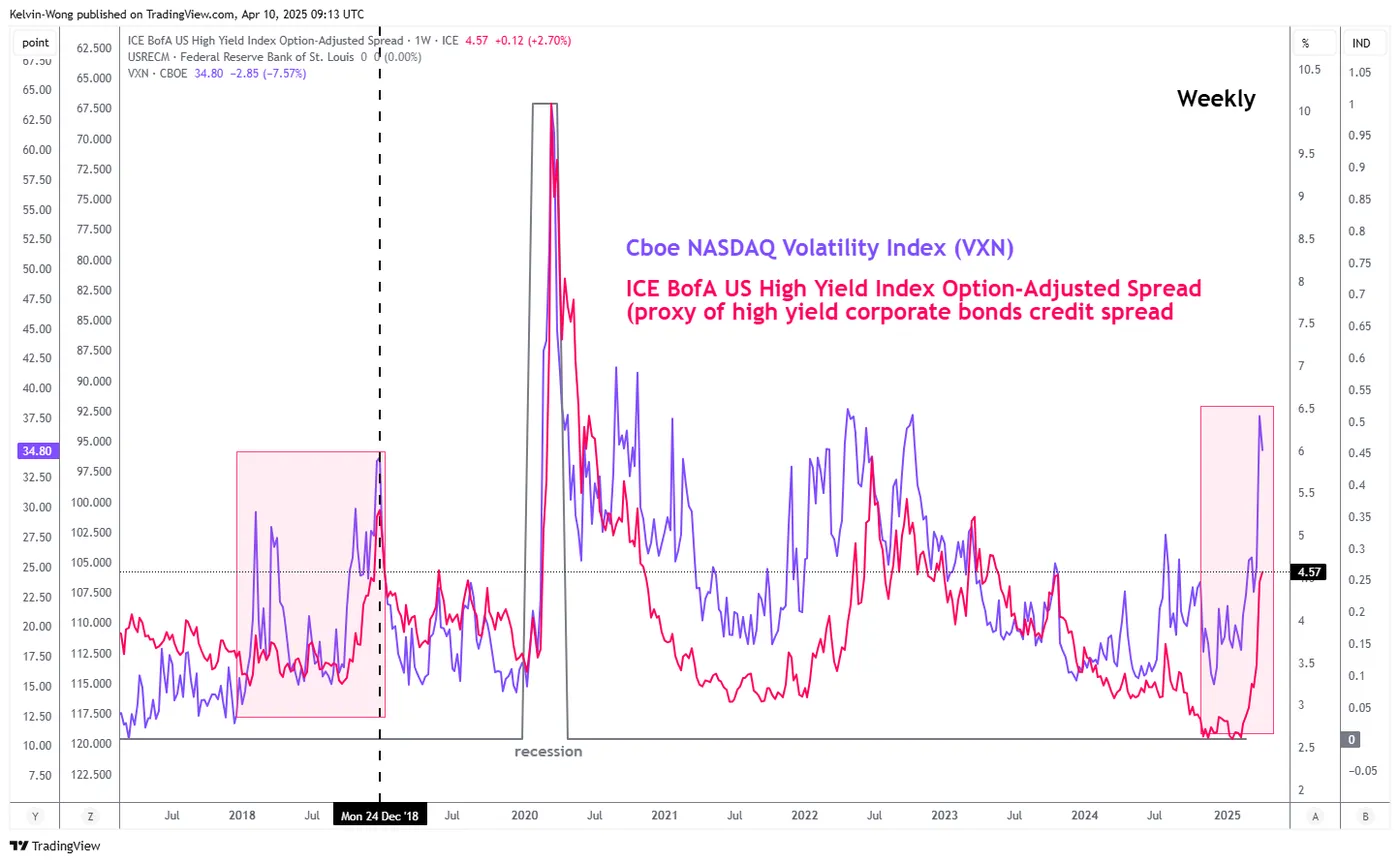
Fig 2: ICE BofA US High Yield Index Option-Adjusted Spread with VXN as of 9 Apr 2025 (Source: TradingView)
20-day moving average is acting as an immediate ceiling at 19,290
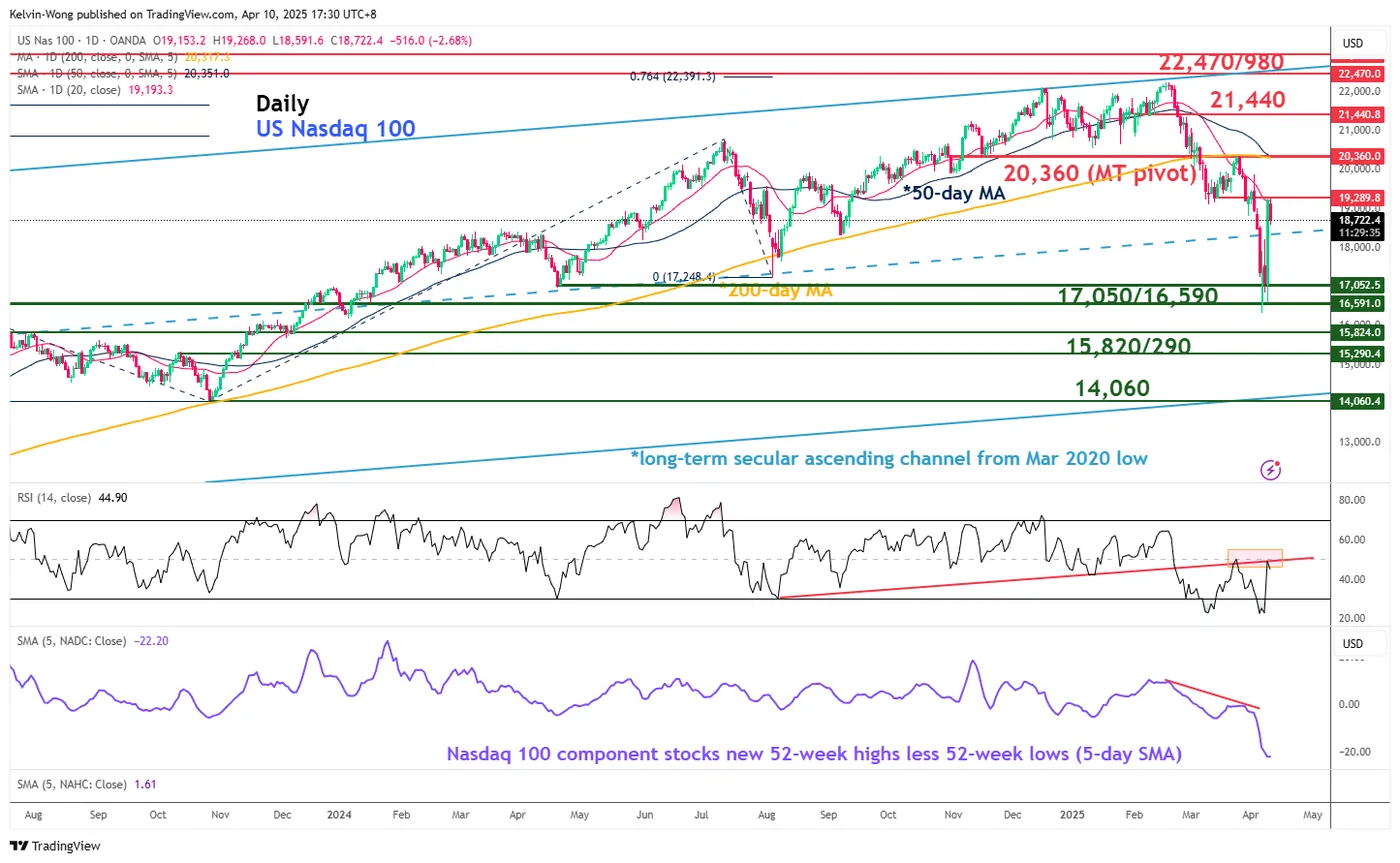
Fig 3: Nasdaq 100 CFD major & medium-term trends as of 10 Apr 2025 (Source: TradingView)
After yesterday’s steep rally on the Nasdaq 100 CFD Index has started to stall the bullish tone at its 20-day moving average, acting as a key intermediate resistance at 19,290, where an intraday bearish reaction of -2.8% has materialised at this time of writing (see Fig 3).
In addition, the daily RSI momentum indicator has also failed to break above a parallel resistance at the 50 level after it exited from an extreme oversold condition yesterday.
These observations suggest that yesterday’s 12% rebound on the Nasdaq 100 CFD Index may be a bull trap, and the medium-term downtrend phase is still intact.
A break with a daily close below 16,590 may trigger a fresh impulsive down move to expose the next medium-term supports at 15,820/15,290, and 14,060.
On the other hand, a clearance above 20,360 key medium-term pivotal resistance (also the intersection of the 50-day and 200-day moving averages) invalidates the bearish scenario for the next medium-term resistances to come in at 21,440, and 22,470/22,980 next.
Gold (XAU/USD) Price Update: Bulls in Charge as Trump Hits Tariff Pause. $3150/oz Up Next?
- Gold prices have risen beyond $3100/oz due to ongoing US-China trade tensions.
- FOMC minutes indicate potential challenges for the Fed with inflation and slower growth.
- Market rate cut expectations are fluctuating due to tariff news.
- Technical analysis shows key support levels for Gold at 3100, 3087, and 3050, with resistance at 3125, 3150, and 3167.
This is a follow-up analysis of our prior report “Gold (XAU/USD) grinds above $3000/oz. Are bulls ready to take charge?” published on 5 February 2025.
Gold prices have exploded beyond the $3100/oz level with bulls now firmly in control. US-China trade tensions continue to escalate which is keeping safe haven demand strong.
However, as discussed in the article on April 8, Gold seems to be the preferred safe haven when the CHF and JPY lose value. This goes against the traditional norms when all three would usually move in tandem during periods of extreme volatility and safe haven demand.
This was evident once more yesterday as US President Donald Trump announced a 90day pause on tariffs to most countries while ratcheting up tariffs on China. The result saw the JPY, CHF lose ground but Gold continued to soldier on.
Gold surprisingly followed risk assets like the S&P 500 higher despite the threat of a continued tit-for-tat between the US and China which many are starting to call ‘cold war 2.0’.
FOMC minutes and rate cut bets
Yesterday brought the release of the FOMC minutes which revealed that Federal Reserve policymakers mostly agreed that the U.S. economy faces the risk of higher inflation and slower growth. They warned that the central bank might have to make tough decisions ahead.
This would definitely complicate matters for the Fed. Slower growth usually requires a stimulus in the form of rate cuts, while a rise in inflation would necessitate a rate hike. Interesting times ahead for the Fed indeed.
Markets have been changing their rate expectations at break neck speeds of late. Just yesterday markets were pricing in a 44% chance of a 25 bps cut in May which dropped to 20% after President Trump announced the tariff pause.
As developments around tariffs and their impact continue, I expect rate cut expectations to continue to fluctuate. More data will be needed before the Fed is comfortable making any move.
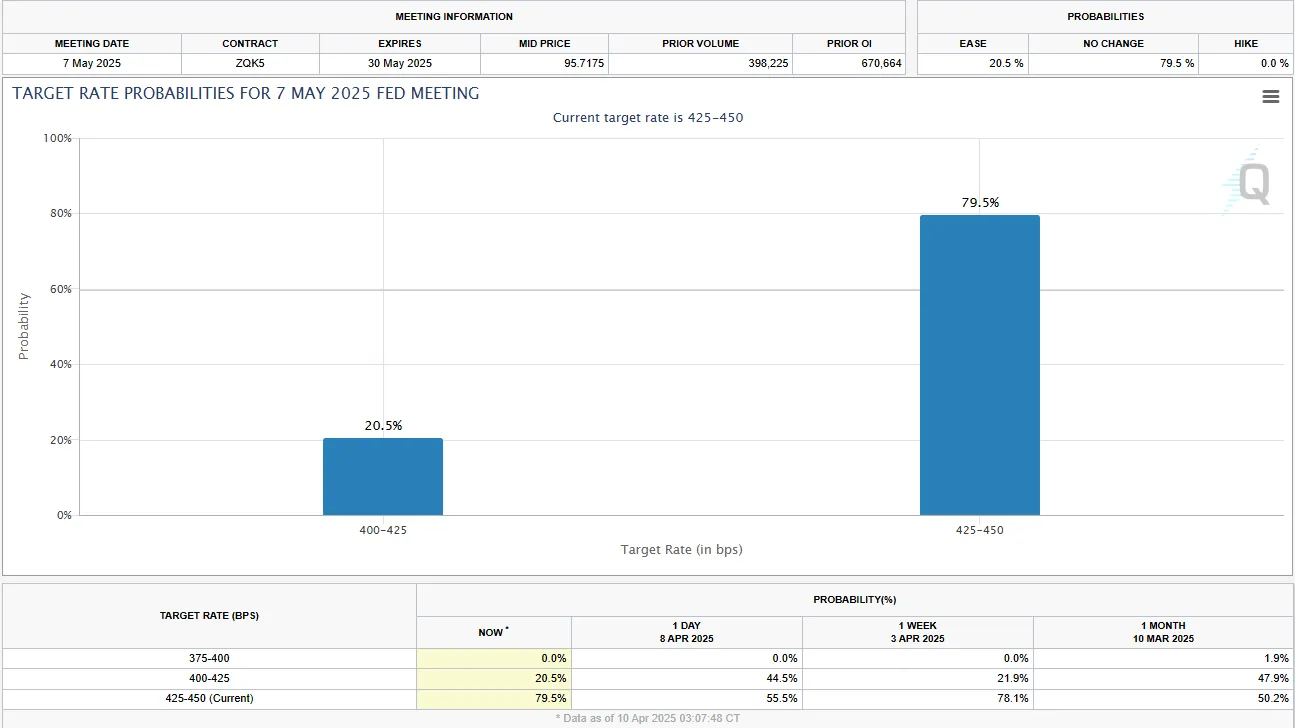
Source: CME FedWatch Tool
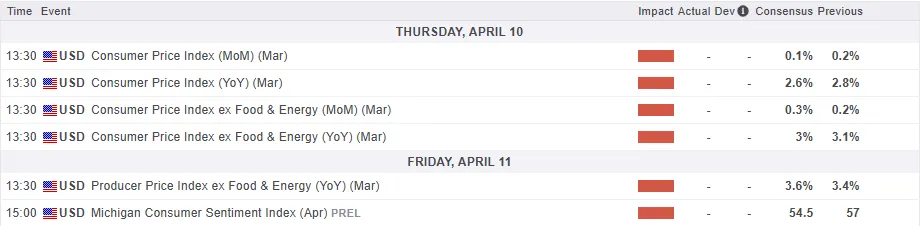
US CPI data ahead
US inflation data may not hold the same sway on market moves at present. The reason being that markets are well aware the supposed impacts of tariffs will not be reflected in today's numbers.
That being said however, a significant uptick in inflation could stir some trouble as markets may be concerned that inflation could explode once the tariff effects are fully felt. Thus a higher than expected print could dent overall market sentiment which means the data remains key in my humble opinion.
Tomorrow we have the Michigan consumer sentiment preliminary data which will be just as intriguing. Inflation expectations last month saw a significant increase with markets likely to play close attention to consumers expectations this time around.
Technical Analysis - Gold (XAU/USD)
From a technical analysis standpoint, Gold prices found their legs yesterday finally breaking above the 3040 handle and pushing on.
The daily candle closed as a massive bullish engulfing candle and finished the day some 3.38% higher.
Gold peaked this morning just above the 3125 resistance handle before falling back toward the 3100 support handle. A base needs to form around here if bulls are to maintain their dominance and push the precious metal to fresh all-time highs.
So far Golds reaction to tariff developments have surprised. Hence caution is the way forward as a deal between the US-China seems some way off at this point.
If such a deal materializes there is a chance that gold prices will fall once more.
Gold (XAU/USD) Daily Chart, April 10, 2025
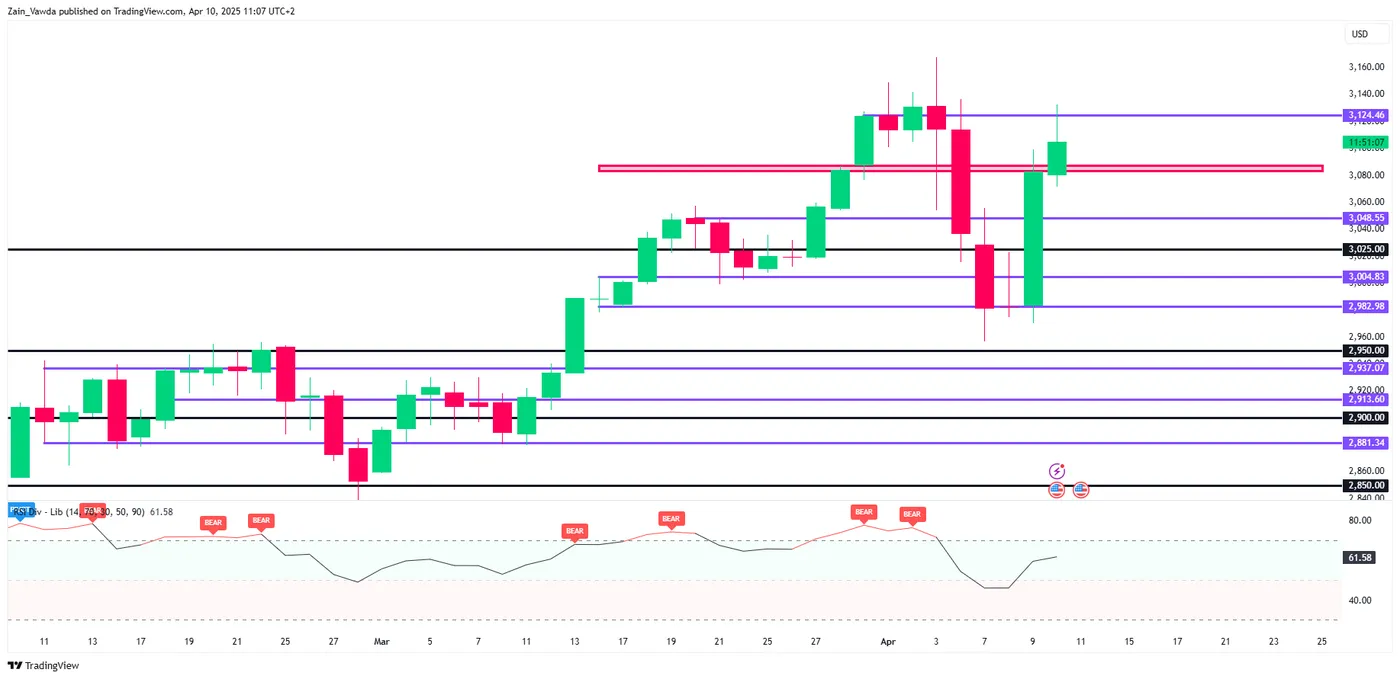
Source: TradingView (click to enlarge)
Support
- 3100
- 3087
- 3050
Resistance
- 3125
- 3150
- 3167 (all-time highs)
Pound Rallies Sharply Weak Dollar Boosts GBP, But BoE Rate Outlook May Complicate Future Gains
GBP/USD has risen for the third consecutive session, reaching 1.2857, primarily driven by a weaker US Dollar amid escalating US-China trade tensions.
Key factors influencing GBP/USD movements
China has raised tariffs on US goods to 84%, effective 10 April, in retaliation for the US increasing duties on Chinese imports to 104%.
Bank of England Deputy Governor Clare Lombardelli warned that these tariffs could dampen UK economic growth, though their impact on inflation remains uncertain.
Markets are now pricing in a high probability of a 50-basis-point rate cut in May, with expectations shifting to four cuts by the end of 2025 – up from three previously forecast. Investors are nearly 100% confident in a second cut in June, while a third reduction in September is already fully priced in.
Technical Outlook: GBP/USD
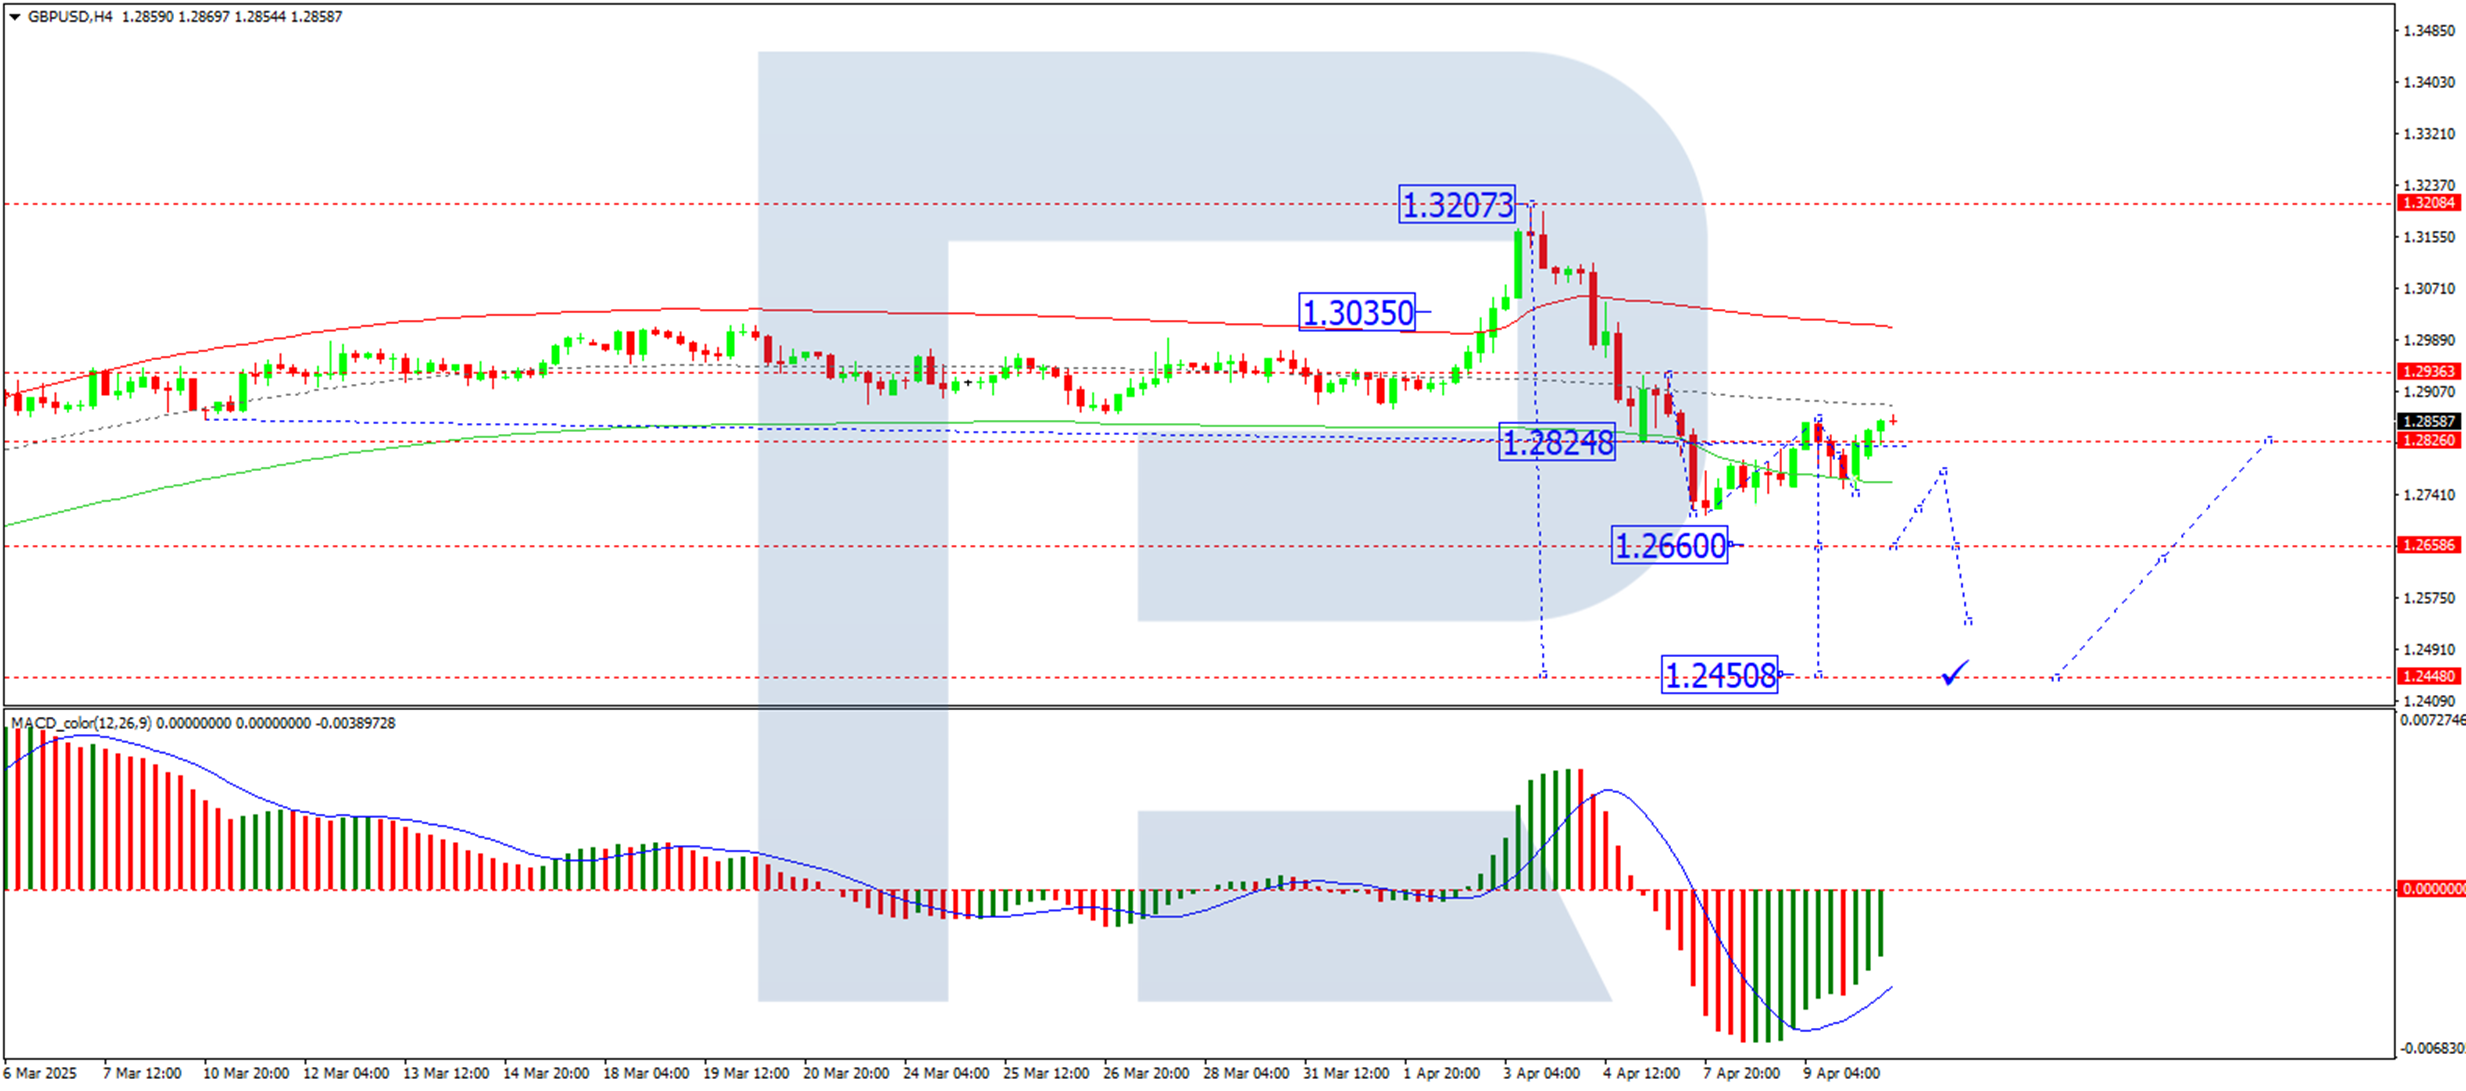
H4 Chart Analysis
- GBP/USD is consolidating around 1.2825, with the potential for an upward extension to 1.2875
- A downward wave towards 1.2660 remains plausible, with further downside risk to 1.2450
- The MACD indicator supports this outlook, with its signal line below zero and pointing sharply downward
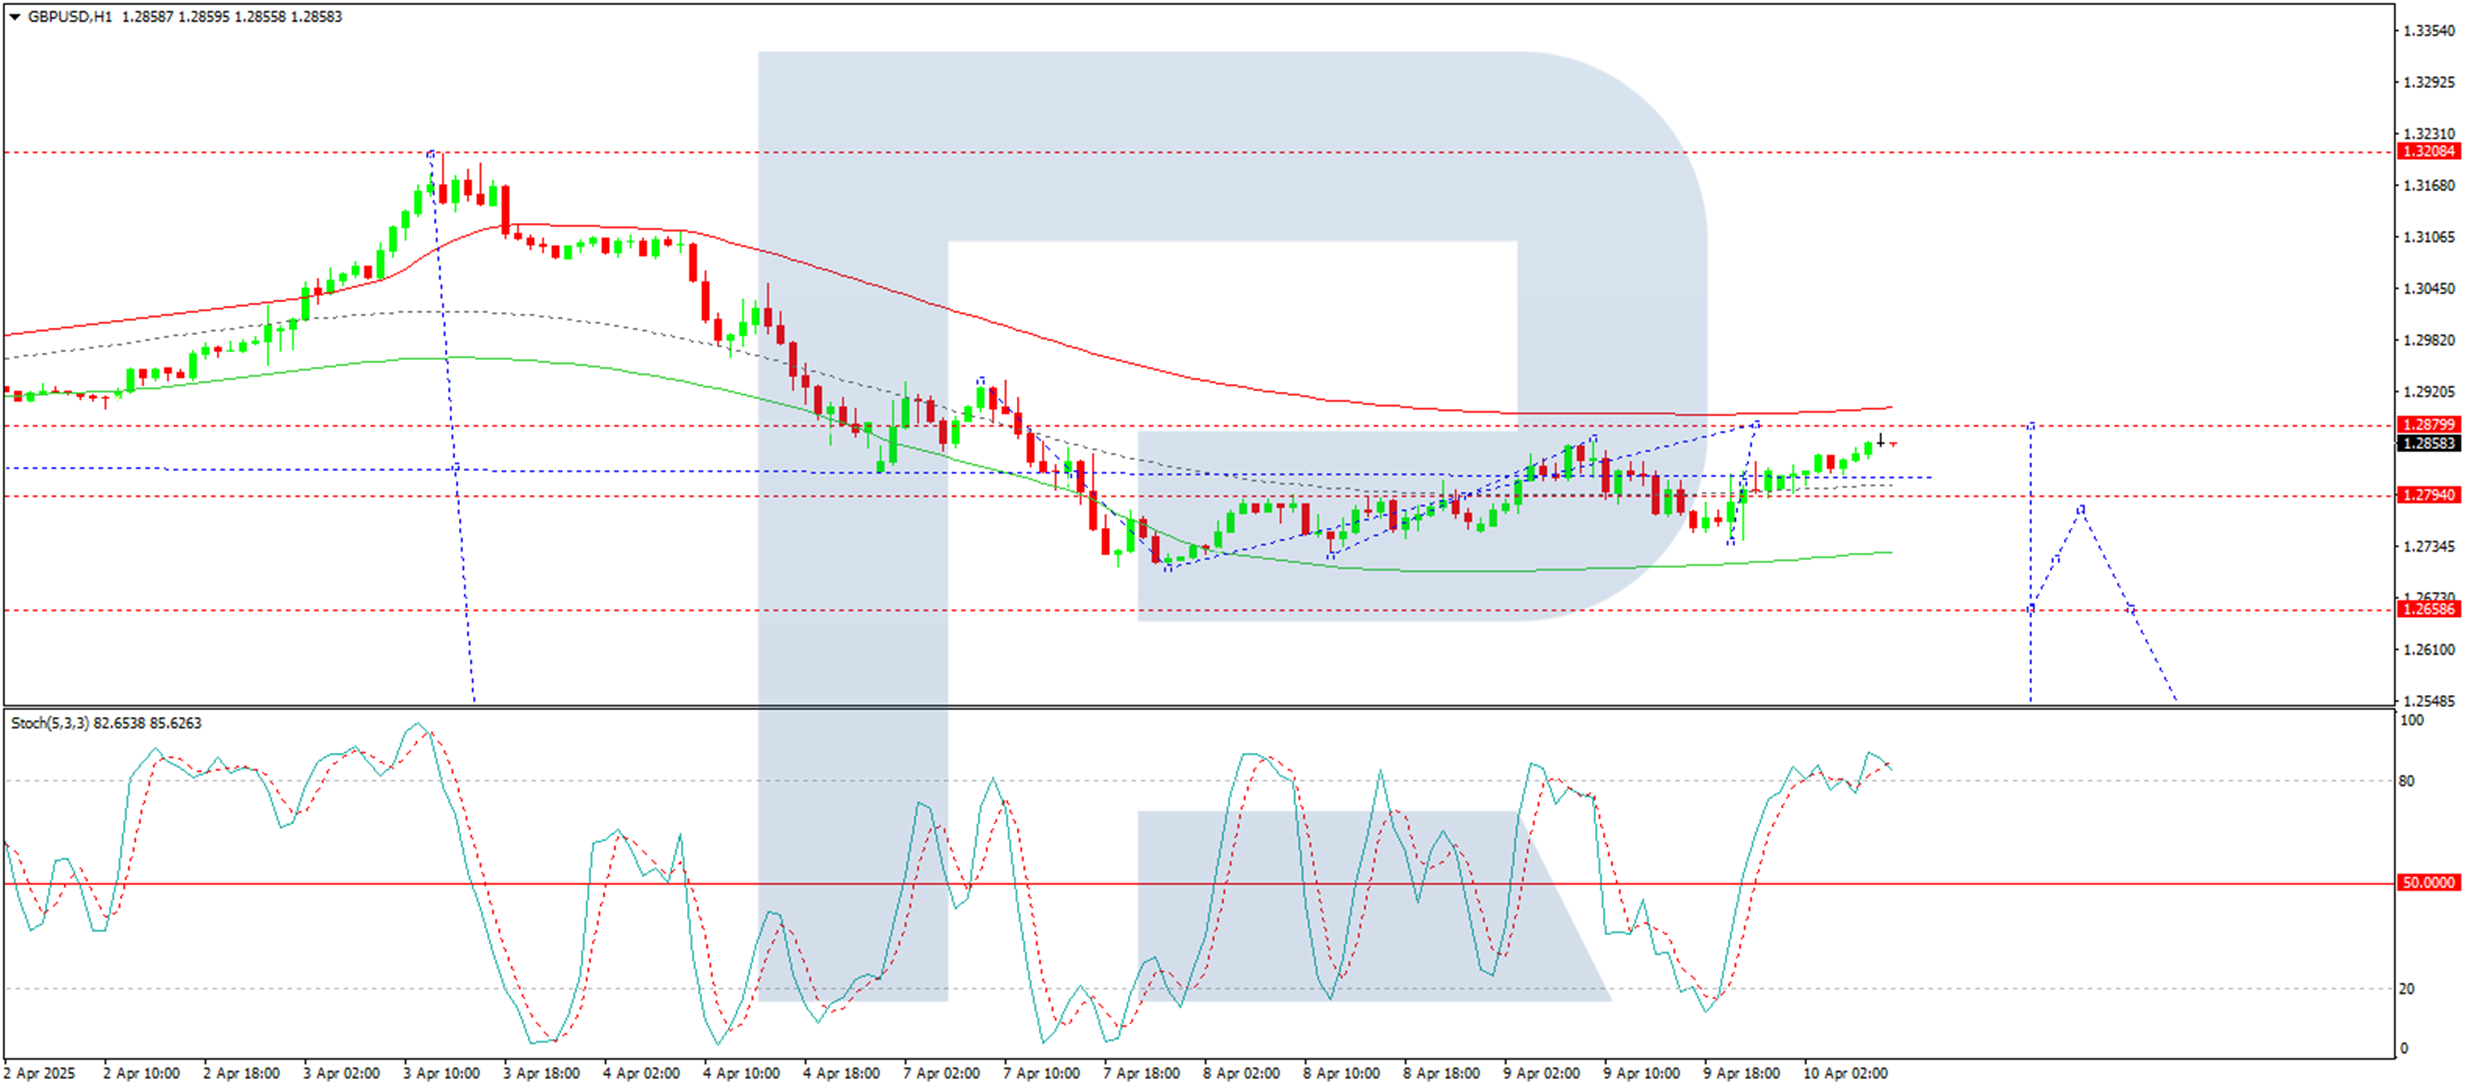
H1 Chart Analysis
- The pair has formed a tight consolidation range near 1.2794, with scope for a rise to 1.2880 to complete the current growth wave
- A subsequent decline back to 1.2794 is likely, potentially forming a new consolidation range
- A breakout upwards could see a correction towards 1.2934, while a downward exit may extend the downtrend to 1.2450
- The Stochastic oscillator aligns with this view, as its signal line sits above 80 but is trending downward towards 20
Conclusion
While the Pound benefits from Dollar weakness, the BoE’s evolving rate-cut trajectory and external trade risks could challenge further gains. Traders should monitor technical levels and central bank signals closely.
Bond Market Crash a Far Bigger Risk With Devastating Consequences
Markets
In our evening Sunset report yesterday, we put the focus on the US 10-y note auction as US bonds, alongside almost all other (US and non-US) risk assets, teetered on the brick of a collapse. The auction as such was ok, given reigning sentiment at that time. However, a few minutes after the auction result, the US bond market received a far more important signal: an outright Trump put! The equity sell-off was the most eye-catching collateral damage of the escalating trade war. However, from a US government perspective a bond market crash, for sure was a far bigger risk with potential devastating consequences. The US 30-y yield touching 5%, rather than trading partners proposing negotiations or investors complaining about equity losses, probably was the major reason for president Trump to announce a 90-day pause on the implementation of the higher layer (> 10%) of the reciprocal tariffs for most trading partners. China was excluded and hit by a 125% duty after it took retaliatory actions. In a first Pavlov reaction, US equity indices jumped between 7.87% (Dow) and 12.16% Nasdaq. The US yield curve bear flattened. The 2-y yield jumped 18.bps. The need for potential emergency Fed action was removed. Powell can stick to the wait-and-see approach. At the same time, risk premia at the long and of the US curve eased albeit modestly. The 10-y still rose 3.9 bps in a daily perspective. The 30-y declined 2.8 bps, but both closed well off the intraday highs recorded in Asia. The Trump put at work. The dollar showed some relieve, but gains after all remained very limited. DXY at 102.9 closed only marginally higher. Idem for EUR/USD (1.095 from 1.096). The yen underperformed on recent save haven strength (USD/JPY 161.9 from 160.3). European markets were closed at the time of the announcement of the tariff pause. During the day, bunds clearly took the role of safe haven with yields declining 11 bps (2-y) to -2.8 bps (30-y). The Bund future contract dropped sharply as this safe haven bid evaporated.
Asian equities join the relief rally from WS with Japan a major beneficiary (Nikkei+ 8%). European futures suggests opening gains of up to 7%. US futures hesitate (Nasdaq future -1%). US yields decline further (10-y -3.5 bps). Question remains to what extent this 90-day pause will remove underlying uncertainty. We assume the downside potential for US yields to remain limited. The Fed might stick to its leaning against the (inflation)wind approach. For the long end, inflation risks and fiscal sustainability issues have not disappeared. Data in the current environment almost always are a bit ‘outdated’. Even so , we keep an eye on March US inflation figures. The 30-y bond auction will be an interesting challenge for the Trump bond put option. German/EMU yields might rally as the safe haven bid eases. The tariff pause gives the new German coalition time to develop its fiscal response. The picture for the dollar still looks fragile after yesterday’s unconvincing rebound. Sterling came back after the announcement yesterday (EUR/GBP from intraday top near 0.886 to 0.855). Even so, we also keep an eye at the long end of the UK yield curve, with the 30-y yield at a highest level since mid-1998.
News & Views
Chinese inflation declined by 0.4% M/M in March with prices falling by 0.1% on an annual basis (from -0.7% Y/Y in February). Details showed consumer goods deflation of -0.4% Y/Y while services prices were slightly higher (0.3% Y/Y). Food prices remain a drag (-1.4% Y/Y) while underlying core inflation accelerated from -0.1% Y/Y to +0.5% Y/Y. On a product level, there was a significant drag coming from transport & communication prices (2.6% Y/Y). Producer price deflation entered its 30th consecutive month with PPI falling by 2.5% Y/Y. Chinese leaders are expected to meet today to discuss additional stimulus plans. Apart from the fiscal side, the PBOC could resume monetary policy easing as well given this extended state of Chinese deflation. Policy makers also allow for a further weakening of the Chinese yuan with USD/CNY fixing at the highest level since 2007 (currently 7.34).
The UK’s Royal Institution of Chartered Surveyors (RICS) residential market survey for March showed market conditions weakening amid an increasingly challenging macro backdrop. Buyer enquiries (net balance -32% from -16%, weakest since September 2023) and agreed sales (-16% from -13%, lowest since end 2023) indicators moved deeper into negative territory while house prices (+2% from +11%) were largely flat at the headline level. Near-term (3-month) expectations are now consistent with a weaker outlook for activity (-26% from -16%) and even if twelve-month expectations are still mildly positive for now (+39% from +47%).
ECB’s Villeroy: Thank God we created Euro, as tariff turmoil undermines Dollar
French ECB Governing Council member François Villeroy de Galhau emphasized today that while the US has long championed the global centrality of the Dollar, recent policy moves on tariffs are beginning to erode international confidence in the greenback.
Speaking on France Inter radio, Villeroy said the Trump administration’s approach is “very incoherent,” and suggested that its recent actions “play against the confidence” typically held in Dollar.
He contrasted this with the Euro, praising Europe’s foresight in establishing its own independent monetary system 25 years ago. “Thank God that Europe… created the Euro,” he noted, adding that the bloc now enjoys “monetary autonomy” that allows ECB to manage interest rates in a way that diverges from US policy, something that was not possible in the past.
European Currencies Test Recent Extremes Ahead of US Inflation Data
Against the backdrop of yesterday’s announcement of a 90-day pause on previously imposed tariffs by the Trump administration, volatility in the currency markets has sharply increased again. European currencies, such as the Swiss franc, euro, and pound, continue to test recent extremes, awaiting the release of inflation data from the US.
The events of this week are heightening uncertainty among investors, who are striving to adapt to new economic conditions. The introduction of the tariff pause came as an unexpected move, which temporarily eased tensions in the global markets. However, it remains unclear how this will affect the long-term prospects for currency pairs such as EUR/USD and GBP/USD.
In the face of instability, market participants continue to seek ways to minimise risks and protect their investments. Today's core consumer price index (CPI) data may provide further clues about the impact of Trump’s tariff policy on the US economy and, in general, on the currency markets.
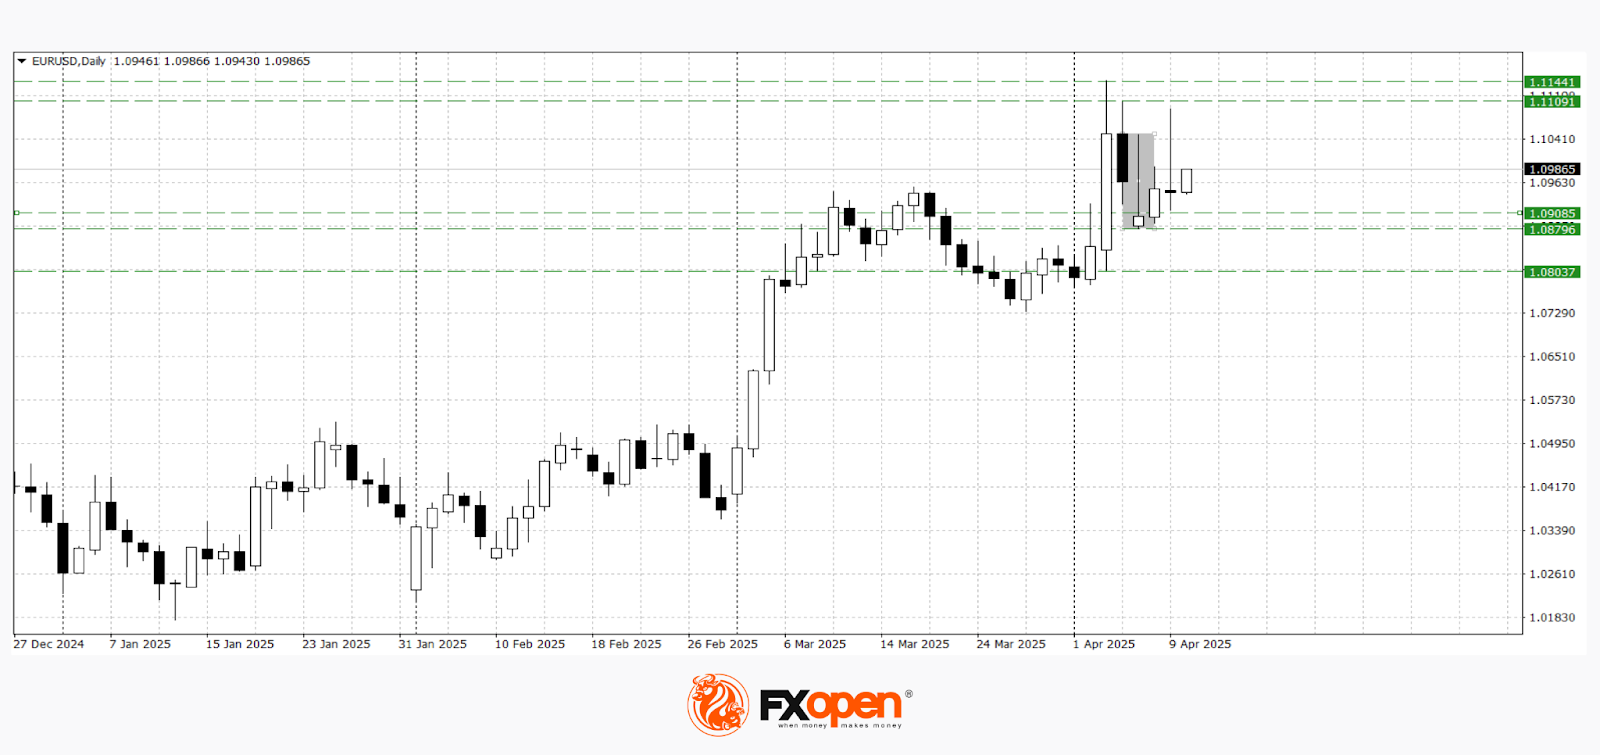
EUR/USD
Last week, buyers of the EUR/USD pair managed to break through a series of key resistances at 1.1100–1.1000 and recorded the highest level of the year at 1.1145. Following news of tariffs being imposed on the European Union, the pair lost over 200 pips and tested an important range of 1.0900–1.0870. Yesterday, there was a resumption of the upward momentum, and the pair tested recent extremes again at 1.1100. Technical analysis of EUR/USD suggests potential strengthening of the pair towards 1.1145, provided it can settle above 1.1000. A drop below 1.0870 could lead to a retest of 1.0800.
Upcoming events that could significantly impact the movement of EUR/USD:
- Today at 11:00 (GMT+2): Industrial production volume in Italy
- Today at 12:15 (GMT+2): Speech by ECB Governing Council member Tuominen
- Today at 15:00 (GMT+2): Speech by Claudia Buch, Vice-President of the German Bundesbank
- Today at 15:30 (GMT+2): US Core Consumer Price Index (CPI)
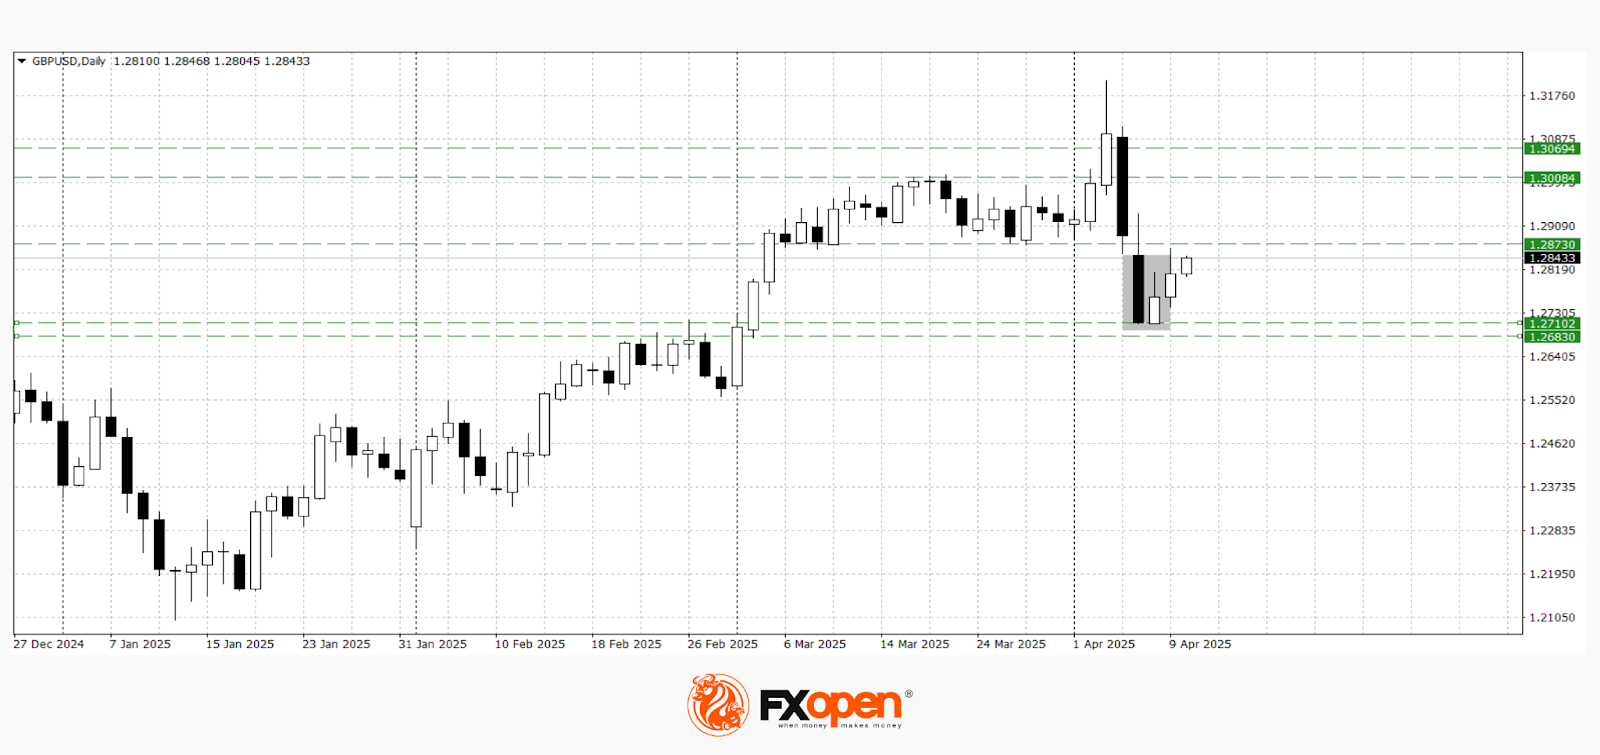
GBP/USD
The losses in GBP/USD after testing 1.3200 amounted to more than 400 pips. The announcement of a 90-day pause on the action of the imposed tariffs allowed buyers of the pair to find support at 1.2700 and form a reversal pattern, the "bullish harami", on the daily timeframe. Technical analysis of GBP/USD suggests a potential rise towards 1.2900–1.2870.
The following events may influence GBP/USD pricing in the upcoming sessions:
- Today at 11:30 (GMT+2): Bank of England’s Credit Conditions Survey
- Today at 13:00 (GMT+2): PCSI Index by Thomson Reuters/Ipsos
- Today at 16:00 (GMT+2): Speech by Bank of England representative Briden
- Tomorrow at 09:00 (GMT+2): UK Gross Domestic Product (GDP)
Trade over 50 forex markets 24 hours a day with FXOpen. Take advantage of low commissions, deep liquidity, and spreads from 0.0 pips. Open your FXOpen account now or learn more about trading forex with FXOpen.
This article represents the opinion of the Companies operating under the FXOpen brand only. It is not to be construed as an offer, solicitation, or recommendation with respect to products and services provided by the Companies operating under the FXOpen brand, nor is it to be considered financial advice.
Elliott Wave Outlook: Silver (XAGUSD) Might Have Launched into the Following Leg Higher
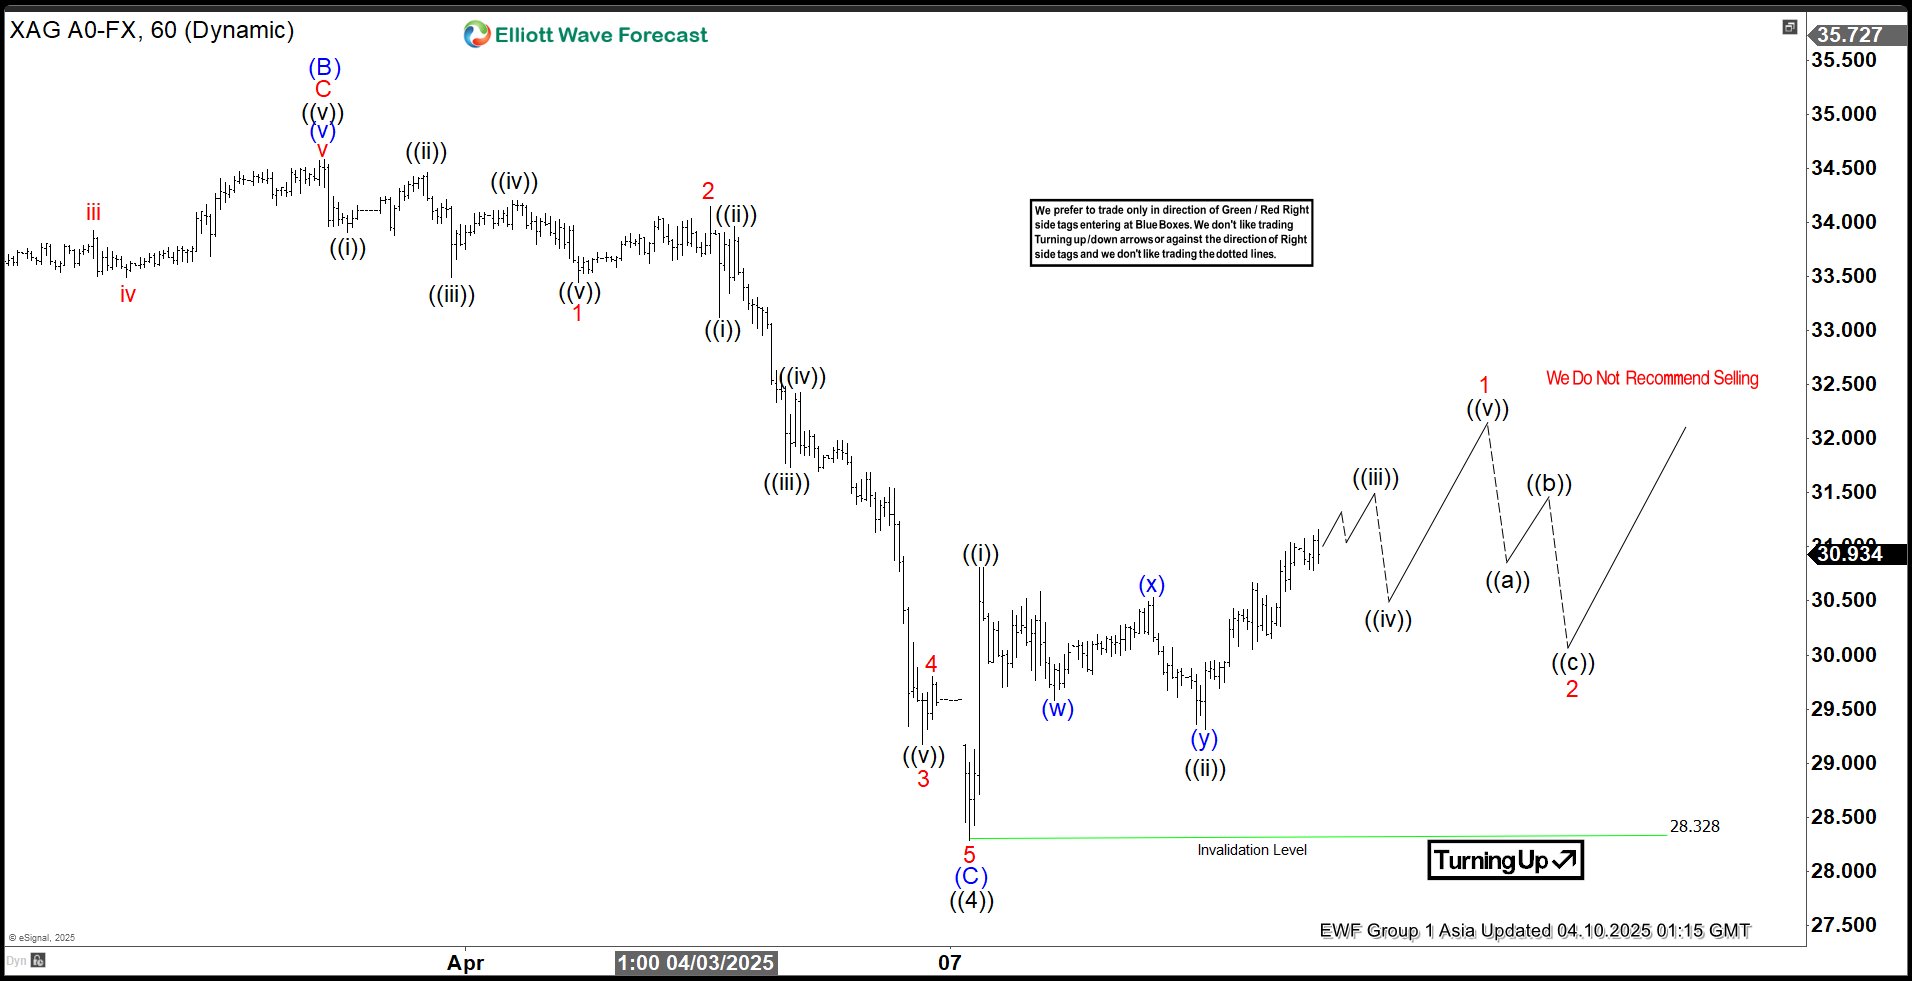
Silver (XAGUSD) has hit a key turning point after dropping from its October 23, 2024 peak. This decline unfolded in three distinct swings, following a zigzag pattern known as an Elliott Wave structure. Starting from that high, the first drop (wave A) landed at 29.68, followed by a bounce (wave B) to 34.58. Then, the final slide (wave C) bottomed out at 28.328, as seen on the hourly chart. This marked the end of a larger correction phase, called wave (4). Silver found its footing in a critical support zone between 24.86 and 28.56—a range calculated using Fibonacci tools, stretching 100% to 161.8% of the drop from the October high.
Now, silver is climbing again in what’s labeled wave (5). To confirm this upward trend, it needs to break past the prior peak of 34.86 from wave (3); otherwise, it might face another dip. Since bottoming out on April 7, 2025, at 28.328, silver rose to 30.81 (wave (i)), then eased back to 29.31 (wave (ii)). For now, as long as the 28.32 level holds firm, silver seems set to keep rising in the short term, offering hope for bullish traders.
XAGUSD (Silver) 60 Minute Elliott Wave Chart
XAGUSD (Silver) Video
https://www.youtube.com/watch?v=k02d64qOjtk
Sovereign Bond Markets Said the Last Word
The red line was the sovereign bond markets. It was the flash selloff in US Treasuries over the past few days that finally made Donald Trump take a step back from his tariff strategy. He didn’t care about the equity selloff, he couldn’t care less about the global risk rout, and he was likely pleased to see Chinese assets and crude oil tank. But the fire sale in U.S. Treasuries dialled up the pressure to a point that apparently became unbearable—even for Trump. He announced a 90-day pause for countries that haven’t retaliated, while doubling down on China. Chinese products will be taxed at 125%, in response to China’s announcement of 84% tariffs on US imports.
Ironically, it seems the Europeans—who did retaliate—might still benefit from the 90-day ceasefire. That said, the universal 10% tariffs are still in place, and the trade war is far from over. We'll be talking about this nonstop for the next 90 days and nights—and probably for years to come.
Now, the market reaction to the tariff pause was incredible. First, the pressure on US Treasuries eased: the 10-year yield dropped below 4.30% from above 4.50%, and the 30-year yield fell below 4.70% after spiking above 5% earlier in the day. Then, US equities staged the biggest rally since 2008—and the fifth largest in history. The S&P 500 jumped 9.5%, Nasdaq 100 soared 12%, and the Dow nearly 8%.
Nvidia recovered more than 18% of its value in one session. Apple surged 15% from a yearly low, Amazon rose 12%. US energy stocks rebounded nearly 8% alongside crude oil. Even Nasdaq’s Golden Dragon China Index climbed 4.5%. Wild moves.
This morning, European stock futures are up more than 8%, though US futures are taking a breather. Investors are hoping this 90-day pause gives countries enough time to renegotiate, reorganize supply chains, and soften the tariff shock. That’s fundamentally positive—whether the tariffs go ahead or not. Having time to put together a Plan B is a gift... but I wouldn’t pop the champagne just yet. We’ve already seen how the uncertainty alone has hit businesses.
- Delta Airlines lowered its earnings guidance, citing global trade tensions.
- Amazon cancelled orders for China-sourced products to cut exposure to Chinese supply
- Walmart, on the other hand, stuck to its full-year forecast, betting that chaos will drive more shoppers to its low prices.
Let’s not forget: China remains a critical market for companies like Apple and Nike. And on that front, the war rages on. So yes—some relief, but tread carefully.
Tomorrow kicks off the US earnings season. Expect more focus on guidance than on the actual numbers. Forecasts will likely be revised downward—unless for companies that thrive in downturns like Walmart or Dollar General. The key is how much guidance gets cut, and whether that’s already priced into recent market selloffs. The good news? Market pessimism ran deep enough to leave room for a rebound.
Still, trying to predict the next minute in this market is nearly impossible. The US has gone completely off-script. Donald Trump will go down in history as the most unpredictable US president at best—and at worst, as the one who dismantled the very idea of American exceptionalism.
Uncertainties will persist, though yesterday’s rebound rests on solid ground. We could see it extend—if Trump can just stay quiet for a few days, let the market digest the news, and watch how companies react.
On the data front, the US CPI update is due today and should land with a bit less tension. Headline inflation is expected to ease from 2.8% to 2.5%, likely helped by lower energy and egg prices. Core inflation should stay near 3%.
The Federal Reserve (Fed) has remained relatively quiet during the selloff, simply noting that policy is “in a good place” amid growth and inflation uncertainties. Recession bets may have eased, but they’re still far higher than before Trump took office. And if inflation stays in check, the Fed should cut rates more 3-4 times this year depending on the Trump-induced damage that’s impossible to predict at this point.
Markets presently price in more than a 10% chance of a 50bp cut in June. As little sense as it made to cut rates by 50bp last September, it may make just as much sense now. Therefore, if inflation softens and economic data disappoints, dovish expectations could help keep risk appetite afloat.
As for China—it’s complicated.
The 90-day reprieve doesn’t apply. Inflation data shows deflationary pressures persist despite Beijing’s stimulus efforts. But that weakness might just be the fuel needed for stronger support measures. For those betting that US exceptionalism is fading, China remains an intriguing – though risky - diversification play.