
Sample Category Title
Back to Red
Tariff-pause optimism didn’t last long. Although the European markets followed the US to the upside, mood in the US turned increasingly sour and led to another wave of selloff as the trade war escalated with China. China announced to restrict the US movie imports and the US increased its tariffs on Chinese goods to 145%. The S&P500 gave back 3.50%, the tech-heavy Nasdaq tanked more than 4% as Dow Jones fell 2.5%, shedding more than 1000 points. On the individual level, Disney lost 6%, while the owner of Temu, PDD, lost a similar amount. Gold soared past the $3200 per ounce!
The futures are slightly positive this morning but note that the US selloff accelerated after the European close so there should be a certain catch up today. Broadly the direction remains pretty clear – big jumps are as disquieting as big selloffs; a 3-4% rebound for an index is hardly sustainable when investors remain worried about the trade war uncertainties, the potential impact on the economic growth, on inflation and on jobs.
And this is the message that investors emphasized yesterday. The broadly softer-than-expected US inflation data hardly saw any positive reaction from the markets. The data itself was unusually weak. Both headline and core inflation came in softer than expected on a yearly basis. And on a monthly basis, the headline CPI printed a negative number for the first time since July last year, services excluding housing and energy also fell. The latter would normally boost the dovish Federal Reserve (Fed) expectations and risk appetite. But not this time. The US 2-year yield remains under pressure due to the rising bets that the Fed will soon step in, but the latter doesn’t necessarily bring appetite along. In fact, the tariffs are expected to fuel inflationary pressures and limit the Fed’s action scope. Amazon, for example, warns that US consumers will see the tariffs passed on to them.
Stress in bonds is bad, bad news
The fact that the volatility spreads into the government bond markets is not good news because it hits the pockets of the market that you (as a government) want to keep safe – like the pension funds for example. Therefore, I believe that if Trump backing down won’t calm bond investors’ nerves, the Fed will be the next to step in. This is what the Bank of England (BoE) did this week: they temporarily stopped the sale of long-dated bonds in their QT program to ease the pressure on gilt markets. In the US, we haven’t yet seen an encouraging stabilization across the treasury markets following Trump announcement. The US 10-year yield rebounded back to 4.45%, while the 30-year yield is consolidating below the 5% psychological mark. Investors also flee the US bonds on fear of exploding debt due Trump’s tax cut plans. This week the US Senate passed a budget plan that clarifies parameters on tax cuts and debt ceiling increase. Bloomberg estimates that the changes could allow the US government to deliver $5.3 trillion worth of tax cuts over the next decade and rase the debt ceiling by $5 trillion. Tax cuts are good for corporations and valuations BUT if the yields must rise in return, the positive impact will be thrown under the bus.
Today begins the US earnings season. Big banks will open the dance with their Q1 earnings and projections - amid trade uncertainty and severely deteriorating growth projections - will take the center stage and shape investor sentiment. The forecasts will be revised lower, but how low remains to be seen. TSMC for example reported stronger-than-expected sales in Q1, sales increased by a whooping 42% - the fastest since 2022. Normally, such an update would boost appetite for Nvidia – and it certainly limited losses – but Nvidia closed the session nearly 6% lower as no one knows if Taiwan would avoid import taxes even with TSMC’s pledge to invest up to $165bn in the US. I guess we will see...
US Consumer Sentiment in Focus
In focus today
In the US, the University of Michigan's preliminary consumer sentiment survey for April is set for release. The March edition revealed a significant decline in consumer sentiment, alongside soaring inflation expectations. Markets anticipate the index to decrease further from 57.0 to 55.0.
We will also look out for the release of March PPI data, which could reveal some insights into how the preparation for tariffs has impacted producer costs.
In the euro area, ECB's Lagarde is scheduled to speak at the Eurogroup meeting in Warsaw. As the ECB is now in its silent period, we will not get any policy signals.
In Sweden, the final Swedish inflation data for March will be released this morning at 8.00 CET. The flash estimates undershot both our own and consensus expectations, making today's release important to understand future price developments. Food prices were likely one of the items that came in on the low side compared to forecasts, although they are unlikely to be the only category to do so. We expect the final release to mirror the flash figures, expecting CPI at 0.5% y/y, CPIF at 2.3% y/y and core inflation (CPIF excluding energy) at 3.0% y/y.
Economic and market news
What happened overnight
Overnight, markets adopted a risk-off stance despite yesterday's positive consumer price data. The dollar's sharp decline pushed the EUR/USD above the 1.13 mark this morning, while gold prices surged to a record-high, breaching the USD 3200 per troy ounce. Additionally, the sell-off in US Treasuries intensified, driving the 10-year yield climbing to around 4.45.
What happened yesterday
In the global trade war, the EU announced a pause of retaliatory tariffs to facilitate negotiations, though Commission President von der Leyen cautioned that the tariffs could be reinstated if negotiations are unsatisfactory. Additionally, President Trump escalated the ongoing trade war by raising tariffs on Chinese imports to 125%, now making the effective tariff rate 145%.
In the US, yesterday's key event was the March CPI release, which alongside core CPI surprised to the downside at -0.1% m/m (cons: 0.1%) and 0.1% m/m (cons: 0.3%). Energy prices contributed negatively to the headline figure, while food inflation accelerated. On the core front, goods prices declined from the previous month, and core services inflation also slowed considerably, potentially indicating weakening pricing power among firms. This pre-Liberation Day data warrant cautious interpretation, yet it indicates that broader inflation pressures were relatively subdued ahead of tariffs announcements. The market reaction remained modest. For more insights, see Global Inflation Watch - Disinflation continued ahead of Trump's tariff salvo, 10 April.
In Norway, the eagerly awaited March inflation figures were released, following February's topside surprise, which led Norges Bank to maintain its March policy stance. The figures revealed an annual core inflation rate of 3.4% (prior 3.43%), consistent with both consensus and Norges Bank. Headline inflation registered at 2.6% y/y, slightly below Norges Bank's estimate of 2.7%. However, the core measure remains the most important for policy setting. The details revealed less pronounced increases in air fares and restaurant prices compared to last year, while food prices continued to rise. Consequently, services ex. rent decreased from 3.8 % to 3.5 % whereas domestic goods increased from 7.0% to 7.6% y/y.
In Sweden, February GDP, production and consumption indicators came in as a mixed bag. GDP and production declined -1.5% m/m (prior: -0.5%) and -0.2 % m/m (prior: -0.8 %), respectively whereas consumption increased 1.1% m/m (prior: -0.7%). The data appears somewhat inconsistent, given that consumption carries a significant weight in GDP calculation.
In Denmark, March CPI inflation declined sharply to 1.5% from 2.0% (cons:1.7%), particularly driven by electricity prices. Package holidays showed the largest downside surprise with a 16.5% m/m decrease, which is expected to correct. Core price pressures in Denmark remain muted, consistent with an annual inflation rate of less than 2%.
Equities: Equities retreated on Thursday. However, equities are simply the derivative of what is happening in the FX- and bonds market right now. On top of the financial stress building, the FX swings mean uncharted history for local export companies, trying to defend margins in the US when demand is dropping and FX is making products appear more expensive, on top of tariffs... However, this is not yet visible in European markets where futures are holding up well this morning. US markets sold off yesterday though, with MAG 7 companies leading declines. This was a broad selloff, with 429 of the 500 S&P companies retreating. However, with the rally in the prior session, US equities are still outperforming European ones even on a sector-for-sector basis since April 2nd. Hence, one should probably see the retreat in US markets as reversion to global markets. It should be noted that it was not risk-off everywhere, retail investors were more buoyant sending bitcoin 4% higher but they are typically a lagging and not a leading indicator.
FI&FX: US equities had a rough session throughout Thursday's session, dropping between 3.5-4.5% throughout the session, while European equities caught up with the global rebound on Wednesday evening following the 90-day tariff pause announcement. EUR/USD has continued moving higher since yesterday, and the cross is trading very close to 1.135 this morning. Havens such as CHF, JPY and gold have been bid since the sentiment turned sour again, while both SEK and NOK have fully reversed the strengthening against EUR seen on Wednesday. Long-end US Treasury yields have risen yesterday with the 10Y tenor almost 25bp higher at 4.45%, while the 2Y point is down 10bp following the soft CPI figures. Brent is trading at USD63.1/bbl. this morning, and the NIKKEI 225 index has shed almost 4% since yesterday.
EUR/USD Daily Outlook
Daily Pivots: (S1) 1.1016; (P) 1.1129; (R1) 1.1315; More...
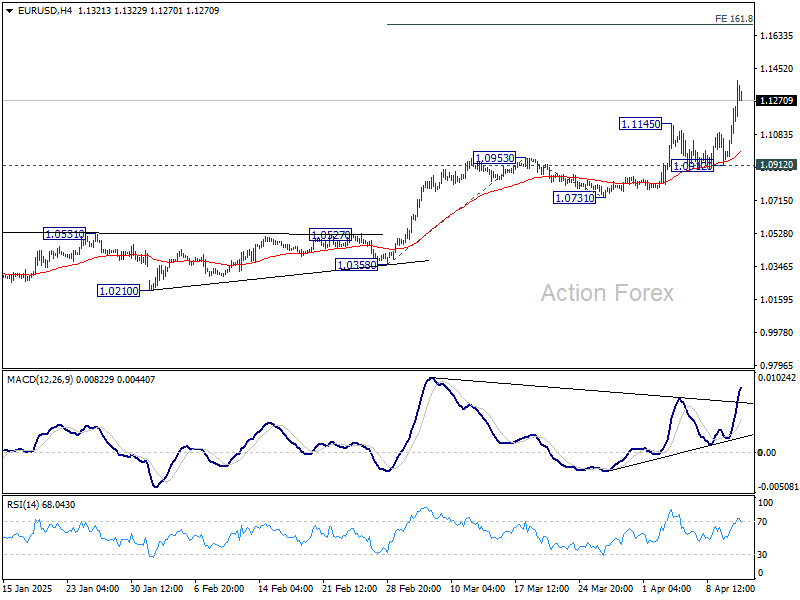
Intraday bias in EUR/USD Is back on the upside with break of 1.1145. Also, the break of 1.1274 indicates large up trend resumption. Further rise should be seen to 161.8% projection of 1.0358 to 1.0953 from 1.0731 at 1.1694. For now, near term outlook will remain bullish case long as 1.0912 support holds, in case of retreat.
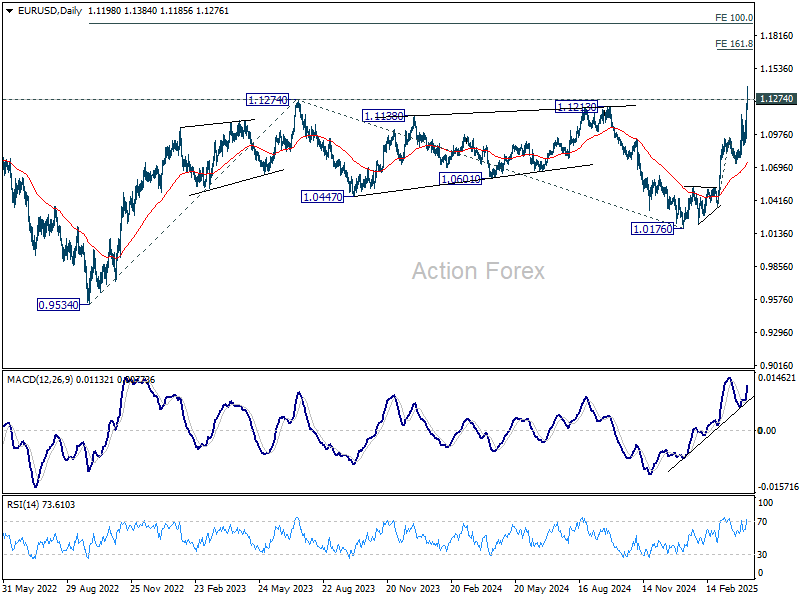
In the bigger picture, break of 1.1274 (2024 high) indicates resumption of whole up trend from 0.9534 (2022 low). Next target is 100% projection of 0.9534 to 1.1274 from 1.0176 at 1.1916. Also, that will send EUR/USD through the multi-decade channel resistance will carries larger bullish implication. This will now be the favored case as long as 55 D EMA (now at 1.0745) holds.
GBP/USD Daily Outlook
Daily Pivots: (S1) 1.2841; (P) 1.2918; (R1) 1.3049; More...
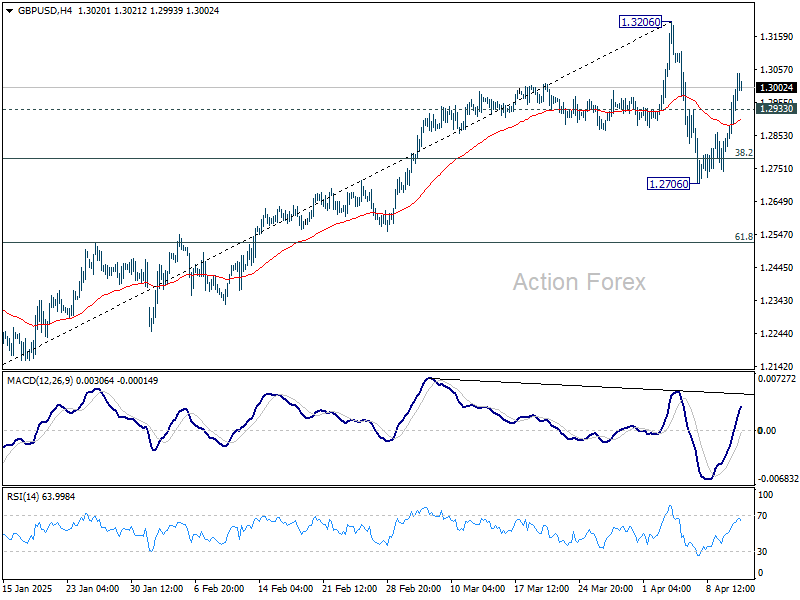
Intraday bias in GBP/USD is back on the upside with firm break of 1.2933 minor resistance. Retest of 1.3206 should be seen first. Break there will resume the rally from 1.2099 towards 1.3433 high. For now, near term outlook will stay bullish as long as 1.2706 support holds, in case of another dip.
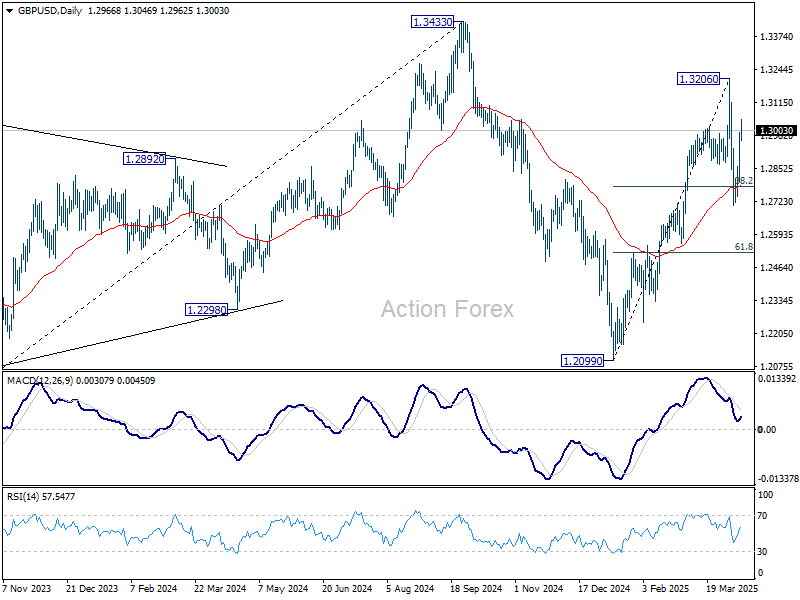
In the bigger picture, price actions from 1.3433 are seen as a corrective pattern to the up trend from 1.3051 (2022 low). Rise from 1.2099 could be the second leg. Overall, GBP/USD should target 1.4248 key resistance (2021 high) on break of 1.3433 at a later stage.
USD/JPY Daily Outlook
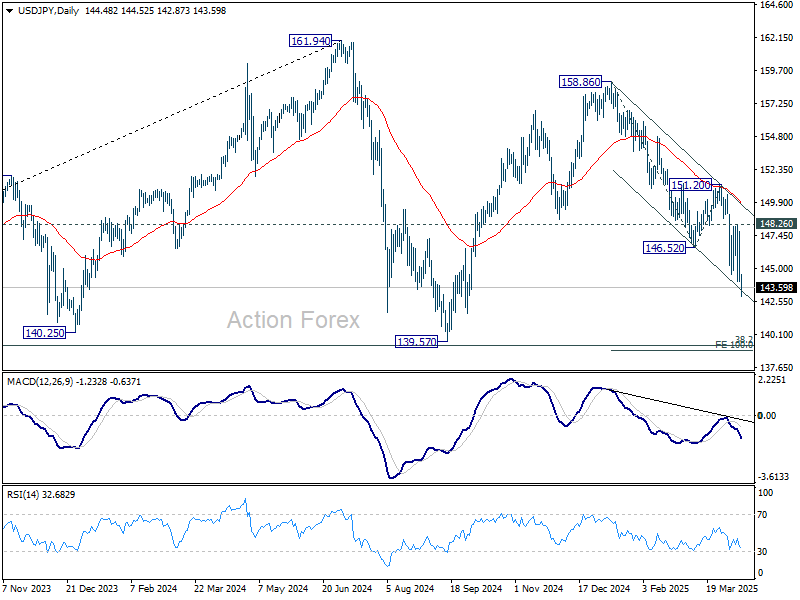
Daily Pivots: (S1) 143.01; (P) 145.44; (R1) 146.86; More...
Intraday bias in USD/JPY is back on the downside with break of 143.98 temporary low. Current fall from 158.86 should target 139.57 support next. On the upside, break of 148.26 is needed to indicate short term bottoming. Otherwise, outlook will stay bearish in case of recovery.
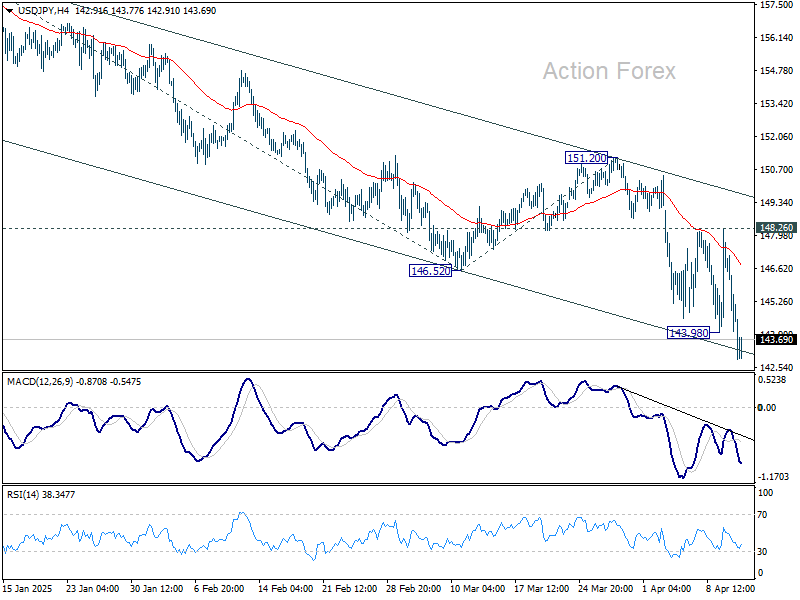
In the bigger picture, price actions from 161.94 are seen as a corrective pattern to rise from 102.58 (2021 low), with fall from 158.86 as the third leg. Strong support should be seen from 38.2% retracement of 102.58 to 161.94 at 139.26 to bring rebound. However, sustained break of 139.26 would open up deeper medium term decline to 61.8% retracement at 125.25.
Gold Touches All-Time High. Overbought or Poised for More Upside?
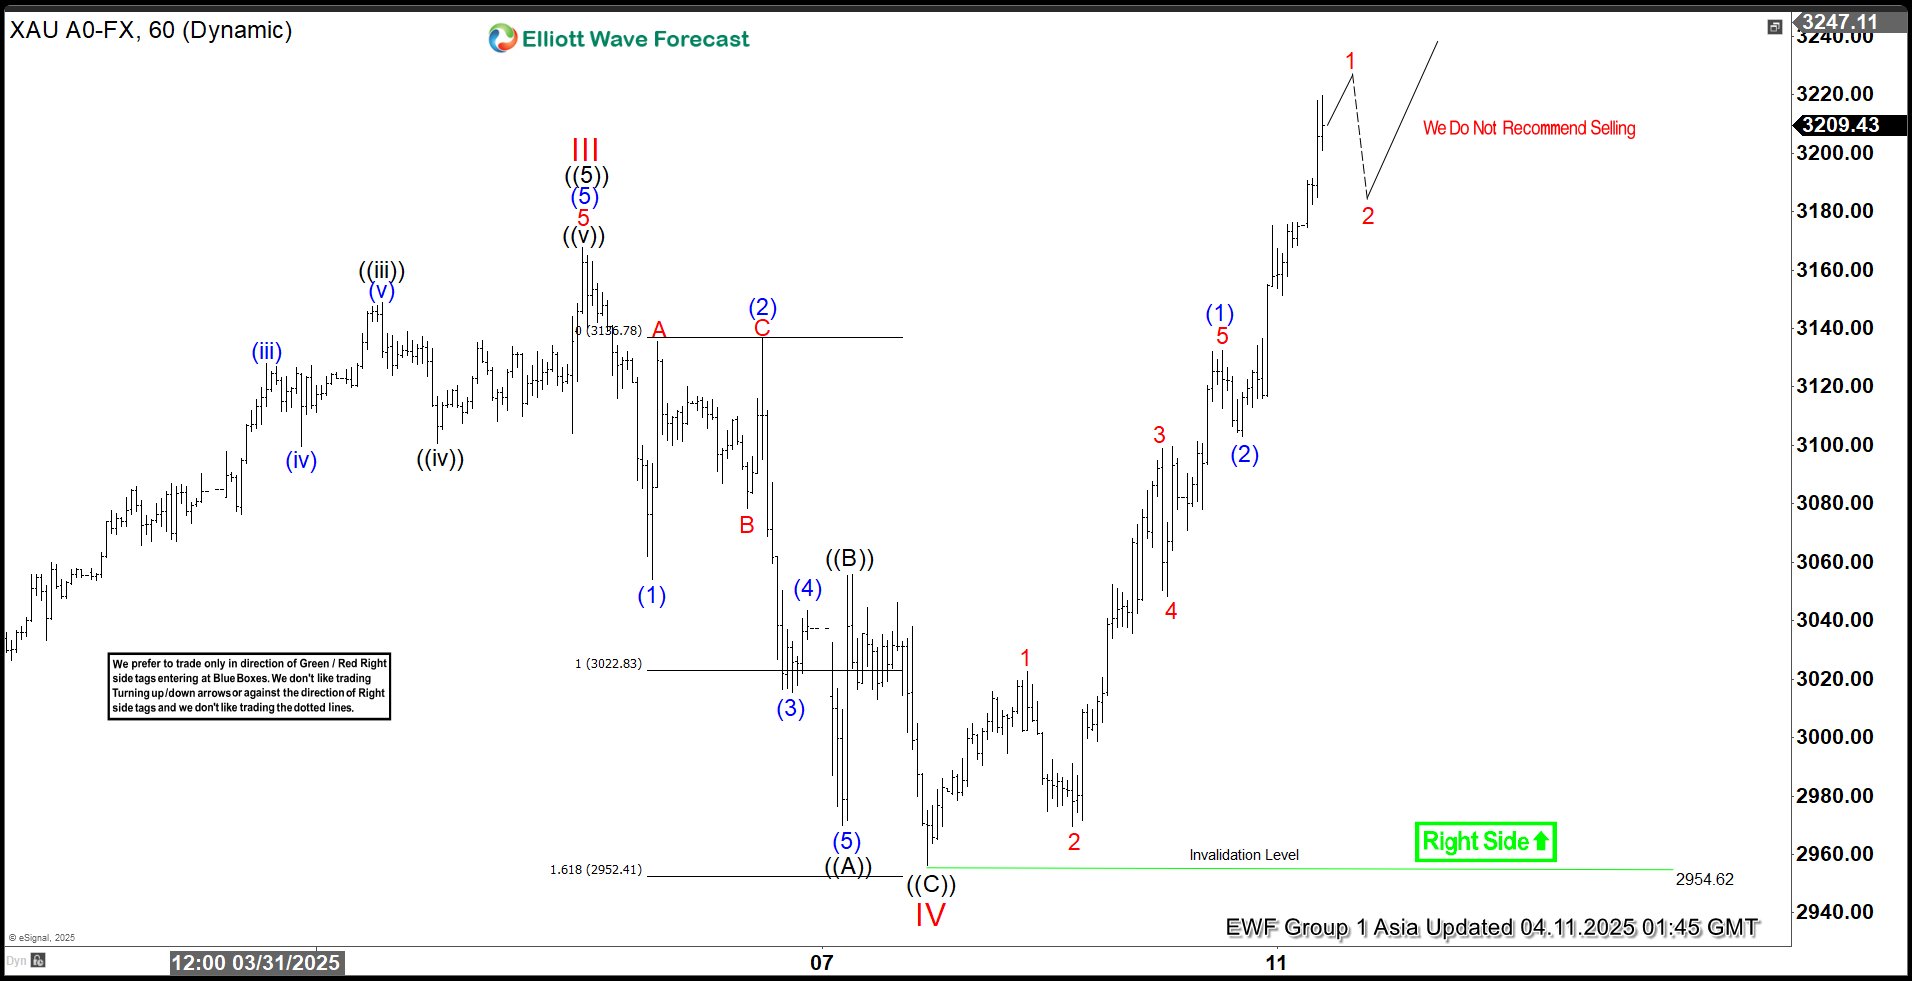
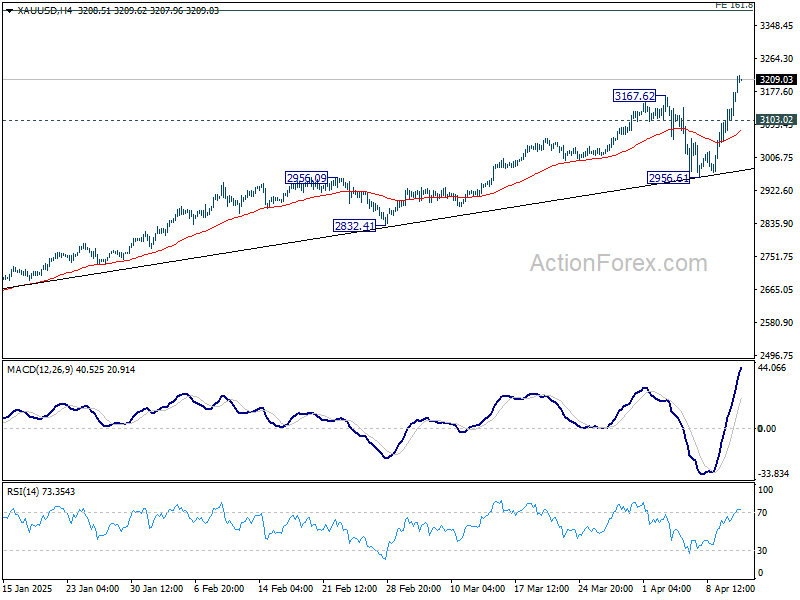
Gold ($XAUUSD) has soared to a new all-time high, marking the launch of its next bullish phase. This powerful uptrend began on September 26, 2022, and is unfolding as a five-wave Elliott Wave pattern, a technical framework traders use to predict market movements. The first wave (I) climbed to 2081.82, showing strong momentum. Then, a corrective wave (II) pulled back to 1810.58, setting the stage for more gains. The third wave (III) was the most explosive, rocketing to 3167.74, driven by global demand for the safe-haven metal. Wave IV followed, forming a zigzag pattern—a typical correction where prices dip before resuming the trend. This correction found its low at 2954.62 after a structured decline.
Now, gold is advancing in wave V, the final leg of this impulse. The first sub-wave, wave (1), hit 3132.59, with smaller waves within it showing steady progress. A brief wave (2) dip ended at 3103.17, and now wave (3) is pushing prices higher. As long as the key support at 2954.6 holds, pullbacks should attract buyers, particularly in 3, 7, or 11 swings—technical levels where dips often reverse. This suggests more upside ahead for gold, appealing to both traders and investors watching this historic rally.
XAUUSD (Gold) 60 Minute Elliott Wave Chart
XAUUSD (Gold) Video
https://www.youtube.com/watch?v=C3JZX3hcvV8
USD/CHF Daily Outlook
Daily Pivots: (S1) 0.8120; (P) 0.8350; (R1) 0.8467; More…
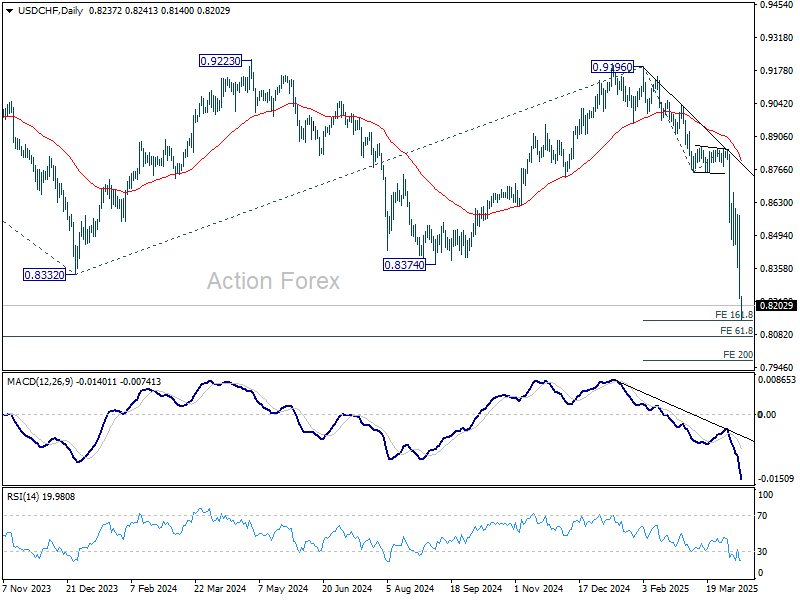
Intraday bias in USD/CHF remains on the downside as current selloff accelerates again. Break of 161.8% projection of 0.9196 to 0.8757 from 0.8854 at 0.8144 will target 200% projection at 0.7976 next. On the upside, above 0.8358 support turned resistance will turn intraday bias neutral and bring consolidations first, before staging another decline.
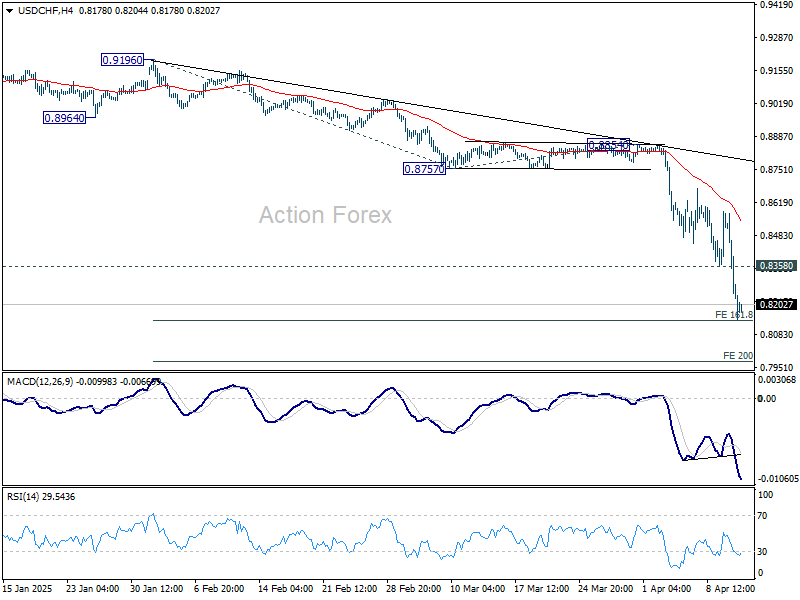
In the bigger picture, the break of 0.8332 (2023 low) confirms resumption of long term down trend from 1.0342 (2017 high). Next target is 61.8% projection of 1.0146 (2022 high) to 0.8332 from 0.9196 at 0.8075. Firm break there will target 100% projection at 0.7382.
Safe Havens Surge, Treasury Rout Deepens, US Assets Hit by Relentless Selloff
The brief moment of optimism following the US tariff truce has quickly faded, as financial markets buckle again under renewed pressure. US stocks closed sharply lower overnight, wiping out a large portion of Wednesday’s historic rebound. The risk-off tone spilled into Asia, though unevenly—Japan saw steep losses, Singapore posted moderate declines, while Hong Kong and China held relatively steady. Overall, the ongoing huge volatility suggests that global markets are far from stabilizing.
The trade war narrative has shifted into a far more dangerous phase. The US confirmed that tariffs on Chinese imports were immediately raised to 125% after China responded with an 84% rate of its own. That brings total US duties on Chinese goods to a staggering 145%. At these levels, the tariff figures themselves become much less relevant. The policy is signaling a structural decoupling of the world’s two largest economies.
Yet, the most alarming development is unfolding in the US Treasury market as 10-year yield surged past 4.45% mark again in Asian trading. This sharp reversal from the temporary calm after the US paused some reciprocal tariffs for 90 days is stoking fears of deeper structural issues in bond markets. This trouble in Treasuries has drawn comparisons to the 2020 “dash-for-cash” and the 2022 UK gilt crisis.
In the currency markets, the flight to safety is clear, just not into Dollar. Swiss Franc surged to its highest level against the greenback since 2015, while Euro and Yen also strengthened markedly. Altogether, markets appear to be undergoing a synchronized flush-out of US assets, with investors dumping stocks, Dollar, and even Treasuries.
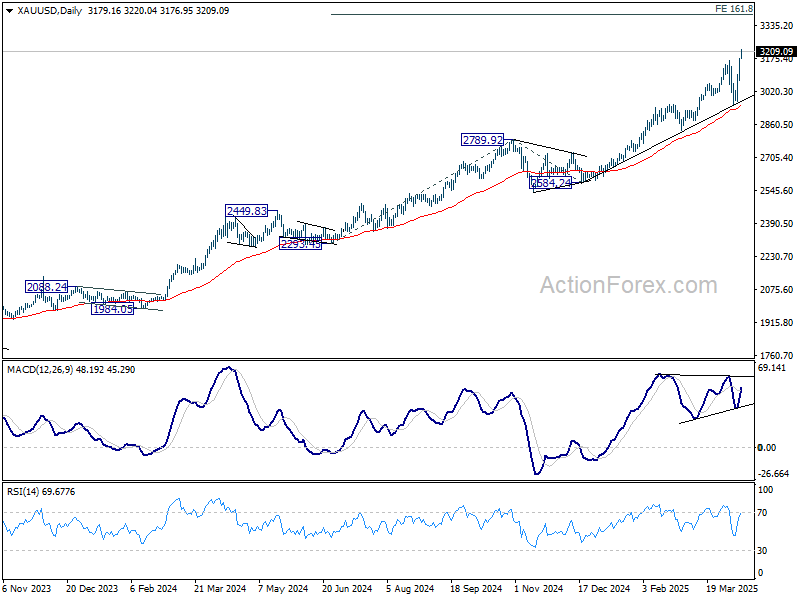
Technically, Gold defied gravity again and surged to new record high above 3200 market. For now, further rise is expected as long as 3103.02 support holds, or in short 3100 mark. Next target is 161.8% projection of 2293.45 to 2789.92 from 2584.24 at 3387.52.
In Asia, at the time of writing, Nikkei is down -4.36%. Hong Kong HSI is up 0.76%. China Shanghai SSE is up 0.32%. Singapore Strait Times is down 1.94%. Japan 10-year JGB yield is up 0.024 at 4.46. Overnight, DOW fell -2.50%. S&P 500 fell -3.46%. NASDAQ fell -4.31%. 10-year yield fell -0.006 to 4.394.
Fed’s Goolsbee: No playbook for tariff shock, rate path uncertain but likely lower
Speaking overnight, Chicago Fed President Austan Goolsbee said that nothing is "off the table", including rate hikes, cuts, or holds. The sheer scale of recent trade developments creates a stagflationary shock, and there is "not a generic playbook" for how a central bank should respond to.
Also, Goolsbee noted a key challenge: the data being released now may not yet fully reflect the evolving reality on the ground. That’s why he believes Fed must closely monitor both hard data and soft indicators, especially as lag effects complicate interpretation.
Despite the tariff-related uncertainty, Goolsbee still sees rates trending lower over the next one to two years. Nevertheless, he stressed that should long-run inflation expectations begin to drift, “any central bank almost has to address that… regardless of what the other conditions are.”
Fed’s Collins: Tariff-driven price pressures may delay further policy normalization
Boston Fed President Susan Collins said in a speech overnight that keep interest rate at current level is "appropriate for the time being" due to the "highly uncertain environment."
Collins acknowledged that "renewed price pressures" from tariffs could "delay further normalization of policy".
"Confidence is needed that the tariffs are not destabilizing inflation expectations," she emphasized.
She added that any "preemptive action" to support growth would require a “compelling” signal that economic activity is deteriorating more than expected.
Although she expects inflation to gradually return to the 2% target, she acknowledged that core inflation may rise “well above” 3% in the near term due to higher import costs. In her view, the Fed must remain vigilant to ensure these pressures do not become entrenched.
NZ BNZ manufacturing falls to 53.2, new orders signal trouble ahead
New Zealand’s BusinessNZ Performance of Manufacturing Index slipped slightly from 54.1 to 53.2 in March, but remained firmly in expansion territory. Production climbed to 54.2, the highest level since December 2021. Employment also posted a robust 54.7, marking its strongest result since mid-2021. However, a decline in new orders, which dipped below the 50-neutral mark to 49.6, raises concerns about the durability of this rebound.
BusinessNZ’s Catherine Beard acknowledged the resilience in activity and employment, but highlighted persistent challenges. Despite improving sentiment, nearly 58% of surveyed manufacturers cited negative conditions, pointing to weak demand, fewer new orders, and uncertainty across both domestic and export channels.
BNZ Senior Economist Doug Steel noted that the PMI data supports the case for manufacturing GDP growth in early 2025. Still, he cautioned that risks to the outlook are clearly tilted to the downside, "given recent extreme volatility on global markets following rapidly evolving US-driven trade policy changes."
USD/CHF Daily Outlook
Daily Pivots: (S1) 0.8120; (P) 0.8350; (R1) 0.8467; More…
Intraday bias in USD/CHF remains on the downside as current selloff accelerates again. Break of 161.8% projection of 0.9196 to 0.8757 from 0.8854 at 0.8144 will target 200% projection at 0.7976 next. On the upside, above 0.8358 support turned resistance will turn intraday bias neutral and bring consolidations first, before staging another decline.
In the bigger picture, the break of 0.8332 (2023 low) confirms resumption of long term down trend from 1.0342 (2017 high). Next target is 61.8% projection of 1.0146 (2022 high) to 0.8332 from 0.9196 at 0.8075. Firm break there will target 100% projection at 0.7382.
NZ BNZ manufacturing falls to 53.2, new orders signal trouble ahead
New Zealand’s BusinessNZ Performance of Manufacturing Index slipped slightly from 54.1 to 53.2 in March, but remained firmly in expansion territory. Production climbed to 54.2, the highest level since December 2021. Employment also posted a robust 54.7, marking its strongest result since mid-2021. However, a decline in new orders, which dipped below the 50-neutral mark to 49.6, raises concerns about the durability of this rebound.
BusinessNZ’s Catherine Beard acknowledged the resilience in activity and employment, but highlighted persistent challenges. Despite improving sentiment, nearly 58% of surveyed manufacturers cited negative conditions, pointing to weak demand, fewer new orders, and uncertainty across both domestic and export channels.
BNZ Senior Economist Doug Steel noted that the PMI data supports the case for manufacturing GDP growth in early 2025. Still, he cautioned that risks to the outlook are clearly tilted to the downside, "given recent extreme volatility on global markets following rapidly evolving US-driven trade policy changes."
USD/JPY Slips Further—Market Eyes Key Support Levels Ahead
Key Highlights
- USD/JPY started a fresh decline below the 146.50 level.
- A connecting bearish trend line is forming with resistance at 148.20 on the 4-hour chart.
- GBP/USD is again rising and might aim for gains above 1.3000.
- Gold prices could rally further and to a new record high above $3,150 level.
USD/JPY Technical Analysis
The US Dollar faced a strong rejection near 148.25 against the Japanese Yen. USD/JPY started a fresh decline below the 147.20 and 146.50 levels.
Looking at the 4-hour chart, the pair traded below the 50% Fib retracement level of the upward move from the 143.99 swing low to the 148.28 high. The pair is now below the 100 simple moving average (red, 4-hour) and the 200 simple moving average (green, 4-hour).
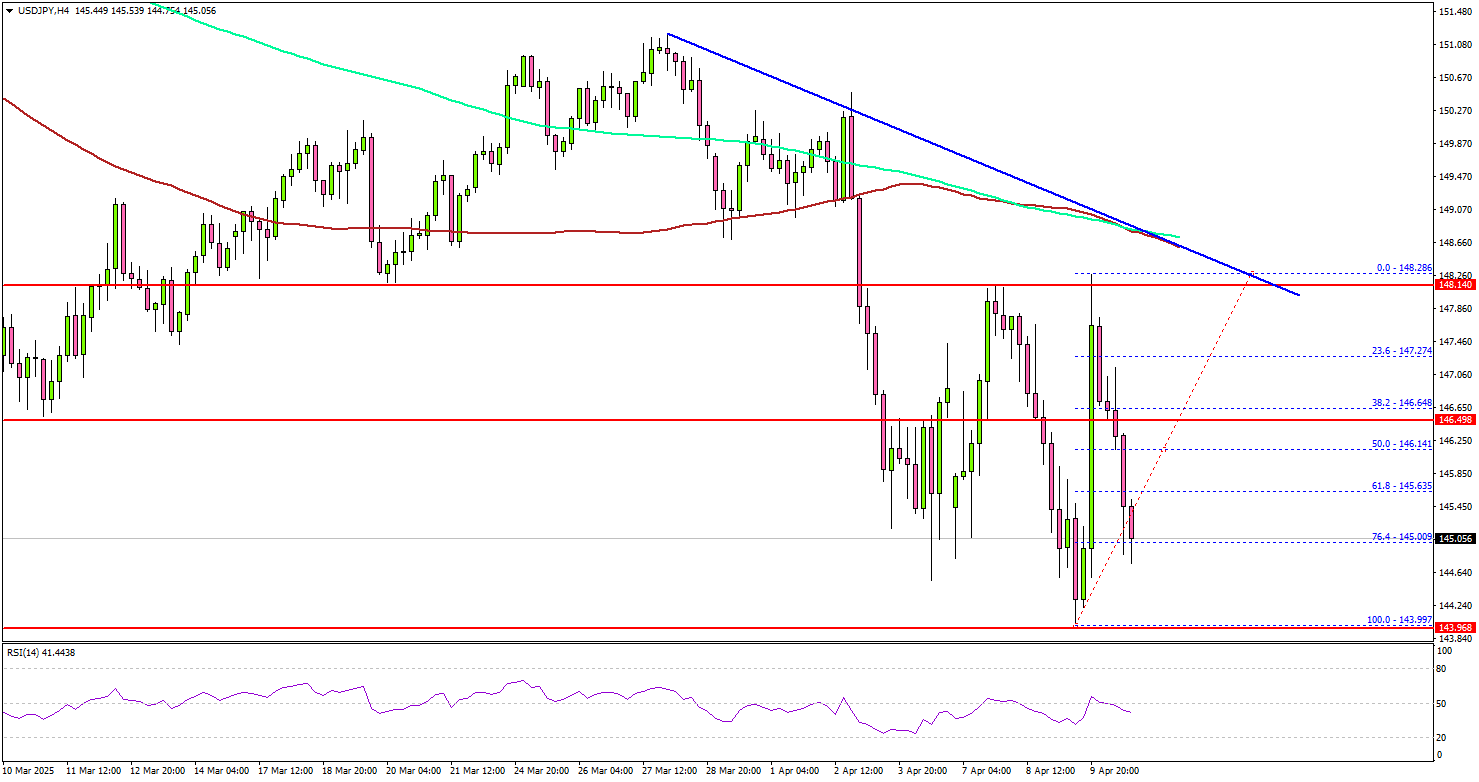
There is also a connecting bearish trend line forming with resistance at 148.20 on the same chart. If there is a fresh increase, the pair could face resistance near the 146.00 level.
The next major resistance is near the 146.50 level. The main resistance is now forming near the 148.20 zone. A close above the 148.20 level could set the tone for another increase. In the stated case, the pair could even clear the 149.50 resistance.
On the downside, immediate support sits near the 144.00 level. The next key support sits near the 143.65 level. Any more losses could send the pair toward the 142.50 level.
Looking at Gold, the price started a fresh increase, and the bulls might soon aim for a move toward the $3,200 level.
Upcoming Economic Events:
- US Producer Price Index for March 2025 (MoM) – Forecast +0.2%, versus 0% previous.
- US Producer Price Index for March 2025 (YoY) – Forecast +3.3%, versus +3.2% previous.
- Michigan Consumer Sentiment Index for April 2025 (Prelim) – Forecast 54.5, versus 57.0 previous.