
Sample Category Title
GBP/USD Mid-Day Outlook
Daily Pivots: (S1) 1.2841; (P) 1.2918; (R1) 1.3049; More...
Intraday bias in GBP/USD remains on the upside for retesting 1.3206. Firm break there will resume the rally from 1.2099 towards 1.3433 high. On the downside, below 1.2981 minor support will turn intraday bias neutral again first. While corrective pattern from 1.3206 might extend, near term outlook will stay bullish as long as 1.2706 support holds, in case of another dip.
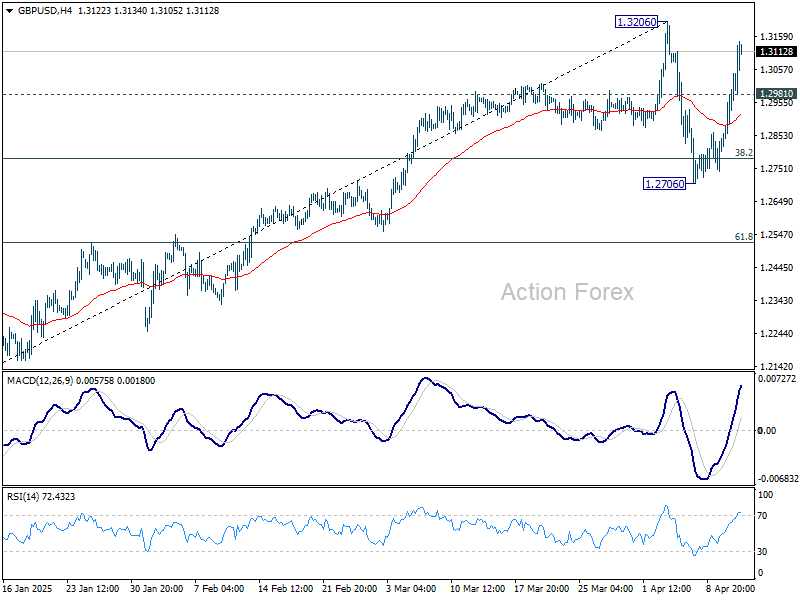
In the bigger picture, price actions from 1.3433 are seen as a corrective pattern to the up trend from 1.3051 (2022 low). Rise from 1.2099 could be the second leg. Overall, GBP/USD should target 1.4248 key resistance (2021 high) on break of 1.3433 at a later stage.
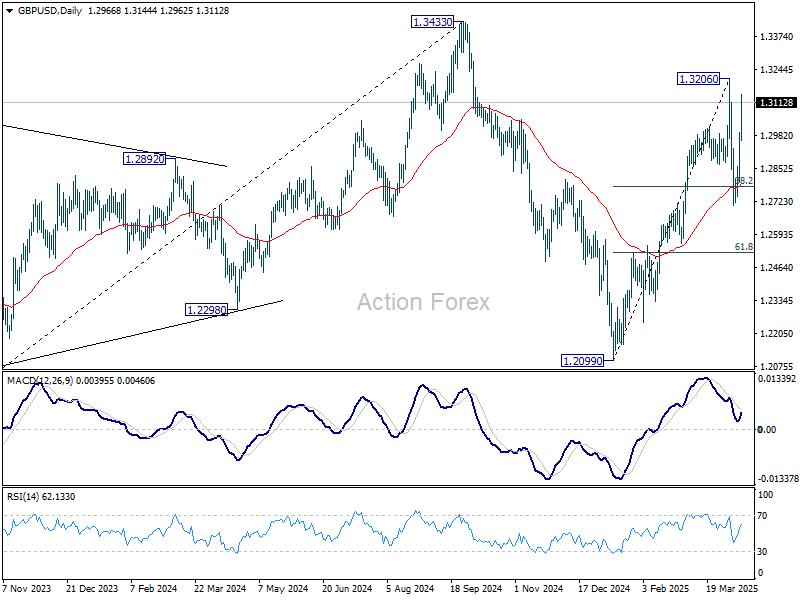
EUR/USD Mid-Day Outlook
Daily Pivots: (S1) 1.1016; (P) 1.1129; (R1) 1.1315; More...
EUR/USD's rally is still in progress and intraday bias stays on the upside. Current rise form 1.0176 should target 161.8% projection of 1.0358 to 1.0953 from 1.0731 at 1.1694. On the downside, below 1.1245 minor support will turn intraday bias neutral and bring consolidations. But downside should be contained well above 1.0912 support to bring another rally.
In the bigger picture, break of 1.1274 (2024 high) indicates resumption of whole up trend from 0.9534 (2022 low). Next target is 100% projection of 0.9534 to 1.1274 from 1.0176 at 1.1916. Also, that will send EUR/USD through the multi-decade channel resistance will carries larger bullish implication. This will now be the favored case as long as 55 D EMA (now at 1.0745) holds.
Dollar Selloff Extends Into Week’s End, Trade Talks With EU and JP Offset China Escalations
Financial markets showed signs of stabilization since European session, despite another round of retaliatory tariff hikes from China. While the latest move saw China raise levies on US goods to 125% from 84%, the response was widely anticipated and thus well absorbed by investors. Both President Donald Trump and President Xi Jinping have maintained uncompromising stances, so markets had largely priced in another step in the tit-for-tat trade war. The absence of any conciliatory tone keeps tensions high, but the predictability of the escalation appears to have dulled the market impact.
Also, China's latest move may have reached a symbolic peak. In a strongly worded statement, China’s finance ministry noted that at current tariff levels, “there is no longer a market for US goods imported into China,” implying that further retaliation may be economically futile. “If the U.S. government continues to increase tariffs on China, Beijing will ignore,” it added.
Some of the bearish sentiment from the US-China standoff is being offset by more constructive developments on other trade fronts. Negotiations between the US and both the European Union and Japan appear to be gaining traction. EU trade commissioner Maroš Šefčovič is scheduled to visit Washington on April 14 to meet US officials and continue discussions on tariff matters. Meanwhile, Japan’s newly formed task force, led by Economy Minister Ryosei Akazawa, is preparing for key meetings on April 17 with US Treasury and trade representatives.
Despite the stabilization in broader risk sentiment, Dollar continues to bleed, extending a week-long selloff and positioning itself as the worst performer among major currencies. Sterling is tracking as the second weakest despite a strong UK GDP report. Loonie follows closely behind, pressured by declining oil prices and general risk aversion.
Swiss Franc stands out as the week’s clear winner, underpinned by its status as the undisputed safe-haven, while Kiwi and Euro are also among the strongest performers. Aussie and Yen are positioning in the middle.
Eyes are now on the University of Michigan consumer sentiment report. Any significant surprises in that data could prompt a final reshuffling of currency rankings before markets settle for the weekend.
In Europe, at the time of writing, FTSE is up 0.50%. DAX is down -1.26%. CAC is down -0.45%. UK 10-year yield is up 0.048 at 4.699. Germany 10-year yield is down -0.067 at 2.516. Earlier in Asia, Nikkei fell -2.96%. Hong Kong HSI rose 1.13%. China Shanghai SSE rose 0.45%. Singapore Strait Times fell -1.83%. Japan 10-year JGB yield fell -0.031 to 1.346.
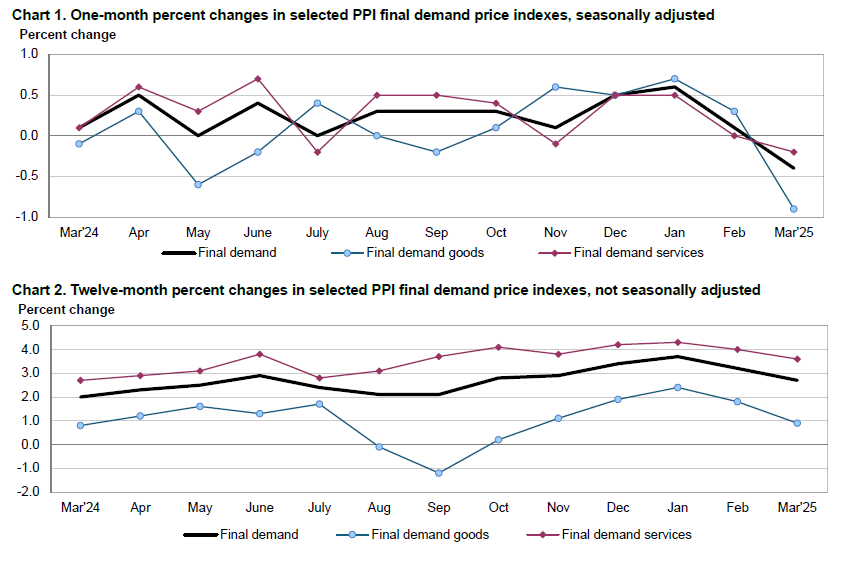
US PPI unexpectedly falls -0.3% mom in March
US producer prices posted a surprise decline in March, with the headline PPI for final demand falling -0.4% mom, well below expectations of a 0.2% mom rise.
The drop was driven largely by a -0.9% mom decline in final demand goods, while final demand services also slipped -0.2% mom.
On an annual basis, PPI slowed to 2.7% year-on-year from 3.2%, also below forecasts.
PPI excludes food, energy, and trade services, rose just 0.1% mom on the month, with the year-on-year rate at 3.4%.
EU’s Dombrovskis: Existing tariffs enough to shave up to 1.4% off US GDP, hit EU by 0.2%
EU Economy Commissioner Valdis Dombrovskis acknowledged the US decision to pause reciprocal tariffs above 10% for 90 days as a positive step that opens the door to negotiations. However, he cautioned that the existing 10% duties still in place on nearly all countries continue to weigh on the global economy. Additionally, the US has not lifted its 25% tariffs on steel, aluminum, cars, and car parts—measures that remain a significant source of transatlantic economic tension.
Dombrovskis pointed to a model simulations indicating that the current US tariff structure could reduce US GDP by 0.8% to 1.4% through 2027. While the economic fallout for the EU is expected to be milder—around 0.2% of GDP—he warned that the damage could escalate dramatically if tariffs become entrenched or retaliatory actions intensify.
Under such a worst-case scenario, Dombrovskis said US GDP could fall by as much as 3.3%, with the EU losing up to 0.6% and global GDP shrinking by 1.2%. The impact on global trade would be particularly severe, with an estimated contraction of 7.7% over the next three years.
UK GDP rises 0.5% mom in Feb, broad-based growth
The UK economy delivered a strong upside surprise in February, with GDP expanding by 0.5% mom, far exceeding market expectations of just 0.1% mom. All three major sectors contributed to the growth: services rose by 0.3% mom, production surged by 1.5% mom, and construction edged up 0.4% mom.
On a three-month rolling basis, real GDP grew by 0.6% to February 2025 compared to the previous three months, driven largely by a 0.6% rise in services output and a 0.7% gain in production. Construction, however, was flat over the period.
NZ BNZ manufacturing falls to 53.2, new orders signal trouble ahead
New Zealand’s BusinessNZ Performance of Manufacturing Index slipped slightly from 54.1 to 53.2 in March, but remained firmly in expansion territory. Production climbed to 54.2, the highest level since December 2021. Employment also posted a robust 54.7, marking its strongest result since mid-2021. However, a decline in new orders, which dipped below the 50-neutral mark to 49.6, raises concerns about the durability of this rebound.
BusinessNZ’s Catherine Beard acknowledged the resilience in activity and employment, but highlighted persistent challenges. Despite improving sentiment, nearly 58% of surveyed manufacturers cited negative conditions, pointing to weak demand, fewer new orders, and uncertainty across both domestic and export channels.
BNZ Senior Economist Doug Steel noted that the PMI data supports the case for manufacturing GDP growth in early 2025. Still, he cautioned that risks to the outlook are clearly tilted to the downside, "given recent extreme volatility on global markets following rapidly evolving US-driven trade policy changes."
EUR/USD Mid-Day Outlook
Daily Pivots: (S1) 1.1016; (P) 1.1129; (R1) 1.1315; More...
EUR/USD's rally is still in progress and intraday bias stays on the upside. Current rise form 1.0176 should target 161.8% projection of 1.0358 to 1.0953 from 1.0731 at 1.1694. On the downside, below 1.1245 minor support will turn intraday bias neutral and bring consolidations. But downside should be contained well above 1.0912 support to bring another rally.
In the bigger picture, break of 1.1274 (2024 high) indicates resumption of whole up trend from 0.9534 (2022 low). Next target is 100% projection of 0.9534 to 1.1274 from 1.0176 at 1.1916. Also, that will send EUR/USD through the multi-decade channel resistance will carries larger bullish implication. This will now be the favored case as long as 55 D EMA (now at 1.0745) holds.
US PPI unexpectedly falls -0.3% mom in March
US producer prices posted a surprise decline in March, with the headline PPI for final demand falling -0.4% mom, well below expectations of a 0.2% mom rise.
The drop was driven largely by a -0.9% mom decline in final demand goods, while final demand services also slipped -0.2% mom.
On an annual basis, PPI slowed to 2.7% year-on-year from 3.2%, also below forecasts.
PPI excludes food, energy, and trade services, rose just 0.1% mom on the month, with the year-on-year rate at 3.4%.
EU’s Dombrovskis: Existing tariffs enough to shave Up to 1.4% off US GDP, hit EU by 0.2%
EU Economy Commissioner Valdis Dombrovskis acknowledged the US decision to pause reciprocal tariffs above 10% for 90 days as a positive step that opens the door to negotiations. However, he cautioned that the existing 10% duties still in place on nearly all countries continue to weigh on the global economy. Additionally, the US has not lifted its 25% tariffs on steel, aluminum, cars, and car parts—measures that remain a significant source of transatlantic economic tension.
Dombrovskis pointed to a model simulations indicating that the current US tariff structure could reduce US GDP by 0.8% to 1.4% through 2027. While the economic fallout for the EU is expected to be milder—around 0.2% of GDP—he warned that the damage could escalate dramatically if tariffs become entrenched or retaliatory actions intensify.
Under such a worst-case scenario, Dombrovskis said US GDP could fall by as much as 3.3%, with the EU losing up to 0.6% and global GDP shrinking by 1.2%. The impact on global trade would be particularly severe, with an estimated contraction of 7.7% over the next three years.
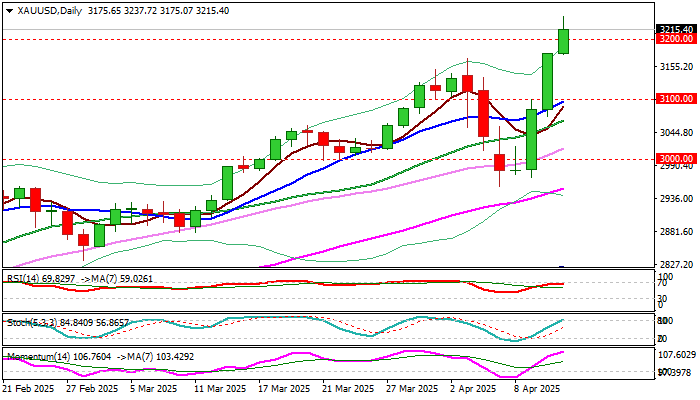
XAU/USD: Gold Rises Above $3.200 on Trade War Escalation
Gold surged above $3200 and hit multiple record highs on Friday, fueled by fresh rise in safe haven demand on growing worries over escalation of trade war and weaker dollar.
The latest decision of President Trump to put all tariffs on hold for 90 days but to exclude China from the deal and to increase import duties on Chinese goods to 125%, shook the world on Thursday, while China’s counter measures with the same rate of tariffs, sent fresh shockwaves through global markets on Friday.
Gold was the top market performer on Friday, along with other safe haven assets, such as Swiss franc and Japanese yen.
Mounting fears about the magnitude of the impact from intensifying trade conflict between the US and China, raise risk of recession and is likely to continue to fuel demand for the yellow metal.
The price may accelerate towards $3500 zone in coming months if two sides do not reach agreement.
Mild correction should be expected in the near term as a result of partial profit taking from strong rally in past three days, with limited dips to provide better levels for renewed entry into bullish market.
Broken psychological level at $3200 reverted to initial support, followed by former top $3167, which should ideally contain dips.
Fibo projections of the upleg from $2956 mark net targets at $3248, $3273 and $3298.
Res: 3237; 3248; 3273; 3298.
Sup: 3200; 3175; 3167; 3136.
Crypto Helped by Dollar Weakness
Market Picture
Crypto market capitalisation remained at $2.59 trillion on Friday morning, in line with the previous day’s values, despite a dip to $2.50 trillion overnight and a subsequent recovery on Friday morning. This contrasts with the slide in stock indices because a falling dollar supports cryptocurrencies. Like a rising tide, the dollar’s decline is lifting other assets.
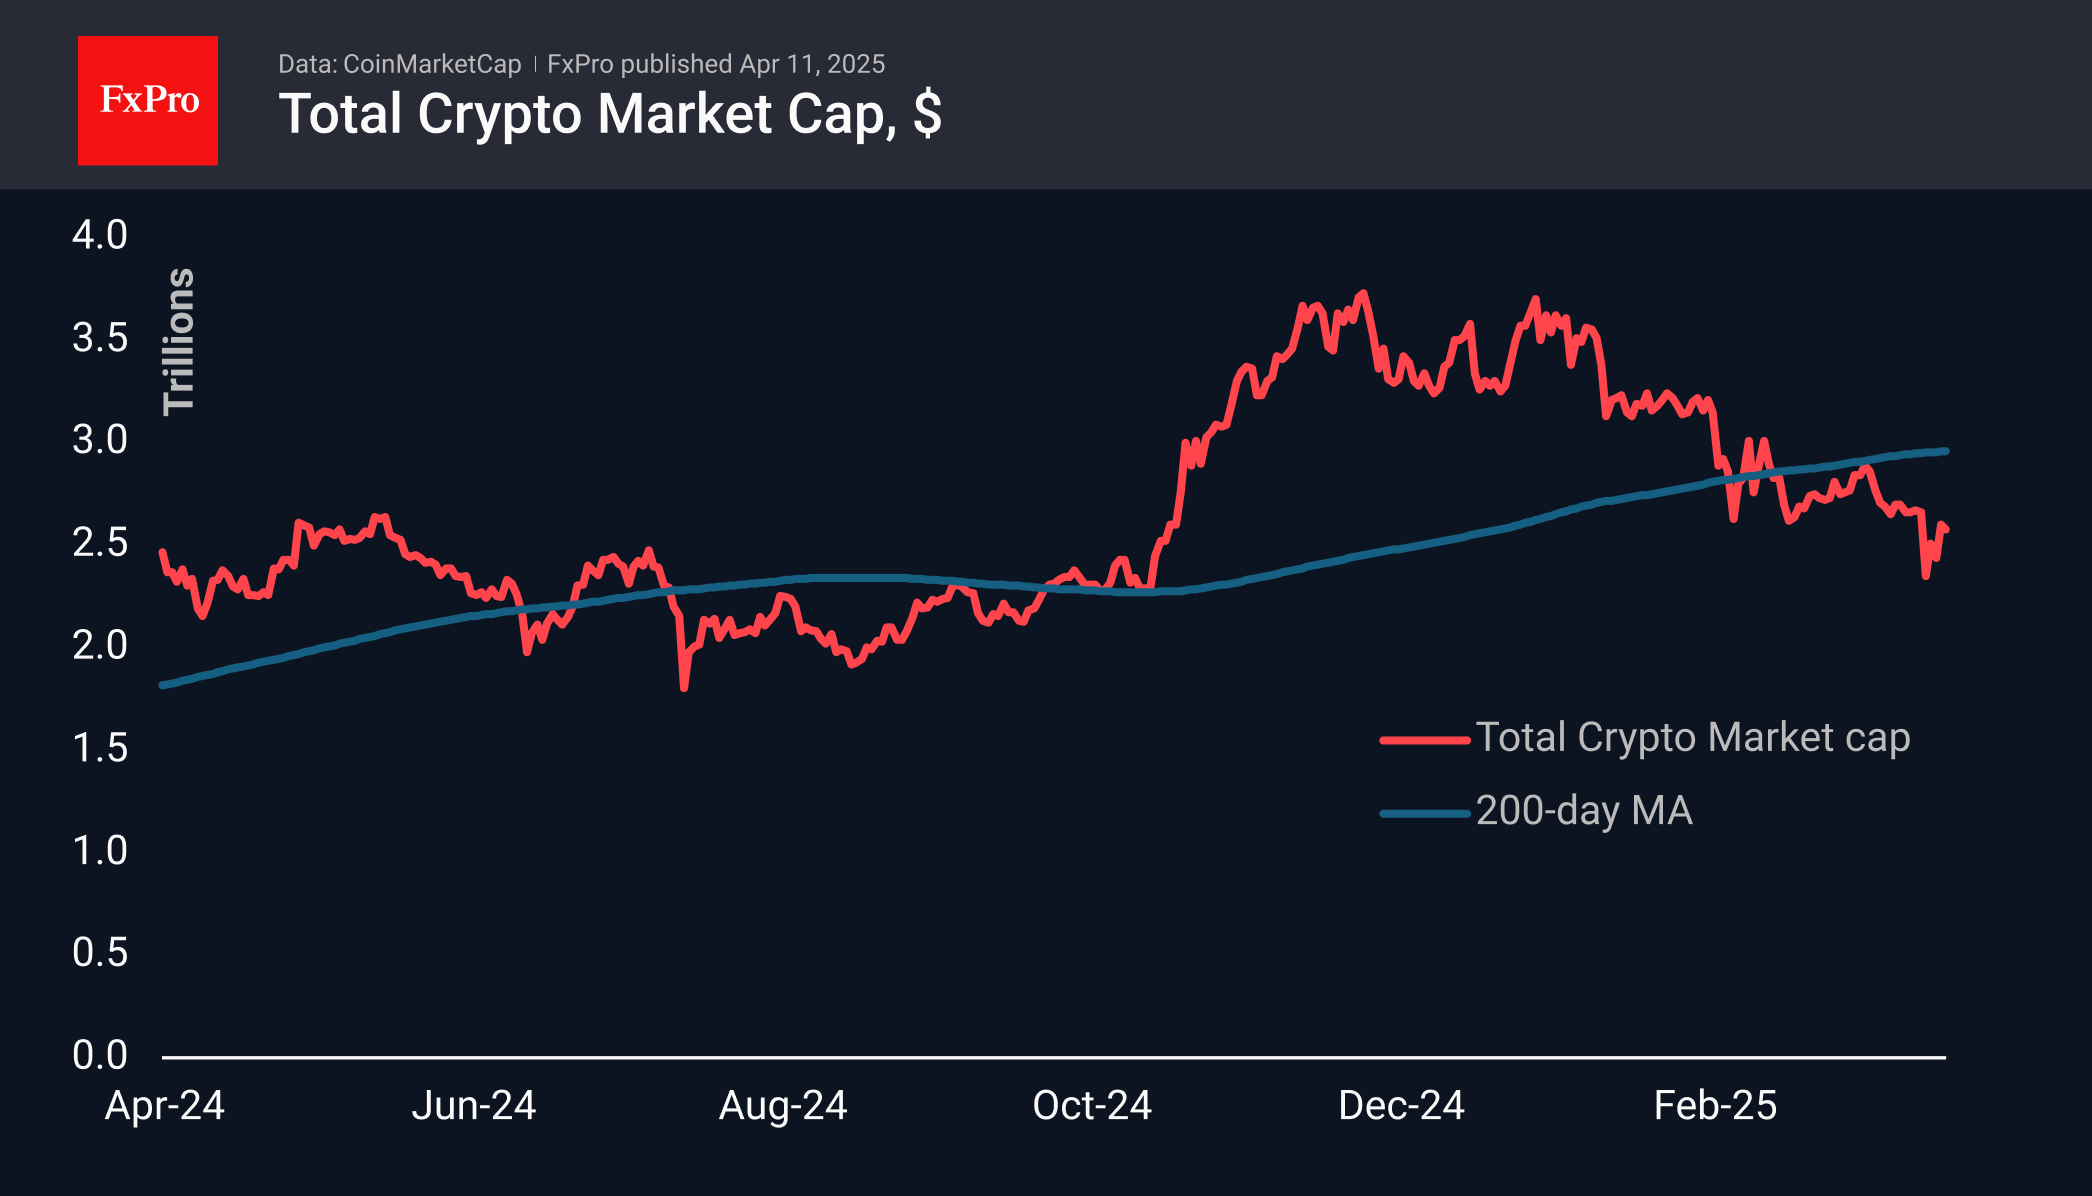
Sentiment in the crypto market has returned to the extreme fear zone, sending the index to the 25 level.
Bitcoin has been rising since early Friday, climbing above $81.4K, after closing just below $80K on Thursday. However, the first cryptocurrency has yet to confirm a growth reversal. The key area along the way is the $85K level, where the 50-day moving average passes. Its overcoming will be an important confirmation of the bullish sentiment, while fluctuations below it will remain market noise.
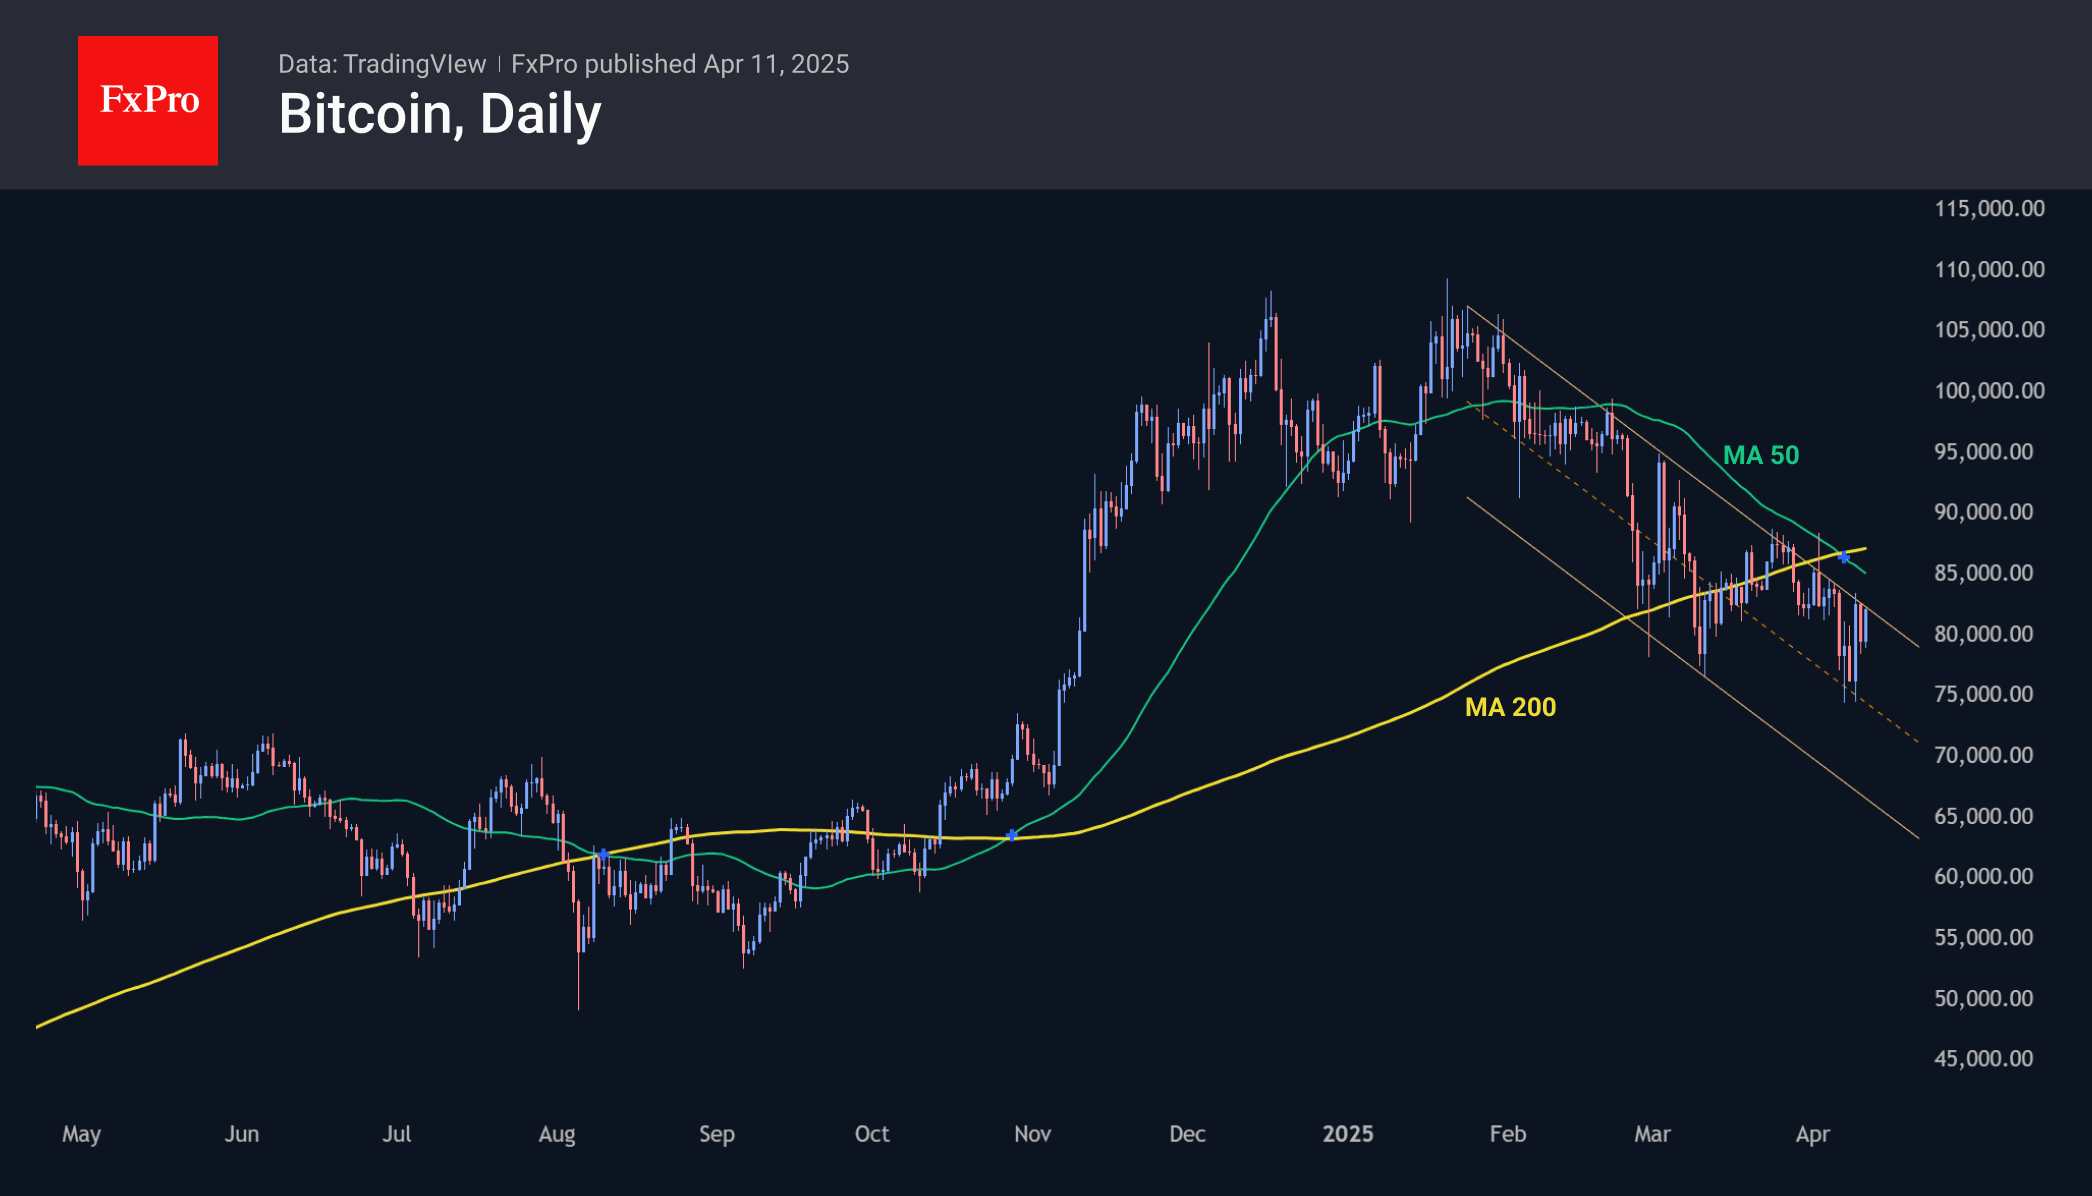
XRP and Tron found support this week on the decline to the 200-day moving averages. This small but encouraging signal suggests that market participants are still adhering to a ‘buy on dips’ strategy, believing in the continuation of the bullish trend.
News Background
A combination of on-chain metrics and technical indicators point to the need for Bitcoin to return above $93K to regain upward momentum, Glassnode noted. The correction has intensified selling by medium-term holdings, but their activity is slowing.
New Bitcoin sell-offs are possible in the coming weeks, but the bear market is likely to start in September, according to ‘il Capo of Crypto’. The analyst attributes this to the expected process of ‘global economic reset’, which may be accompanied by a major crisis – the first in BTC history.
The US Senate has approved the nomination of Paul Atkins to the post of SEC chairman. He is expected to focus on developing permanent standards for the regulation of digital assets.
The SEC authorised the listing and trading of options on spot Ethereum-ETFs from BlackRock, Bitwise and Grayscale. In September, the regulator already gave a similar authorisation for derivatives based on BTC-ETFs.
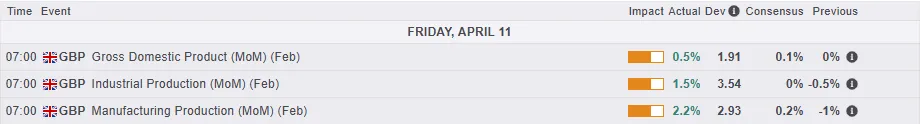
GBP/USD Peaks Above 1.3000 on UK GDP Beat, DXY Breaks Psychological 100.00 Barrier
- UK GDP grew by 0.5% in February 2025, exceeding forecasts and showing the strongest growth in 11 months.
- The US Dollar Index (DXY) fell significantly, reaching July 2023 lows.
- GBP/USD broke above the 1.3000 handle due to US Dollar weakness, with potential further gains depending on US dollar and tariff developments and upcoming UK data.
UK GDP was released this morning and showed the British economy grew by 0.5% in February 2025, bouncing back from a flat performance in January and beating forecasts of a 0.1% rise. This was the strongest growth in 11 months.
Industrial production jumped 1.5%, recovering from a 0.5% drop in January, thanks to a 2.2% increase in manufacturing. Notably, production of computers, electronics, and optical products rose sharply by 9.8%, while pharmaceuticals grew by 4.4%. Utilities went up by 2%, but mining fell by 3%.
The services sector grew by 0.3% after a 0.1% gain in January, driven by computer programming (up 2%), telecommunications (up 3.5%), and publishing (up 6.4%). Construction increased by 0.4%, bouncing back from a 0.3% drop, led by public works and repairs.
Looking at the quarter ending in January, the economy expanded by 0.6%.
For all market-moving economic releases and events, see the MarketPulse Economic Calendar.
UK GDP - more noise than substance?
Monthly GDP data can be more noise than an accurate indicator. Last year, two strong months made up most of the growth in 2024, which seems unrealistic.
That said, the latest figures suggest there might be too much pessimism about the near-term outlook. Tariffs are a challenge, but their impact on UK producers is less direct. Instead, they could affect the UK through their effect on the US economy.
If US demand drops, it will eventually impact the UK. However, for now, the UK government’s big spending increase this year might provide some stability. Despite talk of spending cuts, real departmental spending is set to rise by 4% next year. Much of this will go towards wages, which should help support the economy.
Next week is a big week for the UK, with wage data and inflation data on the agenda. Jobs data will be key in the coming months and next week will provide market participants with another glimpse at the data.
In response to the data, the UK Chancellor of the Exchequer called the GDP data ‘encouraging’. The response from markets saw traders trim BoE bets after the data, with 85bps more cuts expected in 2025.
US Dollar Index (DXY) hits 2023 lows
US Dollar Index (DXY) Daily Chart, April 11, 2025
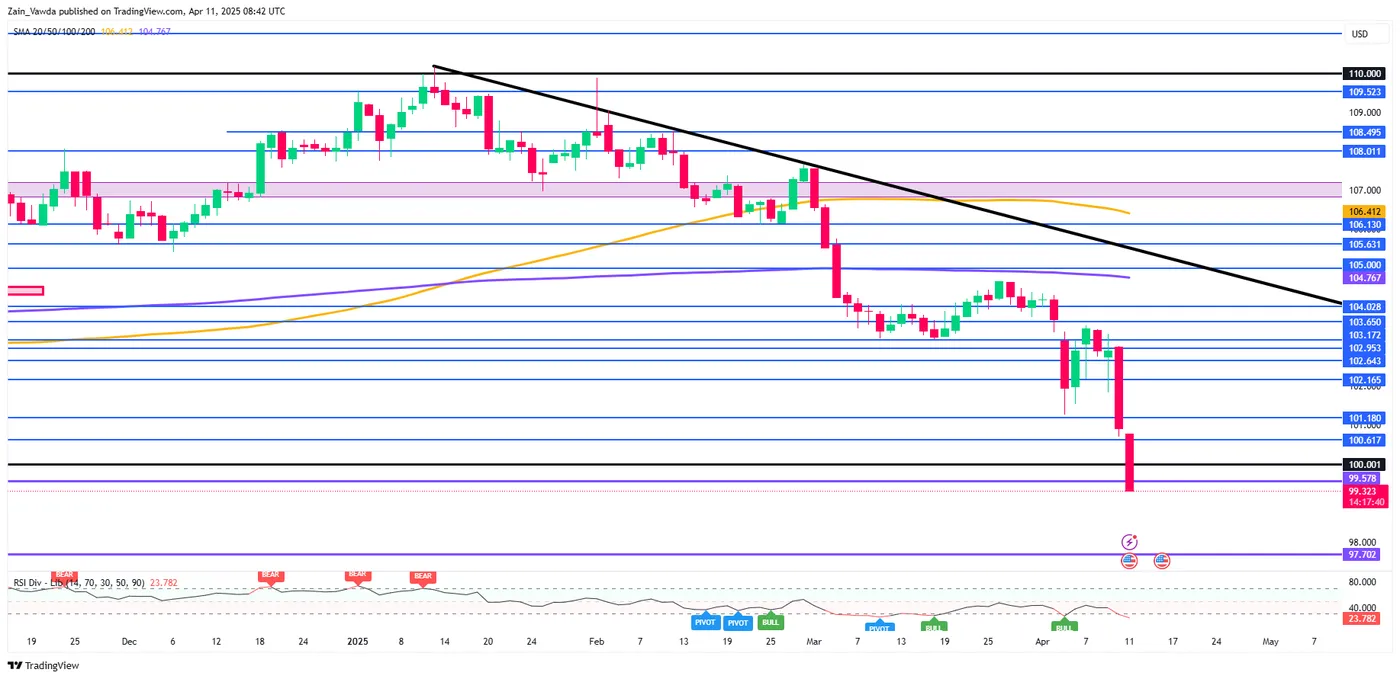
Source: TradingView
The dollar continued its fall on Friday as worries about the U.S. economy led investors to move away from U.S. assets and put their money into safer options like the Swiss franc, yen, euro, and gold.
The DXY sank as much 1.45% trading at a low of 99.44 which is a July 2023 low. This has seen a host of currencies gain ground against the Greenback with Cable being no exception.
Technical Analysis - GBP/USD
GBP/USD has been on a tear since the Monday low around the 1.2700 handle.
The move has largely been facilitated by US Dollar weakness rather than GBP strength and that has continued today as the DXY breached the psychological 100.00 barrier.
The weakness in the US Dollar has allowed GBP/USD to break above the 130.00 handle with the 2025 highs now in sight.
Further bullish moves may largely depend on the US dollar and tariff developments as markets wait on UK data next week.
Immediate resistance rests at previous highs around the 1.3200 handle, with the 1.3250 and 1.3400 levels up next.
A pullback for cable will bring the 1.3000 level back into focus before the 1.2864 and 1.2700 handles come into focus.
GBP/USD Daily Chart, April 11, 2025
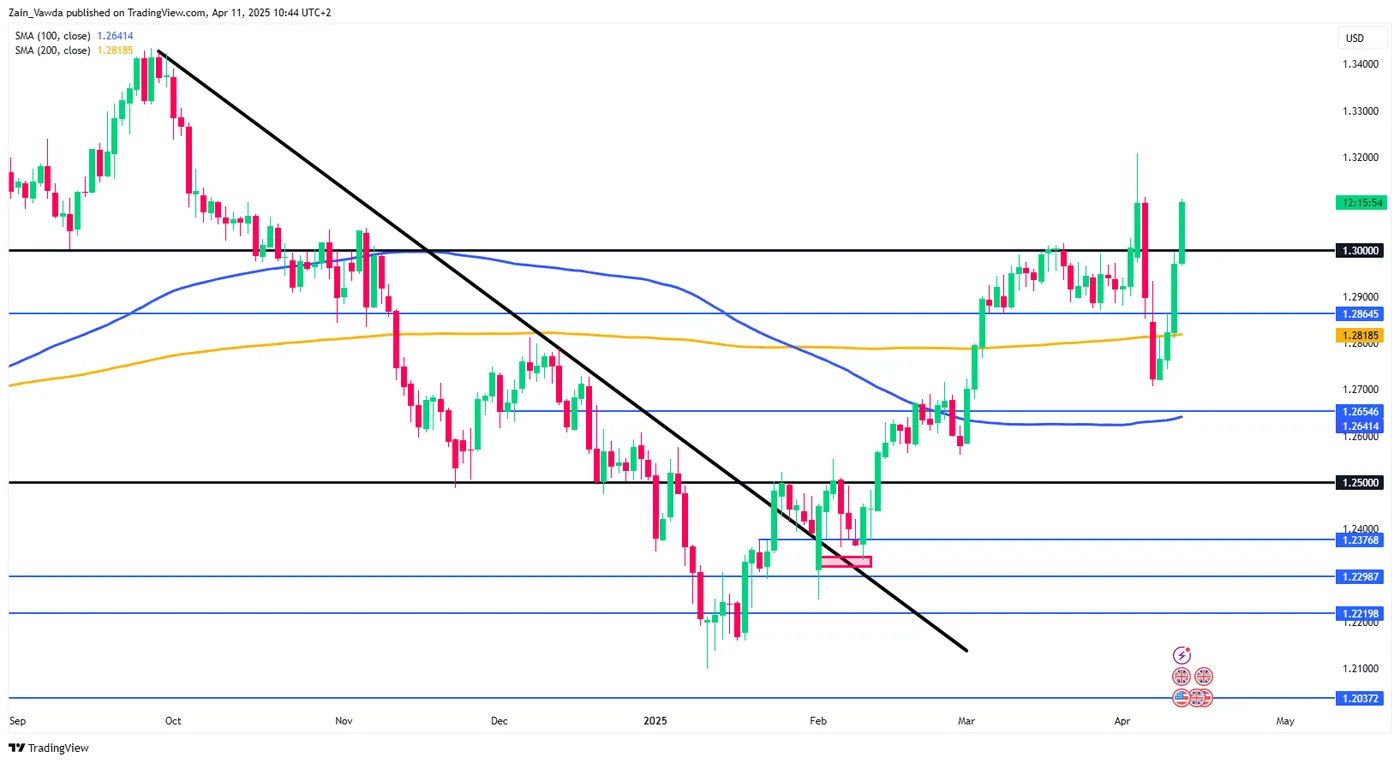
Source: TradingView.com
Support
- 1.3000
- 1.2864
- 1.2700
Resistance
- 1.3200
- 1.3250
- 1.3400
EUR/USD Hits Three-Year High as the US Dollar Suffers Heavy Losses
The EUR/USD pair is in strong demand, surging to a three-year peak near 1.1330.
Key factors driving EUR/USD Movements
The market remains highly sensitive to growing investor concerns over the US economic outlook. Declining confidence in US assets continues to weigh on the USD.
Fears persist over the potential fallout from Donald Trump’s tariff policies. Although the imposition of steep tariffs has been delayed by 90 days, concerns about a slowdown in economic activity remain acute.
Current tariffs on Chinese goods stand at 145%, escalating trade tensions between the US and China and further dampening market sentiment. Meanwhile, the European Union has opted to suspend its retaliatory measures for the same 90-day period, with negotiators seeking a compromise.
The US dollar came under further pressure following the latest inflation data. The core consumer price index (CPI) rose by 2.8% year-on-year in March – the slowest pace since spring 2021. These figures have reinforced expectations of an imminent Federal Reserve rate cut.
Technical Analysis: EUR/USD
H4 Chart Outlook
- The pair found support at 1.1155 before rallying to 1.1380
- A correction towards 1.1155 is possible in the near term
- Once this pullback concludes, another upside move towards 1.1400 may follow, marking the end of the current bullish wave
- This scenario is supported by the MACD indicator, with its signal line above zero and pointing firmly upwards
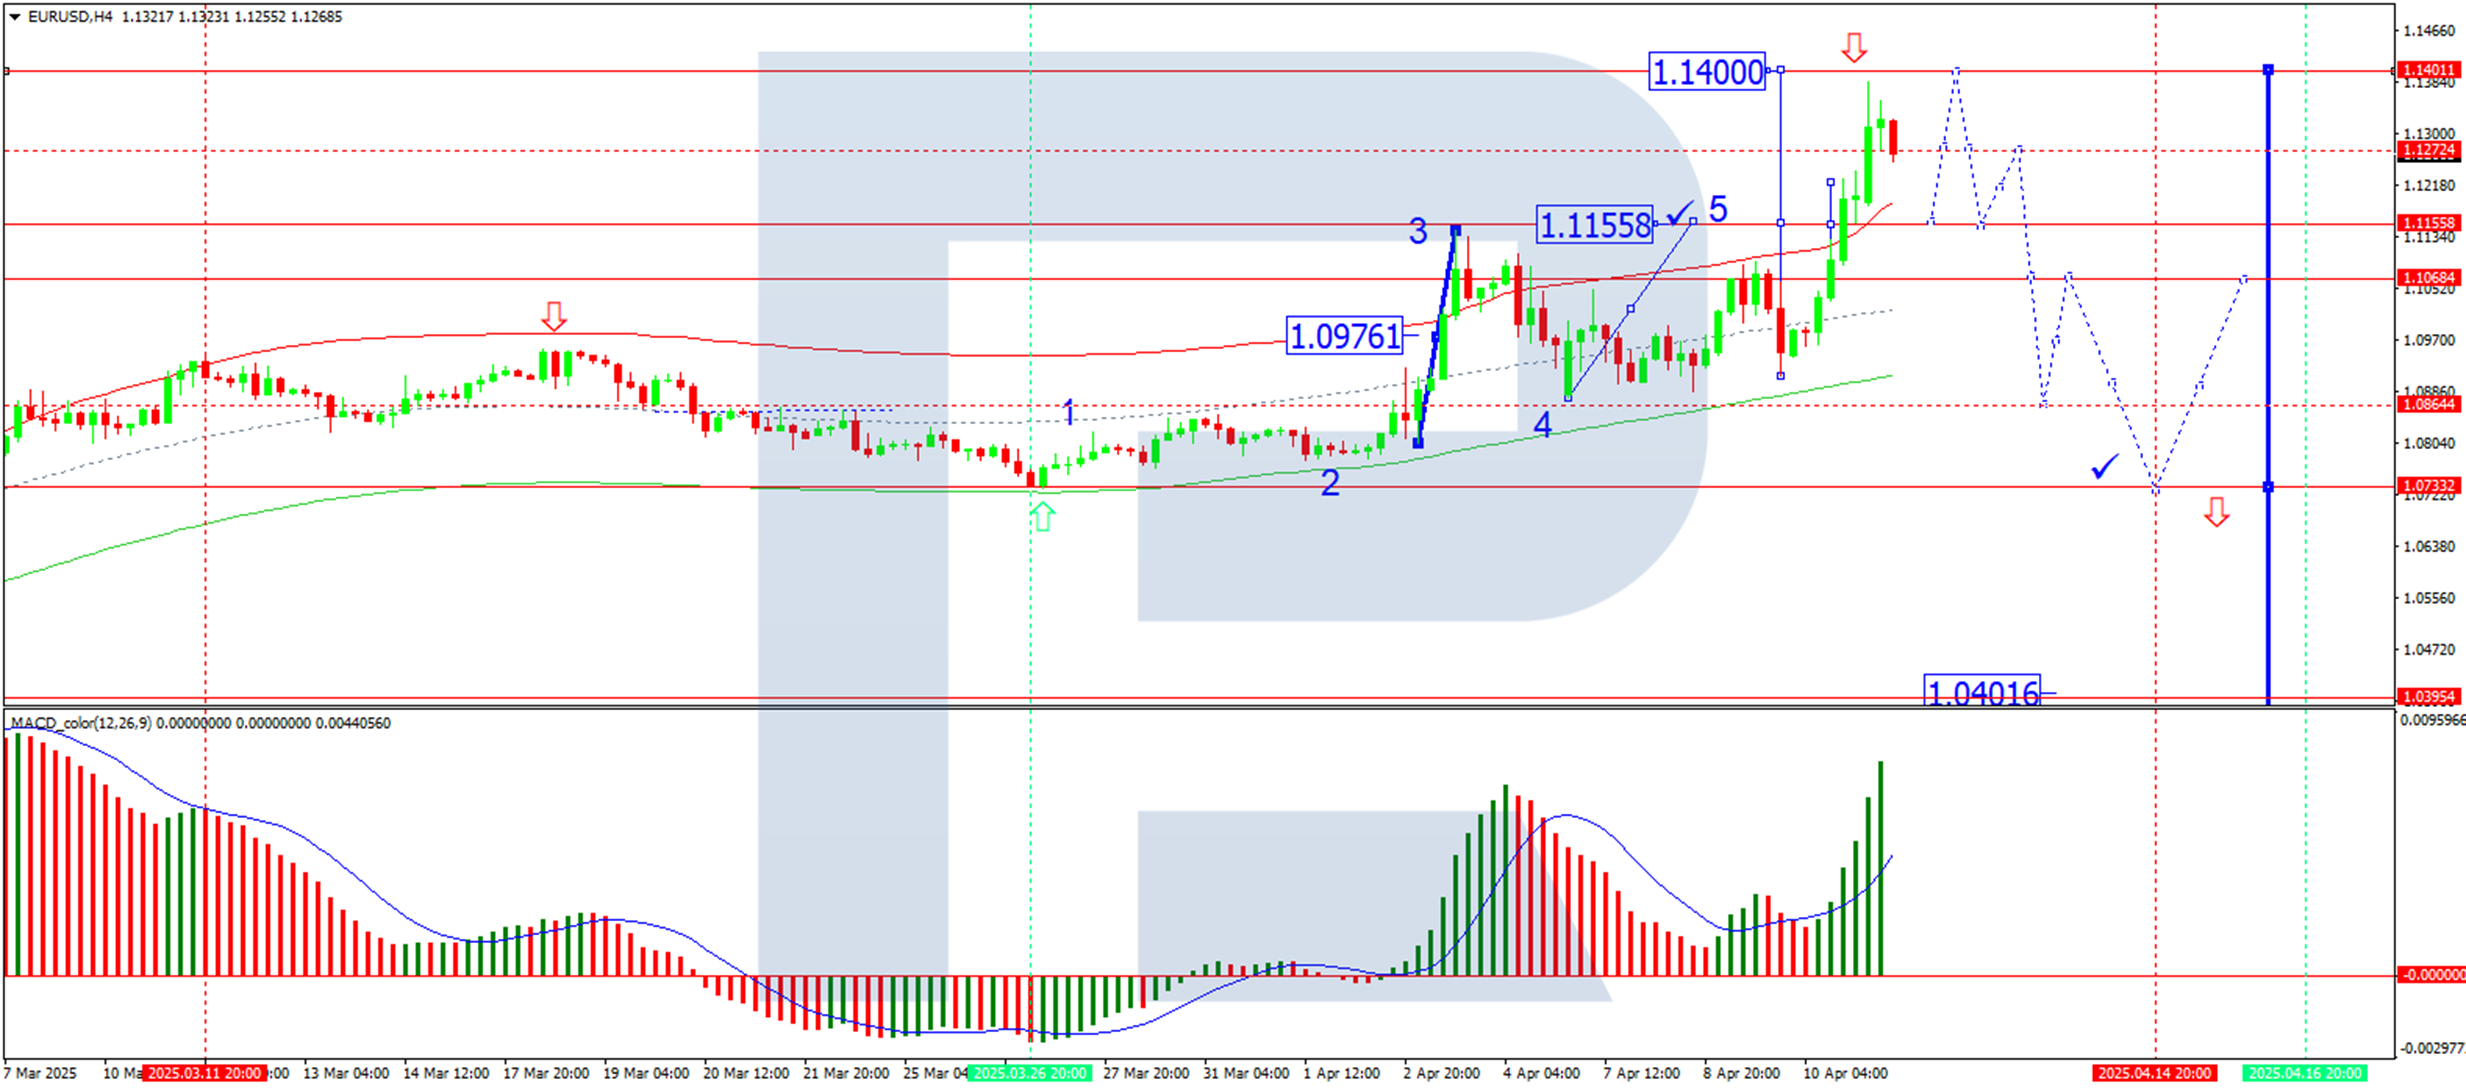
H1 Chart Outlook
- The market has achieved its local bullish target at 1.1380
- A corrective phase is forming, with 1.1155 as the next key level
- A rebound towards 1.1400 could occur later today, but a subsequent decline to 1.0900 could then come into play
- The Stochastic oscillator aligns with this view, as its signal line sits below 50 and is trending downwards towards 20
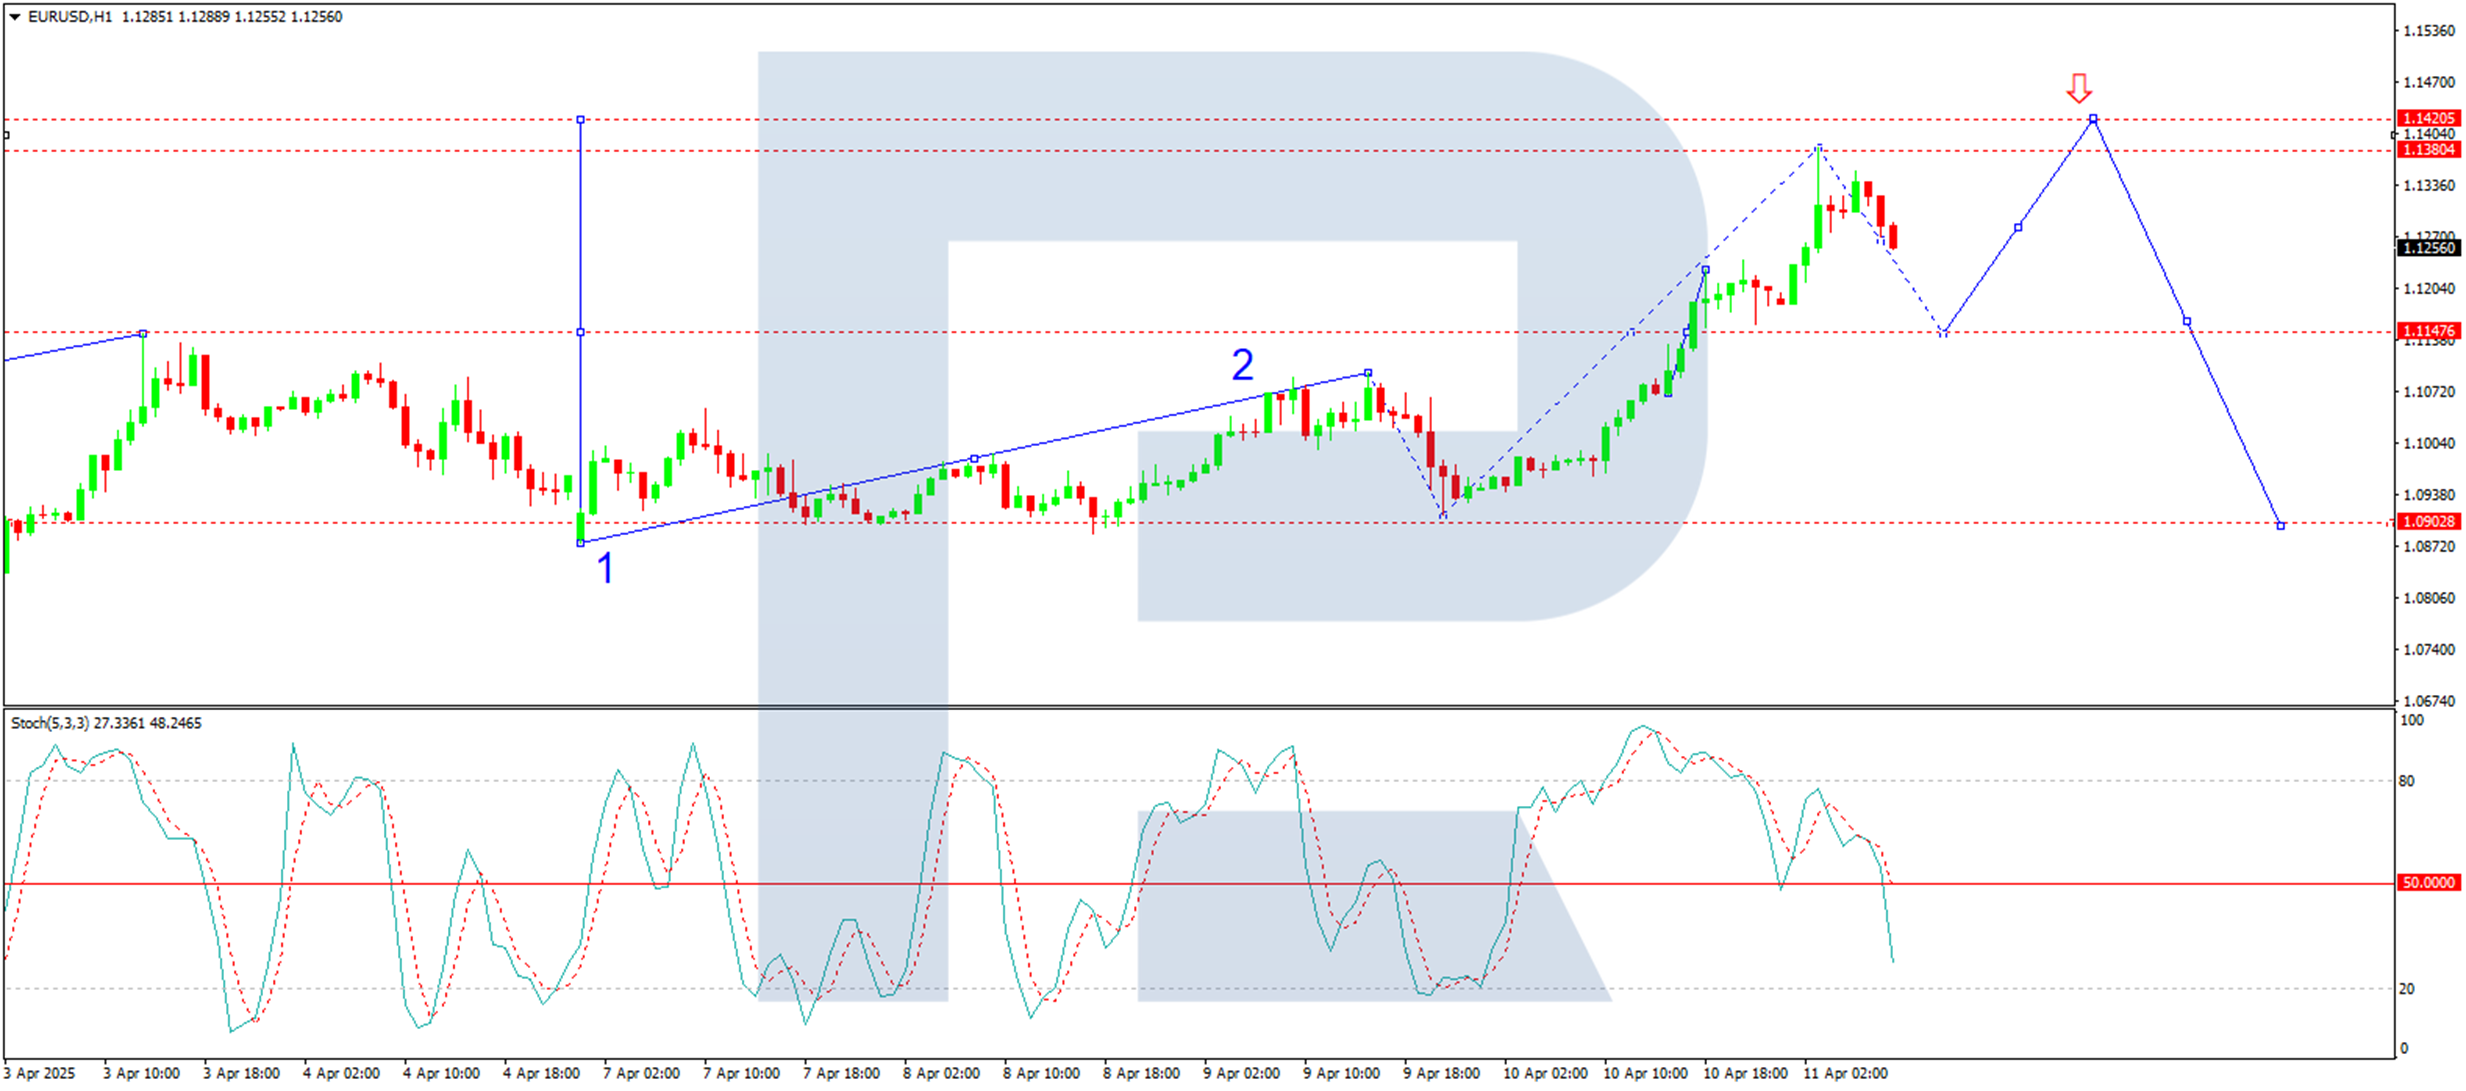
Conclusion
The EUR/USD rally reflects broad USD weakness, driven by economic concerns, trade tensions, and softening inflation. While a short-term correction is likely, the pair could extend gains towards 1.1400 before a deeper pullback materialises.
EUR/USD Hits Highest Level in Over Three Years
This morning, the euro surged above the 1.3000 mark against the US dollar for the first time since February 2022.
Throughout this week, the EUR/USD pair has broken through the highs of both 2023 and 2024.
Why Is EUR/USD Rising?
Amid the whirlwind of news surrounding the imposition and suspension of tariffs in US–EU trade, one dominant factor stands out — the sell-off of US bonds.
According to Reuters, long-term US Treasury bonds are being heavily sold this week. The yield on 10-year notes has jumped from 3.9% to around 4.4%, marking the steepest increase in yields since 2001. This may reflect a reaction by foreign holders of US debt to sanctions imposed by the White House, combined with growing uncertainty about the US economy — especially as recession fears gain more media attention.
As a result, the US dollar is showing weakness against a range of currencies, including the Japanese yen, Swiss franc, and the euro.
Technical Analysis of EUR/USD
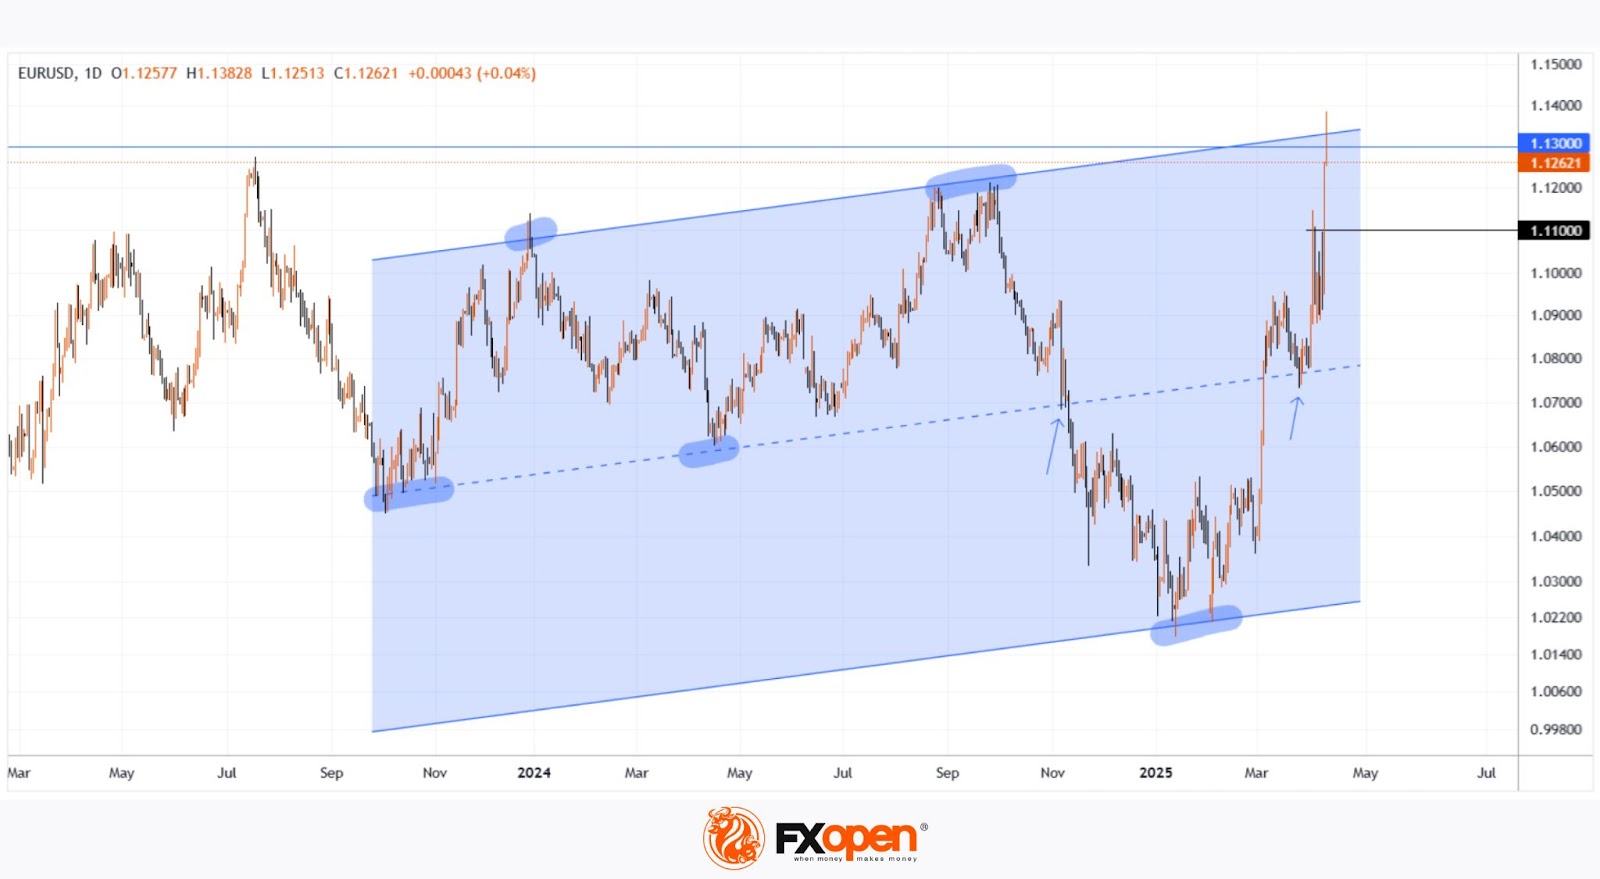
The chart reveals a clear ascending channel (marked in blue), with the price repeatedly interacting with its upper, lower, and median boundaries — highlighted with markers and arrows.
Current bullish sentiment has pushed the pair towards the upper boundary of this channel. It’s possible this resistance line could halt further gains, potentially leading to a correction — perhaps down to the 1.11 level, which previously acted as a strong resistance point.
Trade over 50 forex markets 24 hours a day with FXOpen. Take advantage of low commissions, deep liquidity, and spreads from 0.0 pips. Open your FXOpen account now or learn more about trading forex with FXOpen.
This article represents the opinion of the Companies operating under the FXOpen brand only. It is not to be construed as an offer, solicitation, or recommendation with respect to products and services provided by the Companies operating under the FXOpen brand, nor is it to be considered financial advice.