Sample Category Title
Gold Price Surpasses $3,200 for the First Time in History
According to the XAU/USD chart today, the price of an ounce of gold is fluctuating above the $3,200 level on global exchanges — a level never reached before.
Since the beginning of 2025, gold has gained approximately 22%.
Why Is Gold Rising Today?
Today’s bullish momentum in the gold market is driven by two key factors.
First, inflation data. Figures released yesterday for the CPI (Consumer Price Index) revealed a slowdown in inflation in the United States. This suggests a greater likelihood of monetary policy easing by the Federal Reserve. According to Reuters, gold prices now reflect expectations of three interest rate cuts by the end of 2025 — and lower rates typically support a stronger XAU/USD.
Second, fears of a global recession. Although US President Donald Trump has introduced a 90-day delay on the implementation of international trade tariffs, this does not apply to China, where tariffs have been increased to a striking 145%. Traders fear that Beijing could retaliate by raising tariffs on US goods beyond the current 84%.
Technical Analysis of XAU/USD
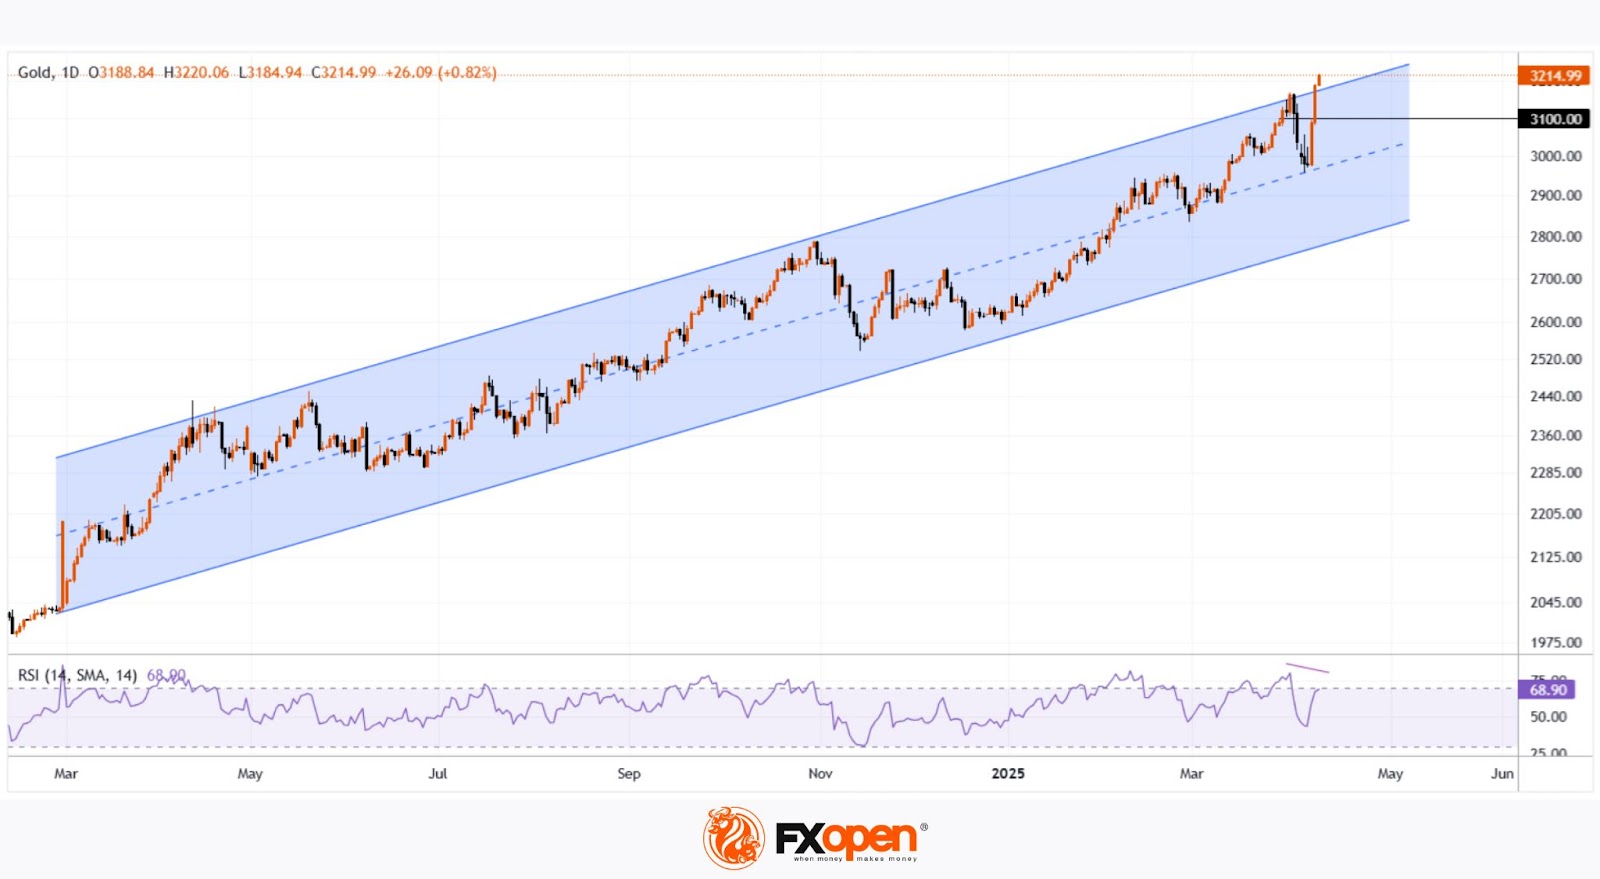
At present, the gold market is showing strong upward momentum, which began in early March (as illustrated by the blue trend channel). Key points include:
→ A breakout above the upper boundary of the channel;
→ The RSI indicator suggests a potential bearish divergence forming.
This points to the possibility of a short-term pullback into the blue channel, which would be a natural correction — especially considering the rapid $200 surge from $3,000 to $3,200 over just two days. However, given the current news backdrop, it seems unlikely that the bulls will relinquish control anytime soon.
For long-term gold price forecasts → read the article: Analytical Gold Price Predictions for 2025 and Beyond.
Start trading commodity CFDs with tight spreads. Open your trading account now or learn more about trading commodity CFDs with FXOpen.
This article represents the opinion of the Companies operating under the FXOpen brand only. It is not to be construed as an offer, solicitation, or recommendation with respect to products and services provided by the Companies operating under the FXOpen brand, nor is it to be considered financial advice.
We Don’t fight the Sell America Trade, Not in Treasuries and Not in Dollar.
Markets
US President Trump on Wednesday announcing a pause in the roll-out of reciprocal tariffs beyond the 10% base rate (expect for China) apparently wasn’t the game changer and confidence reset that the government hoped for. Yesterday’s price action indicated instead investors took it as an opportunity to sell America on up-ticks. US equities fell prey to a substantial retracement on Wednesday’s historic rebound (Nasdaq -4.31%). Developments in the US Treasury market are even far more worrisome. Softer than expected US March CPI inflation were only a footnote. The US yield curve again steepened. The 2-y easing 4.6 bps was no more than technical trading, assessing ongoing Fed guidance that the stagflationary impact of tariffs is a reason to stay on hold for longer. However, red alert is still flashing at the very long end of the US Treasury curve. The closely watched 30-y US Treasury Auction showed decent bidding metrics. So far the good news. The auction however, in no way was able to arrest the intraday slide in US long bonds. In the end, the 30-y yield again added 13.75 bps. Also remarkable: the rise was driven by a sharp move in the real yield. In the current environment, this suggests a higher risk premium, rather than anything else. Even more striking. The divergence with the performance of German Bunds couldn’t have been bigger. ST German yields rise marginally (a limited easing of ECB rate cut bets), but as the day proceeded, the Bund contract soon captured a solid safe haven bid. The 10-y yield more than fully reversed the rise at the open to close even 1.1 bp lower. Investors looking for a new safe haven alternative in German Bunds? Something to watch out for. Even so, the underperformance of Treasuries/outperformance of Bunds is currently going hand-in-hand with aggressive USD selling and a strong outperformance of the euro. With the yen (USD/JPY 143.5 area) and the Swiss franc (EUR/CHF 0.927) also attracting safe haven buying interest. Red alert also in the DXY index (100.4). The 2023/2024 lows (99.6/101.15) are already under test. A break of 98.98 (62% retracement of 2021/2022 rise) would signal a further sharp deterioration. Similar narrative for EUR/USD. EUR/USD 1.1276 (2023 top) is at risk of breaking. Another indication of the sell-Amerika on (quasi non-existing) upticks.
Risk sentiment in Asia this morning remains fragile (Nikkei -3.6%). The dollar and US treasuries struggle to avoid further losses. Regarding the data, University of Michigan consumer confidence will be closely watched. Another jump in inflation expectations (already expected at 5.2% 1-y ahead and at 4.3% for 5-10 y) would give (US Treasury) investors a highly uncomfortable feeling going into the weekend. We don’t fight the sell America trade, not in US Treasuries and not in the dollar. A confirmed break in EUR/USD would in a first instance bring the 1.1495 2022 intermediate top in the picture. The 2021 top stands at 1.2349. In the UK, February production data this morning were better than expected. It’s doubtful this will change fortunes for sterling (against the euro). The EUR/GBP pair already tested the 0.87 barrier. In the UK, the focus also remains at the long end of the Gilts curve with the 30-Y yield still uncomfortably high at 5.43%.
News & Views
Hong Kong-based newspaper the South China Morning Post reported that to EU officials are planning to make a visit to China for a meeting with Chinese president Xi Jinping in late July. People familiar with the matter indicate that EC von der Leyen and European Council President Costa agreed to the summit which breaks with protocol since the EU and China previously met in China as well. In more signals that the hawkish US trade policy is improving ties between the two blocks, Handelsblatt yesterday reported that they started talks on abolishing EU tariffs on Chinese EV’s while Spanish PM Sanchez concluded his visit to the country by calling for mutually beneficial relations and to promote balanced trade and investments.
Bank of England governor Breeden commented on the escalating trade war and the unravelling of leveraged trades in the US Treasury market. Regarding trade, she singled out a potential weakening in the UK currency as key in defining the inflation outlook by making UK imports more expensive. It has not happened yet, but “that could change”. On the turbulence in the Treasury market, she said that it’s not obvious that the right thing to do is to intervene in the gilt market. The long end of the UK curve underperformed as well with the UK 30-yr yield reaching its highest level since 1998 and bringing back the echo of the Truss-Kwarteng crisis. “What we can do is be aware of what’s going on and have repo facilities, ways of providing liquidity to the system to try and ensure that whatever trading happens, happens as smoothly as possible.”..
GBP/JPY Daily Outlook
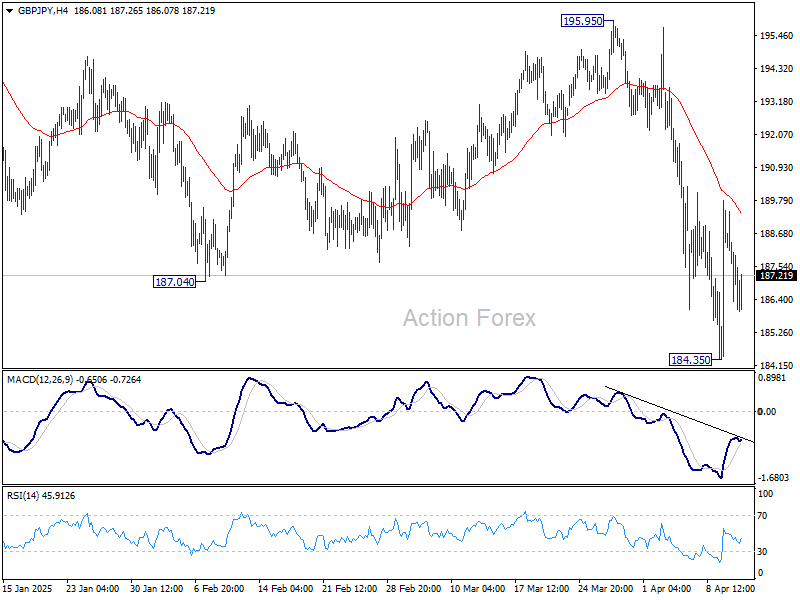
Daily Pivots: (S1) 185.94; (P) 187.77; (R1) 189.19; More...
Intraday bias in GBP/JPY remains neutral for the moment. Risk will stay mildly on the downside as long as 55 4H EMA (now at 189.56) holds. Break of 184.35 will resume the whole fall from 199.79. Nevertheless, sustained trading above 55 4H EMA will bring stronger rally back to 195.95 resistance instead.
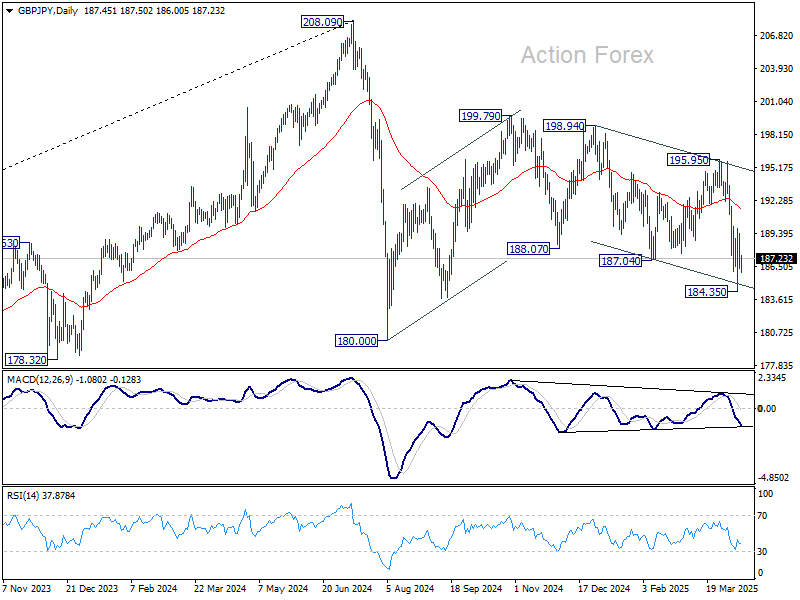
In the bigger picture, price actions from 208.09 are seen as a correction to rally from 123.94 (2020 low). Strong support should be seen from 38.2% retracement of 123.94 to 208.09 at 175.94 to contain downside. However, sustained break of 152.11 will bring deeper fall even still as a correction.
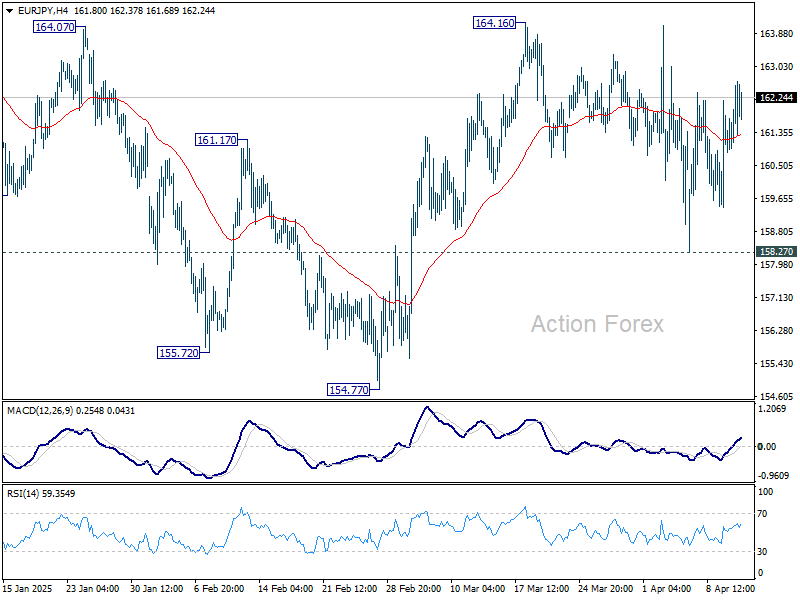
EUR/JPY Daily Outlook
Daily Pivots: (S1) 160.93; (P) 161.76; (R1) 162.64; More...
Intraday bias in EUR/JPY remains neutral for the moment. On the upside, above 164.16 will resume the rally from 154.77 to 164.89 resistance, and then 166.67. However, decisive break of 158.27 support will bring deeper decline back to 154.77 support. Overall, sideway consolidation pattern from 154.40 is still extending.
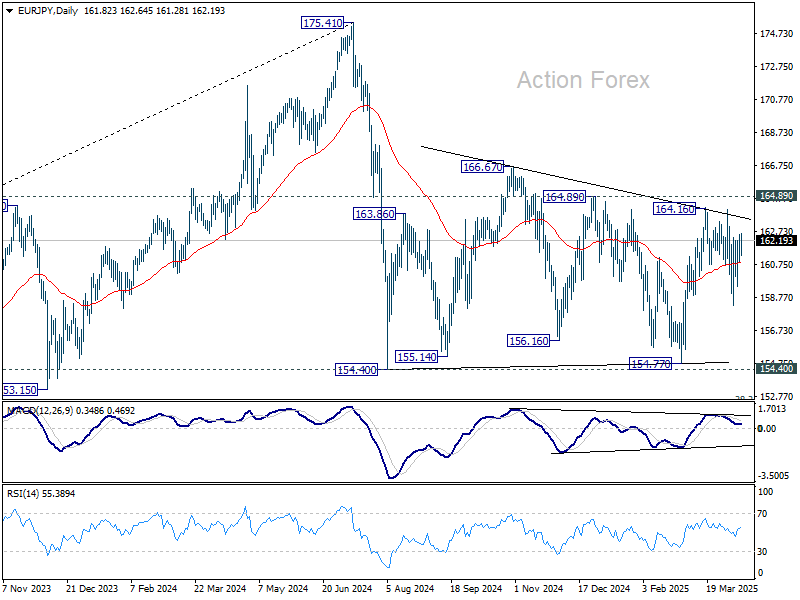
In the bigger picture, price actions from 175.41 are seen as correction to rally from 114.42 (2020 low). Strong support should be seen from 38.2% retracement of 114.42 to 175.41 at 152.11 to contain downside. However, sustained break of 152.11 will bring deeper fall even still as a correction.
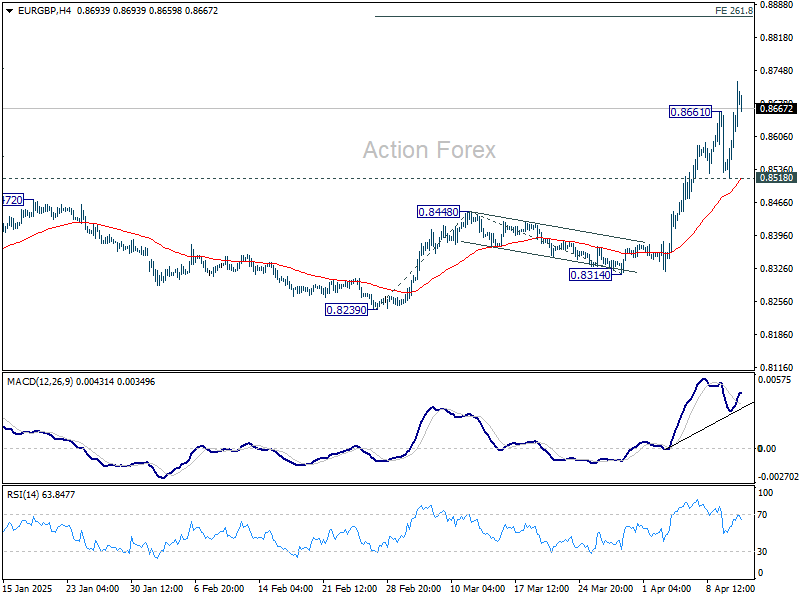
EUR/GBP Daily Outlook
Daily Pivots: (S1) 0.8551; (P) 0.8606; (R1) 0.8691; More...
EUR/GBP's rally resumed after brief retreat and intraday bias is back on the upside. Current rise should target 261.8% projection of 0.8239 to 0.8448 from 0.8314 at 0.8861. On the downside, break of 0.8518 support is needed to indicate short term topping. Otherwise, outlook will stay bullish in case of retreat.
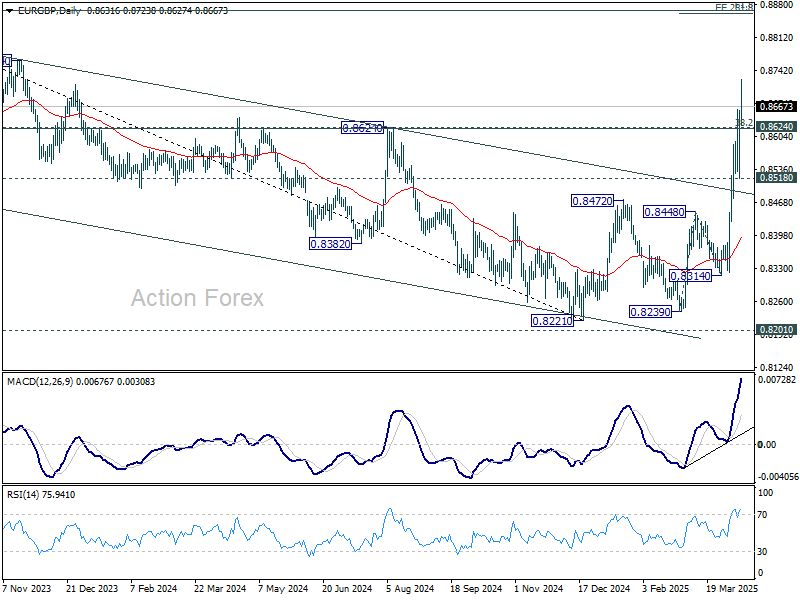
In the bigger picture, firm break of 0.8624 cluster resistance (38.2% retracement of 0.9267 to 0.8221 at 0.8621) should confirm the case of bullish trend reversal. That is down trend from 0.9267 (2022 high) has completed at 0.8221, just ahead of 0.9201 key support (2022 low). Further rise should be seen to 61.8% retracement at 0.8867 next. This will now remain the favored case as long as 0.8472 resistance turned support holds.
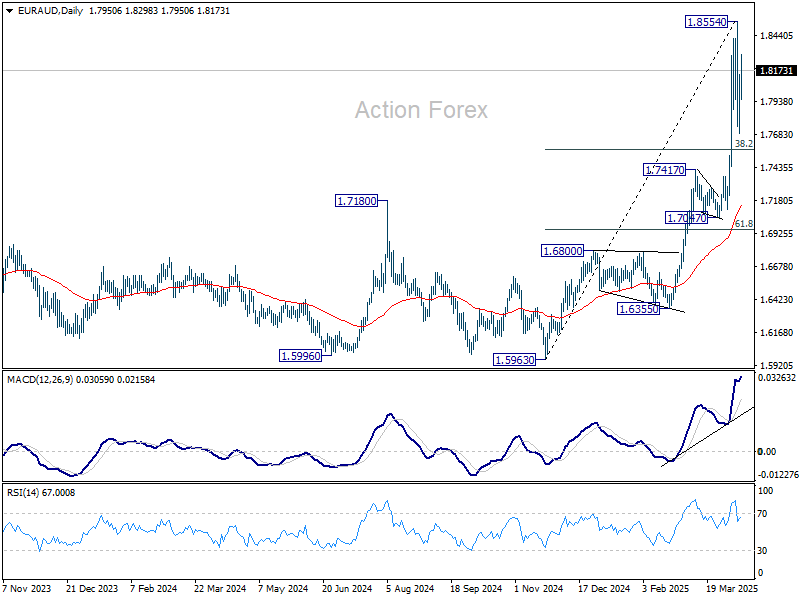
EUR/AUD Daily Outlook
Daily Pivots: (S1) 1.7509; (P) 1.8033; (R1) 1.8319; More...
Intraday bias in EUR/AUD is turned neutral again with current recovery. Consolidations from 1.8554 could extend further. But in case of another dip, downside should be contained by 38.2% retracement of 1.5963 to 1.8854 at 1.7750. On the upside, firm break of 1.8554 will resume larger up trend.
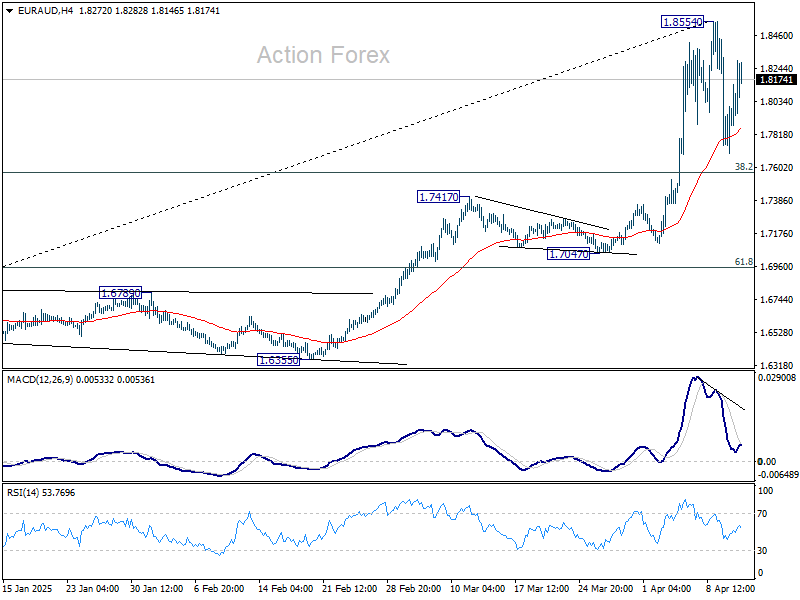
In the bigger picture, up trend from 1.4281 (2022 low) is in progress, and in reacceleration phase as seen in W MACD. Next target is 100% projection of 1.4281 to 1.7062 from 1.5963 at 1.8744. Firm break there will pave the way to 138.2% projection at 1.9806, which is close to 1.9799 (2020 high). Outlook will remain bullish as long as 1.7417 resistance turned support holds even in case of deep pullback.
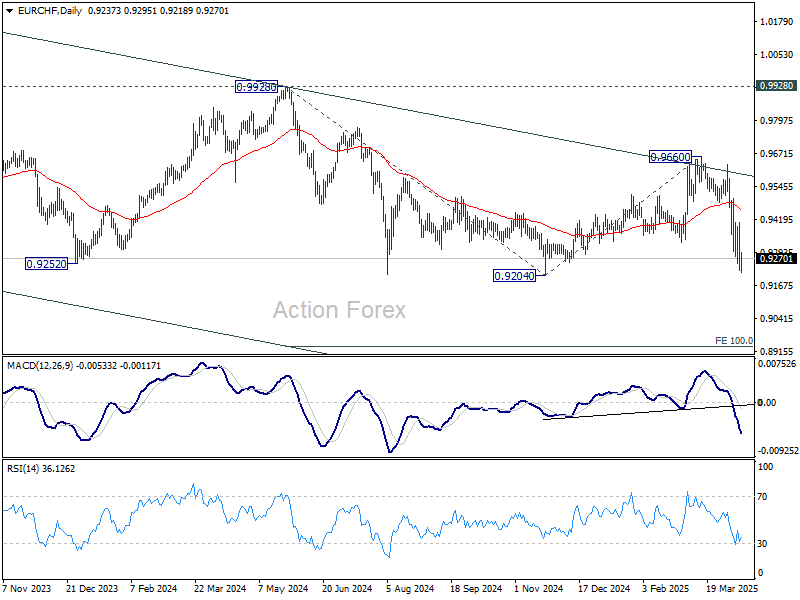
EUR/CHF Daily Outlook
Daily Pivots: (S1) 0.9166; (P) 0.9288; (R1) 0.9350; More....
EUR/CHF's fall from 0.9660 resumed after brief recovery and intraday bias is back on the downside. Firm break of 0.9204 key support will confirm larger down trend resumption. On the upside, break of 0.9408 resistance is needed to confirm short term bottoming. Otherwise, outlook will stay bearish in case of recovery.
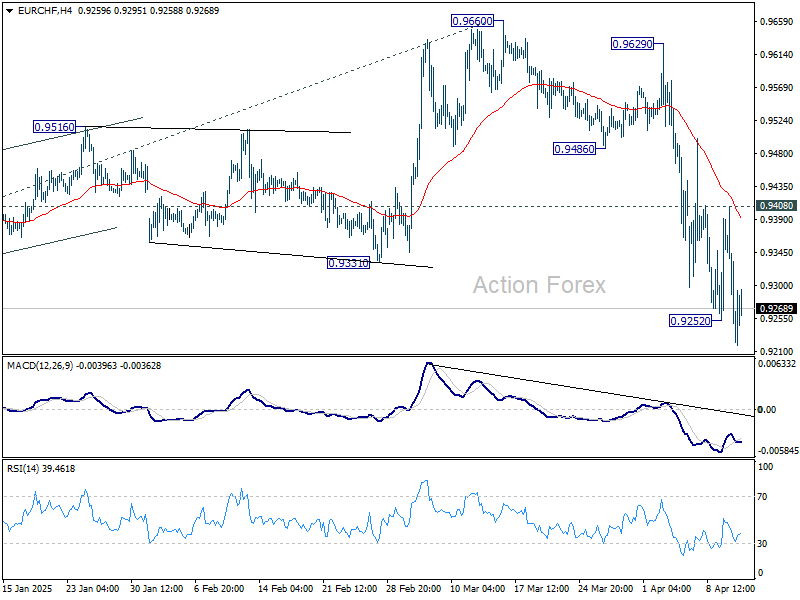
In the bigger picture, rejection by long-term falling channel resistance (now at 0.9600) retains medium term bearishness. That is, down trend from 1.2004 (2018 high) is still in progress. Firm break of 0.9204 (2024 low) will confirm resumption. Next target is 100% projection of 0.9928 to 0.9204 from 0.9660 at 0.8936.
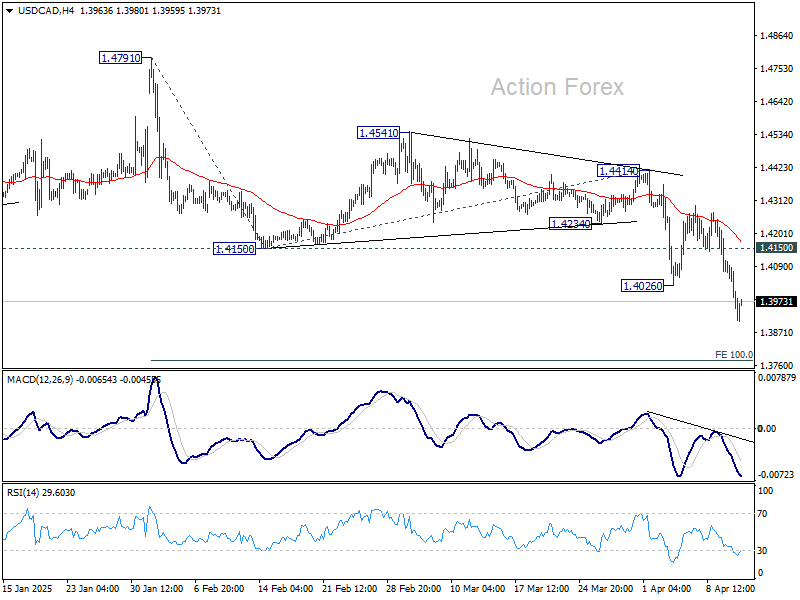
USD/CAD Daily Outlook
Daily Pivots: (S1) 1.3920; (P) 1.4015; (R1) 1.4080; More...
USD/CAD's fall from 1.4791 resumed by breaking through 1.4026 and intraday bias is back on the downside. Sustained break of 1.3946 will carry larger bearish implication. Next target is 100% projection of 1.4791 to 1.4150 from 1.4414 at 1.3773. On the upside, break of 1.4150 support turned resistance is needed to indicate short term bottoming. Otherwise, outlook will stay bearish in case of recovery.
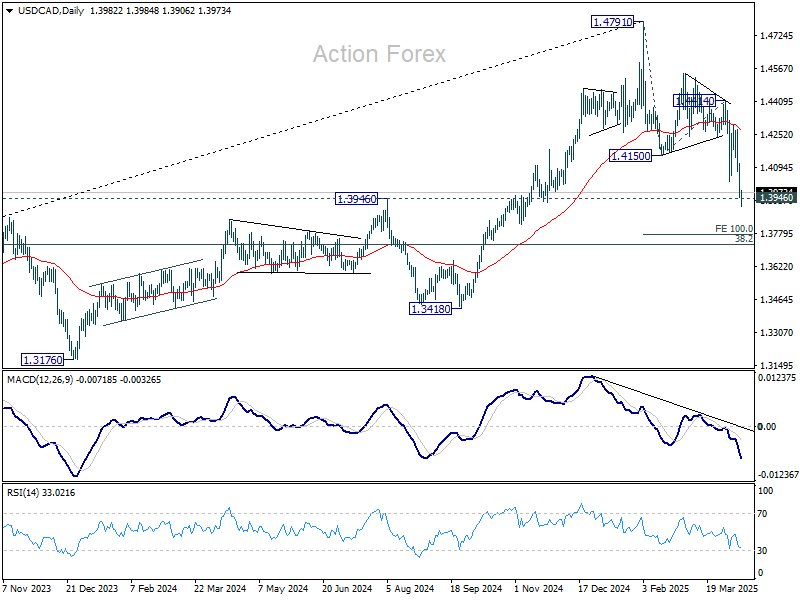
In the bigger picture, focus is now on 1.3976 resistance turned support (2022 high), which is close to 55 W EMA (now at 1.4001). Strong rebound from there will retain medium term bullishness. That is, up trend from 1.2005 is still in progress for breaking through 1.4791 at a later stage. However, sustained break there should confirm medium term topping at 1.4791. Deeper correction would be seen to 38.2% retracement of 1.2005 (2021 low) to 1.4791 at 1.3727.
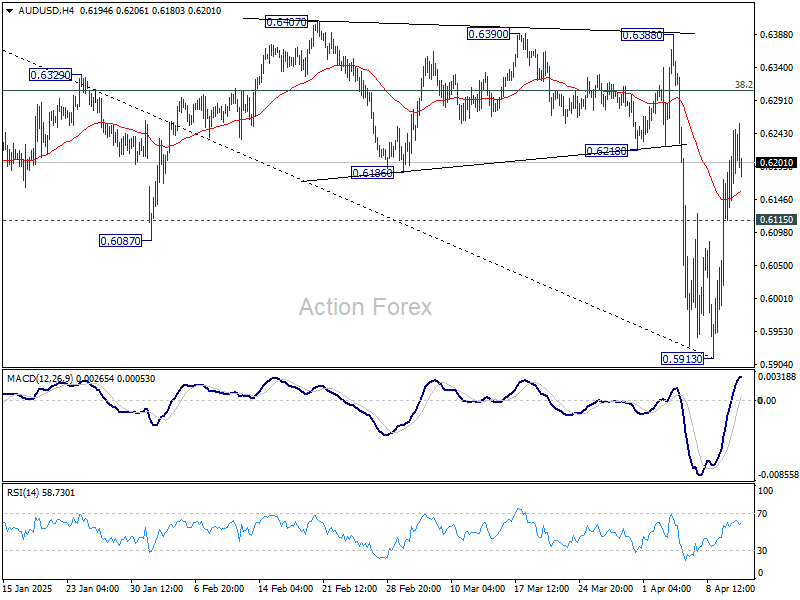
AUD/USD Daily Report
Daily Pivots: (S1) 0.6143; (P) 0.6197; (R1) 0.6277; More...
A short term bottom should be formed at 0.5913 with break of 55 4H EMA (now at 0.6158). Intraday bias is now on the upside for 38.2% retracement of 0.6941 to 0.5913 at 0.6316. Sustained break there will target 61.8% retracement at 0.6548. On the downside, below 0.6115 minor support will turn intraday bias neutral again first.
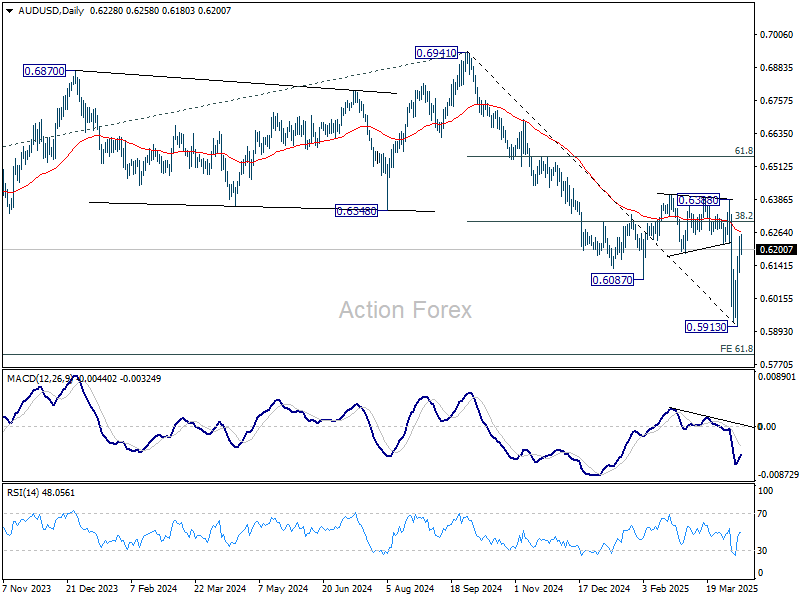
In the bigger picture, fall from 0.6941 (2024 high) is seen as part of the down trend from 0.8006 (2021 high). Next medium term target is 61.8% projection of 0.8006 to 0.6169 from 0.6941 at 0.5806. In any case, outlook will stay bearish as long as 0.6388 resistance holds.
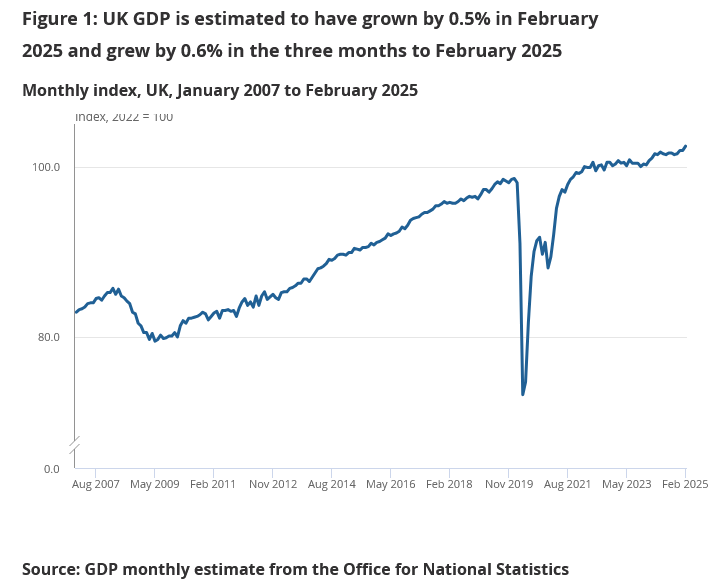
UK GDP rises 0.5% mom in Feb, broad-based growth
The UK economy delivered a strong upside surprise in February, with GDP expanding by 0.5% mom, far exceeding market expectations of just 0.1% mom. All three major sectors contributed to the growth: services rose by 0.3% mom, production surged by 1.5% mom, and construction edged up 0.4% mom.
On a three-month rolling basis, real GDP grew by 0.6% to February 2025 compared to the previous three months, driven largely by a 0.6% rise in services output and a 0.7% gain in production. Construction, however, was flat over the period.