Sample Category Title
USD/CHF Falls to Its Lowest Level in Nearly Five Months
Today, the exchange rate of one US dollar against the Swiss franc dropped below 0.87000 francs—its lowest level since early November 2024.
Since the start of 2025, the USD/CHF pair has declined by more than 4%.
Why Is USD/CHF Falling Today?
On one hand, the US dollar is weakening against other currencies due to Trump’s decision to implement the previously announced tariffs on international trade, as mentioned in our previous post.
On the other hand, the Swiss franc is gaining strength due to its appeal as a safe-haven asset. Furthermore, this morning’s release of the Consumer Price Index (CPI) showed that inflation in Switzerland remains at zero, increasing the franc’s value at a time when tariff conflicts pose risks to the global economy.
Technical Analysis of the USD/CHF Chart
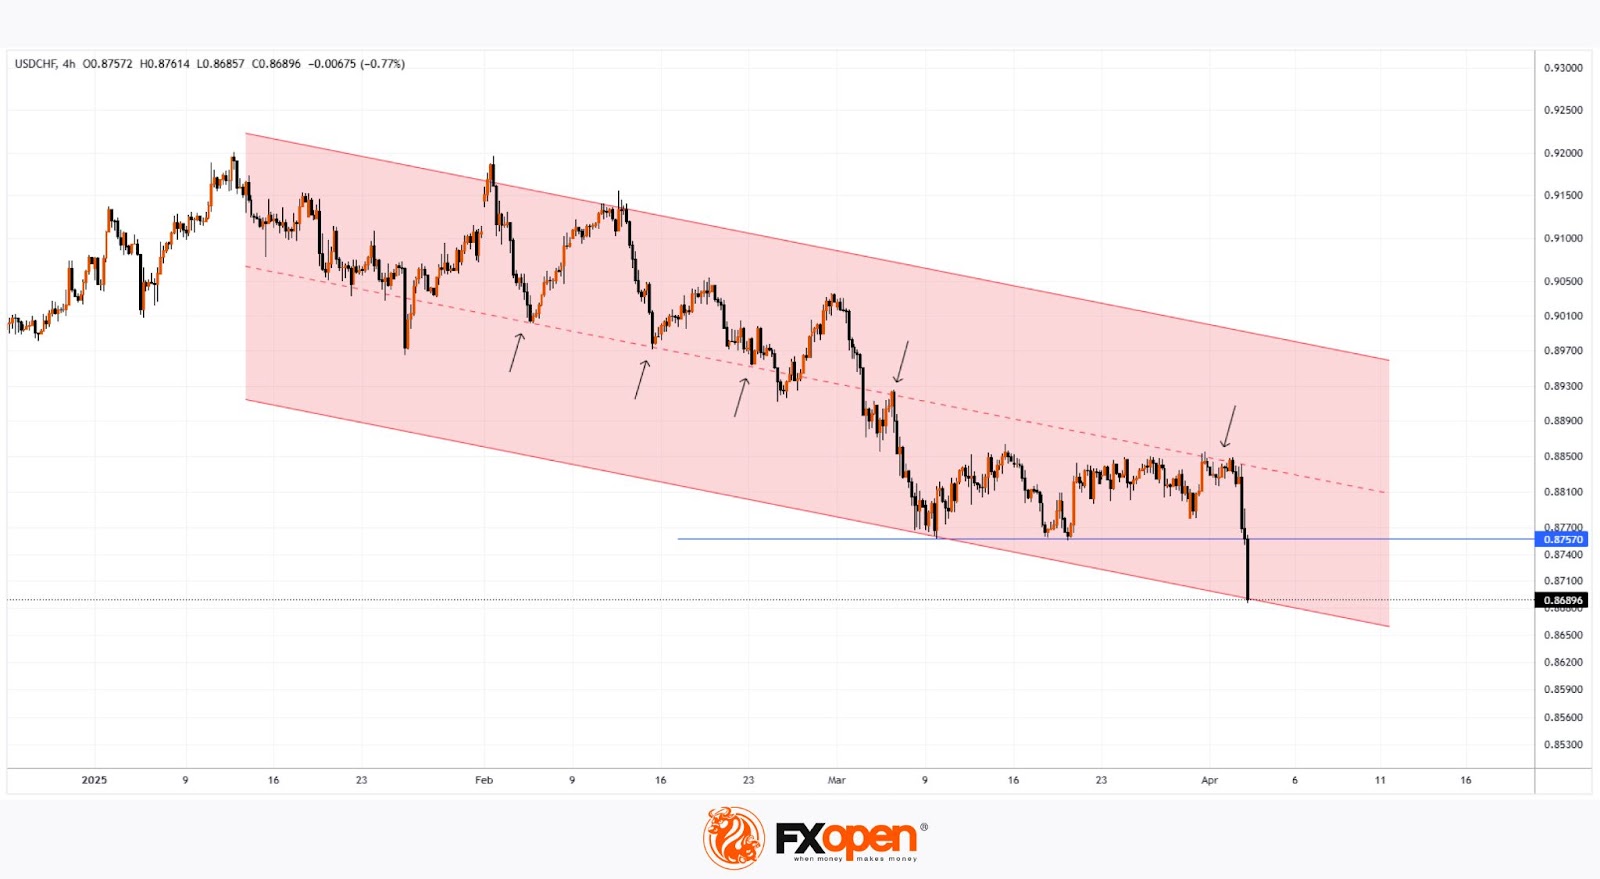
Since the start of 2025, the USD/CHF pair has been following a downward trajectory, highlighted by a declining channel (marked in red), with the following key points:
→ The median line has shifted from support to resistance, as indicated by the arrows.
→ The price broke through the March support level around 0.8757, accelerating the decline.
→ The lower boundary of the channel provided support this morning, slowing bearish momentum.
It is possible that the 0.8757 level will act as resistance in April 2025. However, the future direction of USD/CHF will largely depend on news developments, particularly statements from global leaders regarding tariffs in international trade.
Trade over 50 forex markets 24 hours a day with FXOpen. Take advantage of low commissions, deep liquidity, and spreads from 0.0 pips. Open your FXOpen account now or learn more about trading forex with FXOpen.
This article represents the opinion of the Companies operating under the FXOpen brand only. It is not to be construed as an offer, solicitation, or recommendation with respect to products and services provided by the Companies operating under the FXOpen brand, nor is it to be considered financial advice.
S&P 500 Index Hits 2025 Low Following Trump’s Tariff Announcement
As shown on the S&P 500 Index (US SPX 500 mini on FXOpen) chart, the benchmark US stock index dropped below 5,450 points for the first time in 2025. This decline reflects the US stock market’s reaction to the tariffs imposed by the White House on international trade.
According to Reuters:
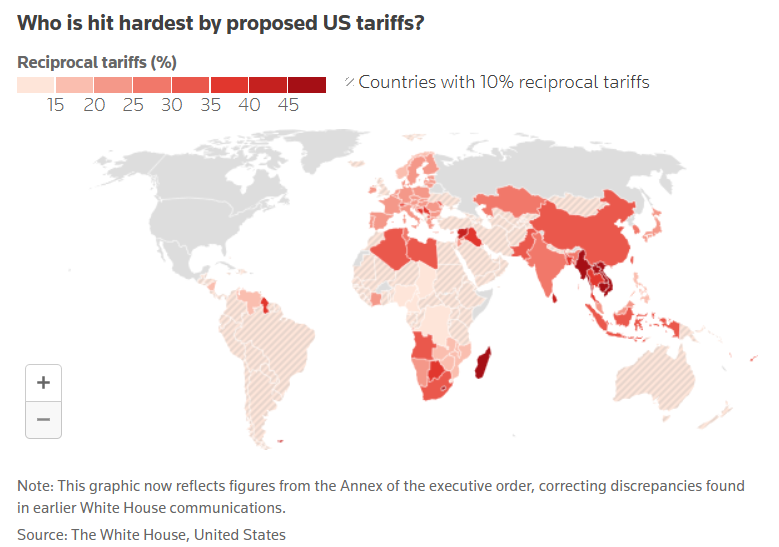
→ President Donald Trump announced a 10% tariff on most goods imported into the United States, with Asian countries being hit the hardest.
→ This move escalates the global trade war. "The consequences will be devastating for millions of people worldwide," said European Commission President Ursula von der Leyen, adding that the 27-member EU bloc is preparing to retaliate if negotiations with Washington fail.
Financial Markets’ Reaction to Trump’s Tariffs
→ Stock markets in Beijing and Tokyo fell to multi-month lows.
→ Gold hit a new all-time high, surpassing $3,160.
→ The US dollar weakened against other major currencies.
The S&P 500 Index (US SPX 500 mini on FXOpen) is now trading at levels last seen in September 2024, before Trump's election victory.
Investor sentiment appears to have turned bearish, with growing concerns over the impact of Trump's tariffs, as fears mount that they could slow down the US economy and fuel inflation.
Technical Analysis of the S&P 500 Index (US SPX 500 mini on FXOpen)
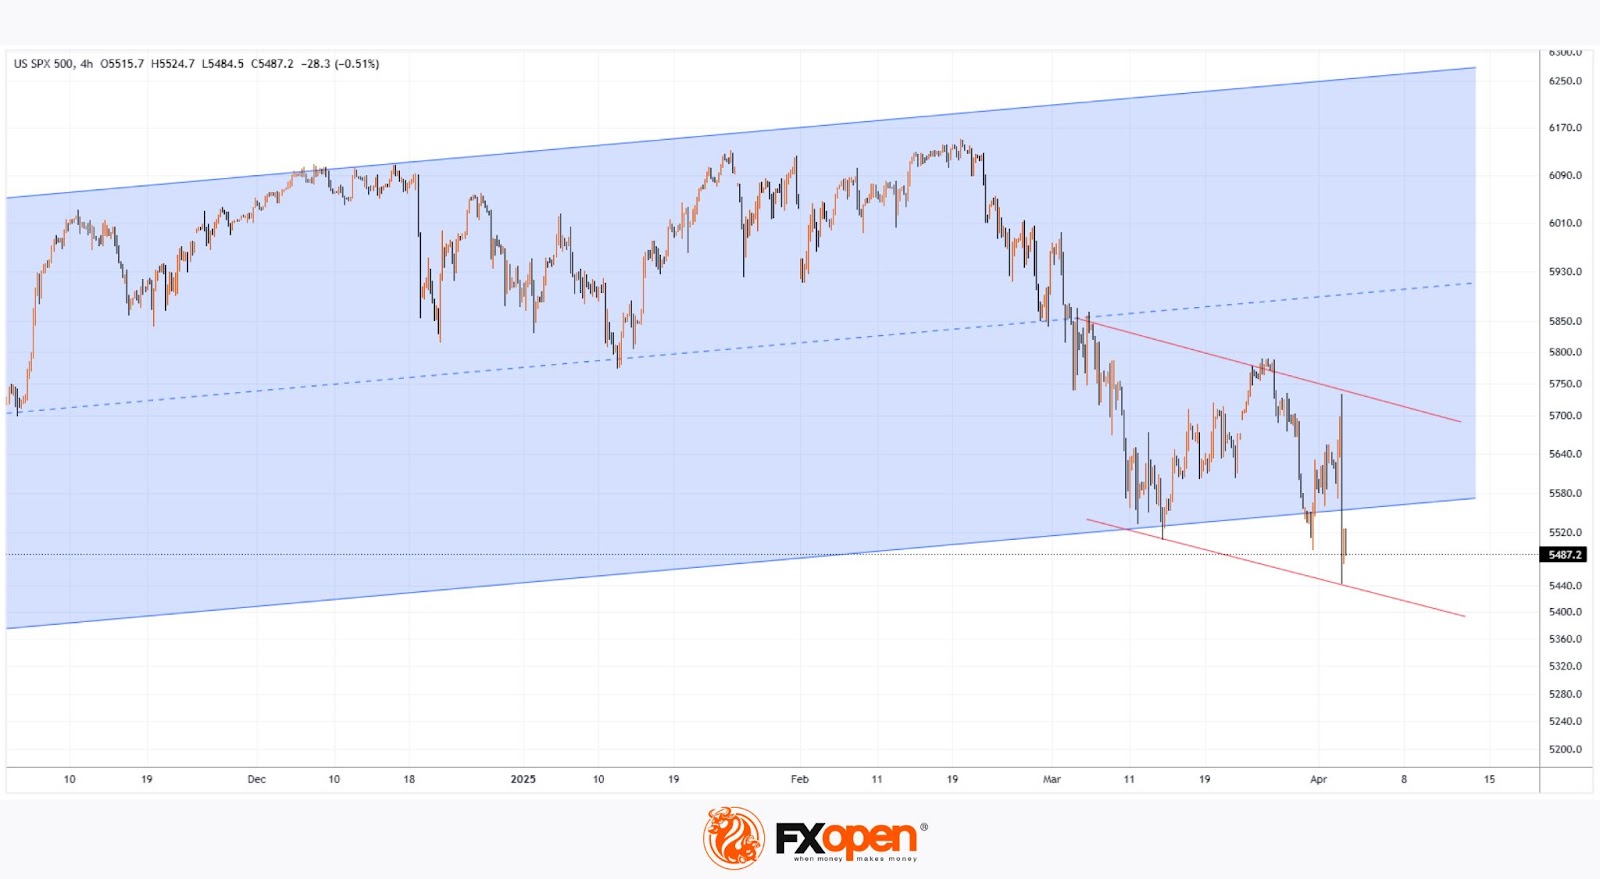
The bearish momentum seen yesterday signals a continued correction, which we first identified in our 17 March analysis.
At that time, we mapped out a rising channel (blue) that began in 2024, suggesting that selling pressure might ease near its lower boundary. However, Trump's policy decision has reinforced bearish confidence, and now the price may continue fluctuating within the two downward-sloping red lines. This suggests that the long-term blue growth channel is losing its relevance.
Trade global index CFDs with zero commission and tight spreads. Open your FXOpen account now or learn more about trading index CFDs with FXOpen.
This article represents the opinion of the Companies operating under the FXOpen brand only. It is not to be construed as an offer, solicitation, or recommendation with respect to products and services provided by the Companies operating under the FXOpen brand, nor is it to be considered financial advice.
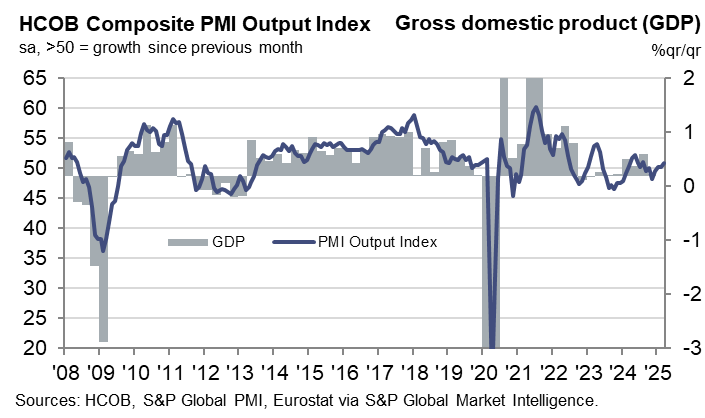
Eurozone PMI composite finalized at 50.9, steady but shaky
Eurozone’s private sector continued to show signs of stabilization in March, with PMI Composite finalized at 50.9 — the highest in seven months — up from February's 50.2. PMI Services was finalized at 51.0, up from prior month's 50.6.
Among the major economies, Germany stood out with a 10-month high at 51.3, while France remained in contraction despite improving to a five-month high at 48.0.
Cyrus de la Rubia, Chief Economist at Hamburg Commercial Bank, acknowledged that recession fears that loomed late last year are now giving way to cautious optimism. The Eurozone has managed to stay in growth territory for three straight months.
Still, he warned that this fragile recovery could be easily thrown "off course again" by external shocks — namely, the newly announced US reciprocal tariffs.
ECB’s Nagel and Stournaras warn of economic fallout from US tariffs
Bundesbank President Joachim Nagel issued a strong warning today, saying the US administration's new tariff measures "endanger global economic stability."
Nagel emphasized the need for strong alliances and fewer trade barriers to tackle today’s global challenges, adding that the US is pursuing a "completely different direction" with economic policies that could leave many losers—especially within its own borders.
Echoing these concerns, Greek ECB Governing Council member Yannis Stournaras said the US tariffs are expected to weigh on Eurozone GDP growth rate by 0.3% to 0.4% in the first year, though he noted that the broader inflation outlook remains unaffected.
Stournaras added that the US tariffs were “not an obstacle” to an ECB rate cut in April.
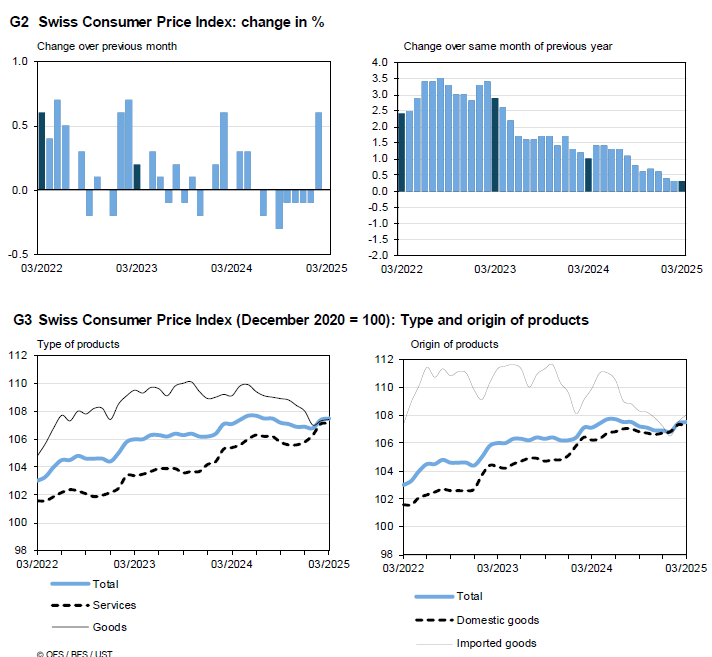
Swiss CPI unchanged at 0.3% yoy in Mar, misses expectations
Swiss consumer inflation remained subdued in March, with headline CPI unchanged on the month, below the expected 0.1% mom rise. Core CPI (excluding fresh and seasonal products, energy and fuel) rose just 0.1% mom. The breakdown showed a -0.1% mom decline in domestic product prices, offset somewhat by a 0.5% mom rise in prices of imported products.
On an annual basis, headline CPI held steady at just 0.3% yoy, missing expectations for an uptick to 0.5% yoy. Core inflation also remained unchanged at 0.9% yoy. The slight increase in domestic product inflation from 0.9% yoy to 1.0% yoy suggests some persistence in local cost pressures. But overall imported inflation remains deeply negative at -1.7% yoy, down from -1.5% yoy.
By Keeping Threat of Even Higher Tariff Rates Alive, We Enter a Prolonged Period of Uncertainty
Markets
The US government published the groundwork of its new trade policy. The baseline is a 10% across-the-board levy on all imports, effective April 5th. The tariff rate is higher for countries who charge the US more than 20% (including FX manipulation and trade barriers; based on calculations by the US administration). In those cases, the US from now on charges discounted reciprocal tariffs (on top of existing tariff rates) amounting to approximately half of the tariffs charged to the US. In case of the European Union, the White House calculated an average 39% tariff rate charged to the US, translating into a discounted reciprocal tariff of 20%. The reciprocal tariffs take effect April 9th. Ahead of the announcement, Treasury Secretary Bessent told lawmakers that tariffs are a cap and that countries can take steps to push them down. However, the reference to “discounted” reciprocal tariffs suggests that the US government has leeway to move levels in both directions with the universal rate being a floor and the White House’s calculated tariff rate to the US (including FX manipulation and trade barriers) being the real cap (ie double the current discounted reciprocal tariff rate). It will be interesting to see whether and how fast the needle moves if countries threaten to retaliate. The EU for now framed it as “preparing for further countermeasures to protect our interests and our businesses IF negotiations fail”.
The initial market response is risk-off with stock futures sinking 2%-3% and core bond futures rallying. By keeping the threat of even higher tariff rates alive, we enter a prolonged period of uncertainty which can further damage (risk) sentiment. The new trade paradigm is expected to both raise inflation (short term) and hit growth (medium term). Up until now, the Fed prioritized upside inflation risks over downside growth risks. That’s still our main scenario, with Fed Chair Powell speaking about the economic outlook tomorrow evening. The market reaction is one with the onus on the “STAG” rather than the “FLATION” part of the story. It helps explaining new USD-weakness, propelling EUR/USD from the 1.08 area to intermediate resistance (YtD top) at 1.0955. We still target a return to 1.1214. The trade-weighted dollar (DXY; 102.80) already lost support (YtD low) at 103.20, paving the way for full technical retracement towards the 2024 low at 100.16. Risk-off outweighs a 24% Japanese reciprocal tariff rate with USD/JPY falling from 149+ to 147. China gets slapped with an additional 34% rate on top of the 20% already in place, hurting CNY. USD/CNY rises from 4.27 to 4.2950, approaching the YTD high around 7.33 (weakest CNY-levels since 2007). More short term volatility will obviously be name of the game with the dust still settling and awaiting the reaction function of nations and the US going forward from the current set-up. In order to restore some market equilibrium, much will probably depend on how “final” current announced tariff rates are.
News & Views
The National Bank of Poland yesterday left its policy rate unchanged at 5.75%. This level is still deemed conductive to meeting the NBP’s (2.5%) inflation target. However; the NBP acknowledged recent softer than expected inflation, even as inflation still remains elevated due to implemented increases in administered prices. Inflation in the first quarter was 4.9%, while the NBP expected it to peak at 5.4%. The NBP still sees wage growth running at a high level, but enterprise data point to lowering wage growth. Q1 activity also was weaker than expected. The NBP expects inflation to remain above the NBP target ‘in the coming months’ (was ‘this year’ in the March statement). In the second half of 2025 there will be a further rise in regulated energy prices. The NBP signals uncertainty on how ongoing high inflation will affect inflation expectations and wages. Despite the softer bias in the MPC statement, the Polish 2-y swap yield rose marginally (4.85%). The zloty strengthened from the EUR/PLN 4.18+ area to close near 4.17. Recently some members opened the debate on the timing of a first rate cut. However, governor Glapinski didn’t see room for rate cuts anytime soon. He will address the press this afternoon.
US Senate Republicans published a budget blueprint that should lay the groundwork for the 2017 Trump tax cuts at about $4tn to be extend and include additional tax reductions of $1.5tn. The proposal also aims to raise the debt ceiling by $5tn. The proposal is planned to be presented for a vote later this week. It then still needs to be brought in line with a House proposal and while reaching an agreement on necessary spending cuts as well. The nonpartisan Committee for a Responsible Federal Budget estimates the Senate budget measure could add about $5.8tn to the US debt in the next decade.
Tariffs Hit
I won’t make this long or complicated. Trump’s tariff announcement was worse than expected. The universal tariff was set to 10% - in line with expectations - but the tariffs imposed to main trade partners are much higher than that: 34% for China, 20% for Europe and some 24% on Japanese imports. The UK comes out less harmed with a 10% rate, while Vietnam and Lesotho are the hardest hit with tariff rates of 46% and 50% respectively. Of course, Trump said that partners could negotiate with the US to lower these rates, but the tension building into the announcement and the initial shock will be hard to digest for many trade partners and will more likely than not lead to retaliation. China already announced it would restrict investments to the US, Europe already warned there will be retaliation, and Japan said it will protect domestic industries and jobs.
Understandably, the market reaction to the tariff announcement was strongly negative. Vanguard’s S&P500 ETF fell almost 3% in the afterhours trading, the US yields and the dollar tanked, gold and Swiss franc rallied, the USDJPY fell to the lowest levels since November as a result of a swift shift to safety. Crude oil slipped below the $70pb on expectation that the tariffs would hammer global growth and demand, and copper futures – considered as a barometer of global growth - tanked more than 3% after the announcement.
FX markets price retaliation
The pricing in currency markets suggests rising retaliation bets to the US tariffs. The US dollar eased to the lowest level since Trump entered the White House, the lowest levels this year and the lowest levels since mid-October. Not only will the US companies see their costs jump on tariffs – which will boost inflation in the US – but their revenue will probably be hit by retaliatory tariffs as well. The combination of higher inflation – even if it’s transitory – and lower growth will inevitably shake the US exceptionalism. The Federal Reserve (Fed) will have to choose its battle: it will probably choose to support the economy as it considers that the impact of tariffs on inflation would be one-off and short-lived and hopefully partly countered by a sharp economic slowdown. But the supply-chain disruptions could make inflation stickier than expected. If that’s the case, the US will feel the negative impact of tariffs for quite a longtime before it starts seeing any benefits.
Partners will inevitably see their growth impacted, as well. The US tariffs could shave 1% off Eurozone GDP, for example, but the US policies could encourage the European governments to give support to their economies and further ditch whatever is left from the budget discipline. The appreciation of domestic currencies could also help taming inflationary pressures if the US dollar continues to lose value on plunging economic growth in the US.
Indeed, the expectation that the US economy will falter faster than others has been weighing heavily on the US dollar since January. And the tariff announcement sent Cable directly up above the 1.30 psychological mark. The EURUSD trades above the 1.09 level while the USDJPY tanked to 147.
Inside equities, the afterhours trading looked like a bunch of US companies announced disappointing earnings all at once. Apple – that’s still got great exposure to China – tanked more than 7% in the afterhours, Nike also fell by a similar amount, while Nvidia lost more than 5% and Tesla tanked more than 8%.
The futures are deeply in the red with the S&P500 futures pointing at almost 3% losses at the time of writing, while Nasdaq futures point at losses of more than 3%. The European futures are severely down as well, with DAX futures down by nearly 2%. The European exports to the US are seen falling by 50% on tariffs according to Bloomberg analysis.
Interestingly, the Chinese CSI 300 is down by less than 1% (although the Chinese exports to the US are expected to tank by around 80%!).
In the next hours and day, the world’s reaction, likely retaliation and how much effort and money countries will deploy to fight the US back will matter. For now, everyone’s sinking, but the US is going under first.
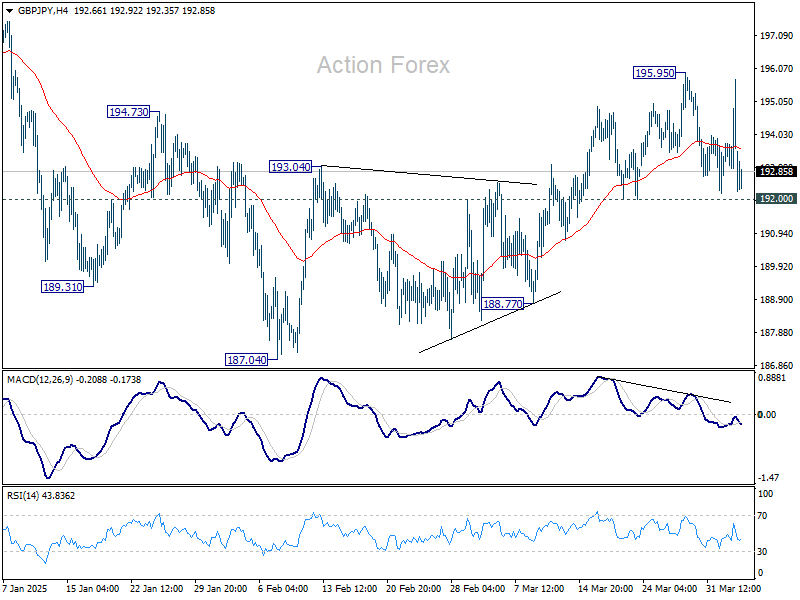
GBP/JPY Daily Outlook
Daily Pivots: (S1) 192.90; (P) 194.35; (R1) 195.70; More...
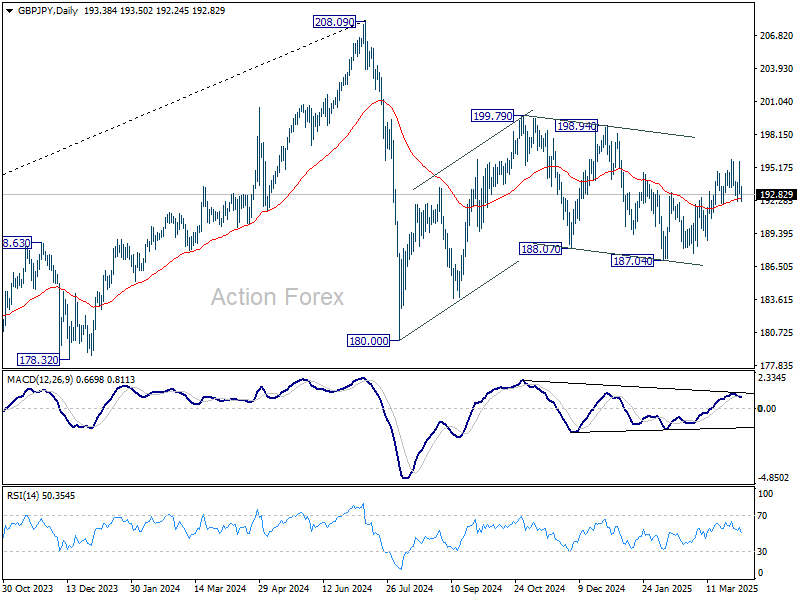
No change in GBP/JPY's outlook as it stays in range below 195.95. Intraday bias remains neutral. On the upside, break of 195.95 will extend the rally from 187.04 once again, to 198.94 resistance. However, firm break of 192.00 support will turn bias back to the downside for deeper fall. Overall, corrective pattern from 180.00 is still extending.
In the bigger picture, price actions from 208.09 are seen as a correction to rally from 123.94 (2020 low). Strong support should be seen from 38.2% retracement of 123.94 to 208.09 at 175.94 to contain downside. However, sustained break of 152.11 will bring deeper fall even still as a correction.
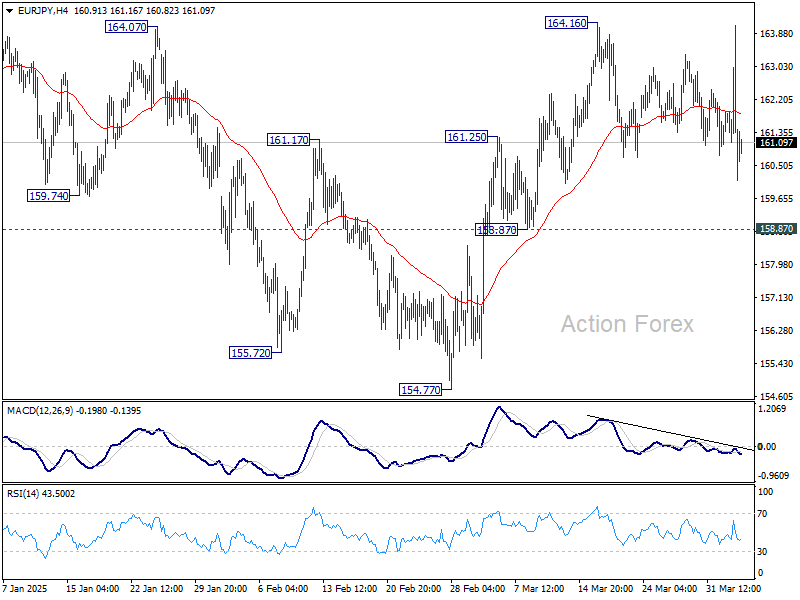
EUR/JPY Daily Outlook
Daily Pivots: (S1) 160.82; (P) 162.50; (R1) 163.89; More...
Much volatility was seen in EUR/JPY but it remains largely in range. Intraday bias remains neutral first. On the upside, above 164.16 will resume the rally from 154.77 to 164.89 resistance, and then 166.67. However, break of 158.87 support will bring deeper decline back to 154.77 support. Overall, sideway consolidation pattern from 154.40 is still extending.
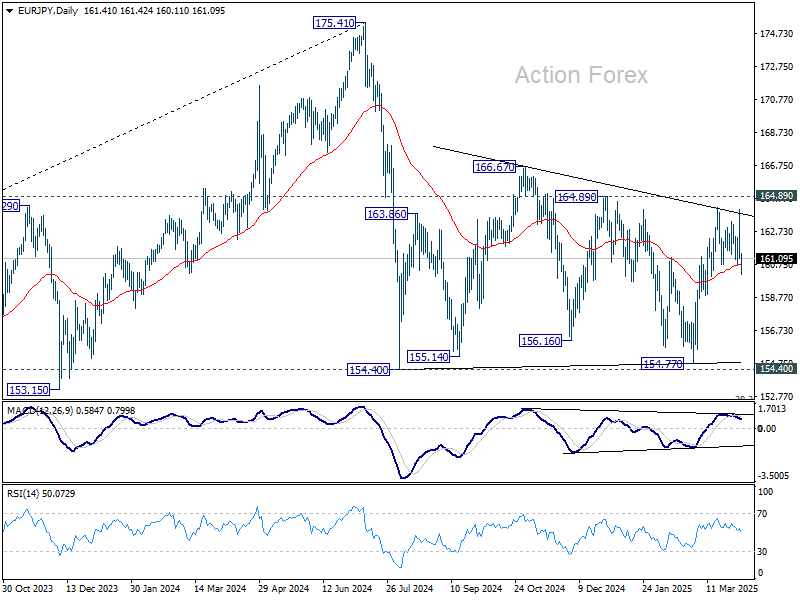
In the bigger picture, price actions from 175.41 are seen as correction to rally from 114.42 (2020 low). Strong support should be seen from 38.2% retracement of 114.42 to 175.41 at 152.11 to contain downside. However, sustained break of 152.11 will bring deeper fall even still as a correction.
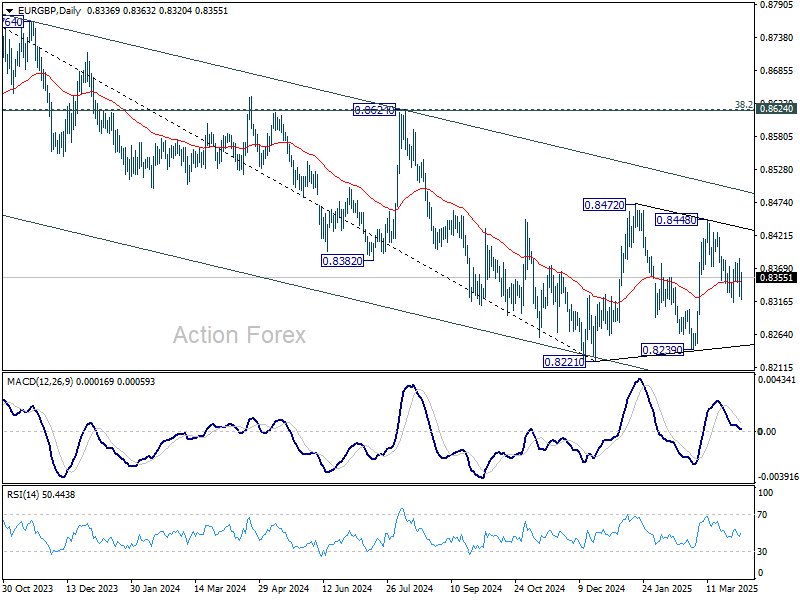
EUR/GBP Daily Outlook
Daily Pivots: (S1) 0.8320; (P) 0.8354; (R1) 0.8380; More...
EUR/GBP is staying in established range despite some volatility. Intraday bias remains neutral first. On the downside, break of 0.8314 will resume the decline from 0.8448 towards 0.8239 support. Nevertheless, firm break of 0.8384 will argue that fall from 0.8448 is merely a correction and has completed. Retest of 0.8448 should be seen next.
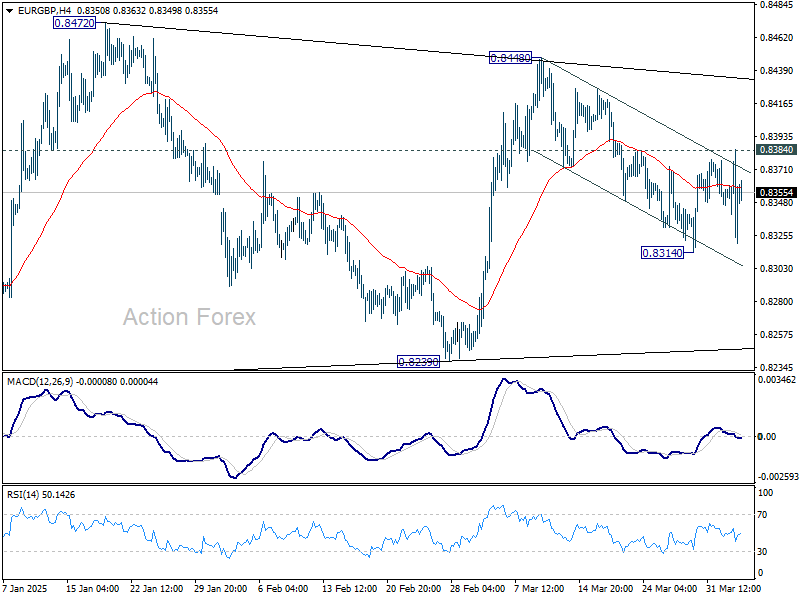
In the bigger picture, EUR/GBP is still bounded inside medium term falling channel. While rebound from 0.8221 might extend higher, it could still develop into a corrective pattern. Overall outlook will be neutral at best and down trend from 0.9267 (2022 high) could extend, at least until decisive break of channel resistance (now at 0.8495).