
Sample Category Title
Norges Bank Rate Decision on the Agenda
In focus today
In the US, we will receive the second revision of GDP final. We do not anticipate a significant impact on market movements.
In the euro area, monetary aggregates and credit data will be released. As the ECB continues its active discussions on restrictiveness of monetary policy - pivotal for rate decisions - data on credit growth will be crucial. Credit growth has increased to approximately 2% y/y for the private sector, following the recent easing of monetary policy. However, momentum (the credit impulse) has remained flat at around 1% over the past six months, which, in our view, suggests that monetary policy remains tight. There is also a string of ECB speeches, including Schnabel, scheduled today.
In Norway, we anticipate Norges Bank will cut the policy rate to 4.25%, as signalled. This is a non-consensus view, as market pricing and consensus suggest only a 25-30 % probability of a cut. Admittedly, the inflation figures for February were significantly higher than expected and will contribute to a higher rate path. However, we anticipate that the monetary policy analysis will conclude that the combination of declining inflation, below-normal capacity utilization and restrictive monetary policy strongly supports lower rates. Although we expect the upcoming monetary policy report to adjust the rate path upwards by 25-30bp., it is still likely to indicate about two cuts in 2025, with further reductions planned for 2026-2028. In that case, it should be possible to stick to the plan and cut the policy rate already at this crossroad.
Economic and market news
What happened overnight
In the US, President Trump has announced a 25% tariff on imports of foreign-made vehicles as well as car parts. The tariffs will go into effect on 2 April as part of a series of other tariffs set to be implemented on "Liberation Day". The announcement has already faced criticism, including from the EU and Canada, which will take measures to protect their interests.
What happened yesterday
In the US, February's durable goods orders data showed a 0.9% increase, outperforming expectations (cons: -1.0%), yet it did not lead to further market reactions.
In the evening Fed's Musalem cautioned that tariffs could lead to more persistent inflation, potentially exceeding the Fed's 2% target and requiring tighter monetary policy.
In the UK, February inflation came in to the low side with headline and core inflation lower than expected at respectively 2.8% y/y (cons: 3.0%, prior: 3.0%) and 3.5% y/y (cons: 3.6%, prior: 3.7%). Services remained unchanged at 5.0% y/y (cons: 4.9%, prior: 5.0%). More broadly, inflationary pressures eased, and inflation is currently at or below the Bank of England's expectations, paving the way for another cut at the upcoming meeting. We will receive another inflation print before the next meeting in May. In the afternoon, the Labour government presented its Spring statement, which was overall in line with expectations with Chancellor Reeves aiming to reassure markets of the government's commitment to fiscal sustainability. Gilts initially reacted strongly but ended the day with benchmark yields only 1-3bp lower, supported by a downside surprise to inflation figures released earlier in the day.
In Sweden, The Economic Tendency Survey from NIER indicated a negative outlook for the economy, with decreased confidence, particularly among consumers, indicating a weaker sentiment than usual. Households are pessimistic about both their current economic situation and outlook. Pricing plans rose further in March and are now significantly above normal levels. This accelerates the stagflation trend, creating a more challenging environment for the Riksbank.
The Minutes from last week's Riksbank meeting was also released yesterday. The Board communicated a balanced view, acknowledging inflation risks but suggesting the recent uptick is temporary, while emphasising the need for ongoing economic support. Despite concerns over stagflationary trends, they maintain a positive outlook for inflation and activity, stressing readiness to act if needed. Current policy rate path suggests balanced risks, but there is potential downside in market pricing (12bp worth of hikes for coming year) as the minutes are slightly dovish in comparison.
In geopolitics, the truce agreements between Ukraine and Russia are currently hitting a wall, with the two parties accusing each other of violating the US-brokered deal, while the EU has rejected Russia's conditions for a Black Sea ceasefire. Hence, uncertainty remains high. Today, French President Macron is set to host European leaders, including Ukrainian President Zelensky, to discuss Ukrainian security in light of the potential ceasefire with Russia. For our assessment of the implications of a ceasefire, please see Research Global - What would a dirty deal in Ukraine mean for markets?, 16 February.
Equities: US equities lower on Wednesday as Trump laid out his plans of a 25% car tariff. The jury is still out on how car part will be handled which means that the risk to supply chains is uncertain. Supply chains is a bigger headache for equity investors than more expensive cars. Hence, this was more of a targeted selloff (Tesla and other car makers, MAG7) while overall equities held up well. S&P 500 dropped 1.1% but equal weight S&P 500 only down -0.2%. Tariffs were announced after closing, so it is surprising to see US futures even slightly higher this morning, although European ones are lower. A defensive rotation took place below the surface yesterday though, with consumer staples and utilities in the lead, financed by most cyclicals.
FI&FX: The latter part of yesterday's trading session was dominated by sour risk sentiment, as equities gradually found new daily lows. Trump has announced that starting April 3rd, there will be a 25% tariff on US auto imports, at the same time downplaying the reciprocal tariffs set to be announced next week as "very lenient". He also opened a door for a tariff reduction on China in order to secure a deal for the sale of TikTok. EUR/USD, having initially traded heavy, recovered losses on the tariffs news and is back just shy of 1.08. Scandies defied the shaky sentiment and traded mostly sideways, with some downside on NOK/SEK. A quiet day for European rates, although the Swedish government announced plans to boost their defence spending by SEK300bn until 2030. The main event of today is Norges Bank's rate decision, where we still see a 25bp cut although it is a really close call.
Here We Dive Again
Sentiment soured for both US, European and Asian markets. The US tech stocks were particularly hit – without a new catalyser. Investors continued to step out on tariff worries, and the worries got worse when Trump announced that he would impose 25% tariffs on auto imports... both finished cars and auto parts. GM, which was having a good rebound since the beginning of the month, tanked more than 3%, Ford could weather the news better and closed flat while Tesla, which is both a tech company and a car maker, dived more than 5.5%. As such, the S&P500 lost 1% and returned below its 200-DMA after a strong fight to break the back of this resistance early this week, while Nasdaq 100 tanked 1.83%. The liquidity in the equities space is also draining, with Bloomberg warning that the most active contracts on the S&P500 have the lowest liquidity in two years. That, combined with the lack of appetite and bearish sentiment decreases predictability, increases volatility and the chances of a deeper downside correction in stocks.
The bearish sentiment across the US equities is now expanding into the European equities. The massive government spending being already priced in, European equity investors are faced with the ugly truth of the hectic tariff policies. The Stoxx 600 index retreated 0.70% on Wednesday on the back of the growing tensions into the April 2nd tariff deadline. But focusing on April 2nd doesn’t make sense. There will be a lot of April 2nds in the next four years.
Gold remains the most reliable hedge against the Trump tariffs.
The tariff talk’s impact on the US dollar has been surprisingly negative so far, but the dollar’s direction will likely depend on how the countries will respond to the US tariffs. If there is no retaliation, the US dollar could rebound on relief that the impact of the tariffs on American exports – hence the American growth - would be contained, while retaliation from the US’ biggest trading partners would further hammer the US growth prospects and weigh on the dollar.
The US will reveal the latest GDP update today. The US economy is expected to have slowed from above 3% to 2.3% in Q4 and the price pressures are expected to have increased. The combination of low growth, high inflation is bad for the market mood, both for equities and the dollar.
Before we go, the UK’s budget day went as smoothly as it potentially could go when you think that Rachel Reeves announced £14bn welfare cuts while increasing the military budget by an additional £2.2bn into 2027. The OBR, on the other hand, halved its 2025 growth forecast from 2% to 1%. But at the end of the day, investors looked reassured that the finances will be kept in check. The 10-year gilt yield first peaked but fell after the announcement, and Cable fell below the 1.29 mark but rebounded to trade above this level again this morning. Sterling erased early losses against the euro and is testing the 100-DMA this morning. That, to me, is a sign that the budget day went well. Rachel Reeves avoided a potential market turmoil. But whether the no-incident budget could give a sustainable support to sterling is yet to be seen. With spending and growth prospects looking much weaker, all hopes are on the Bank of England (BoE).
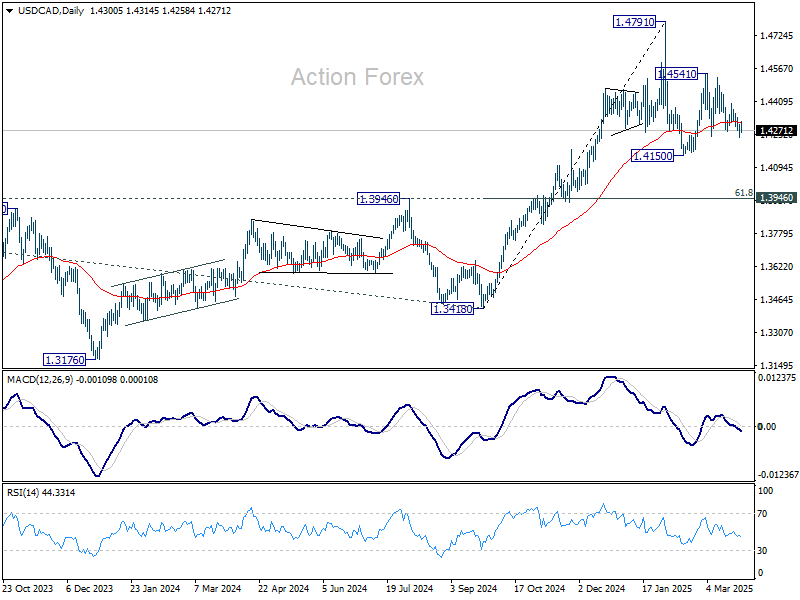
USD/CAD Daily Outlook
Daily Pivots: (S1) 1.4237; (P) 1.4268; (R1) 1.4300; More...
Intraday bias in USD/CAD is mildly on the downside at this point. Break of 1.4238 support will argue that corrective pattern from 1.4791 has already started the third leg. Deeper decline should be seen to 1.4150 support next. On the upside, above 1.4400 resistance will turn intraday bias neutral again first.
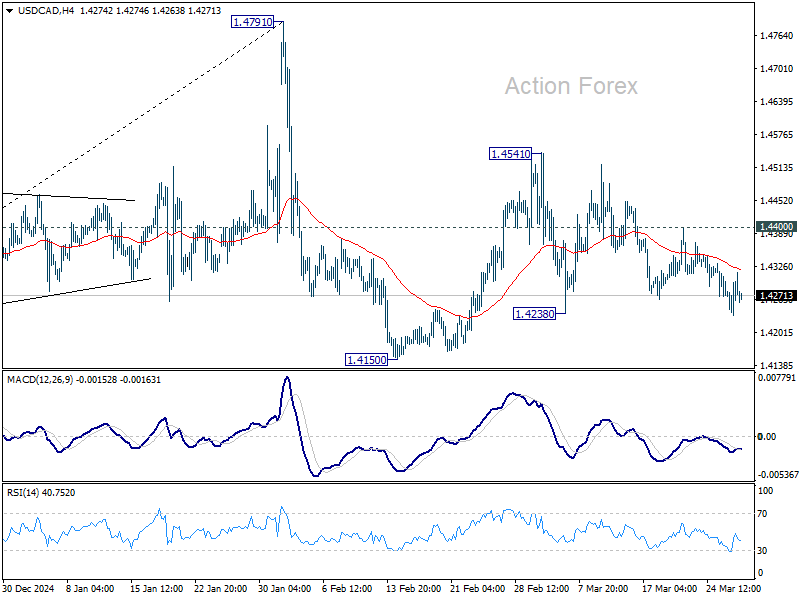
In the bigger picture, long term up trend is tentatively seen as resuming with prior breach of 1.4667/89 key resistance zone (2020/2015 highs). Next target is 100% projection of 1.2401 to 1.3976 from 1.3418 at 1.4993. This will remain the favored case as long as 1.3976 resistance turned support holds (2022 high), even in case of deep pullback.
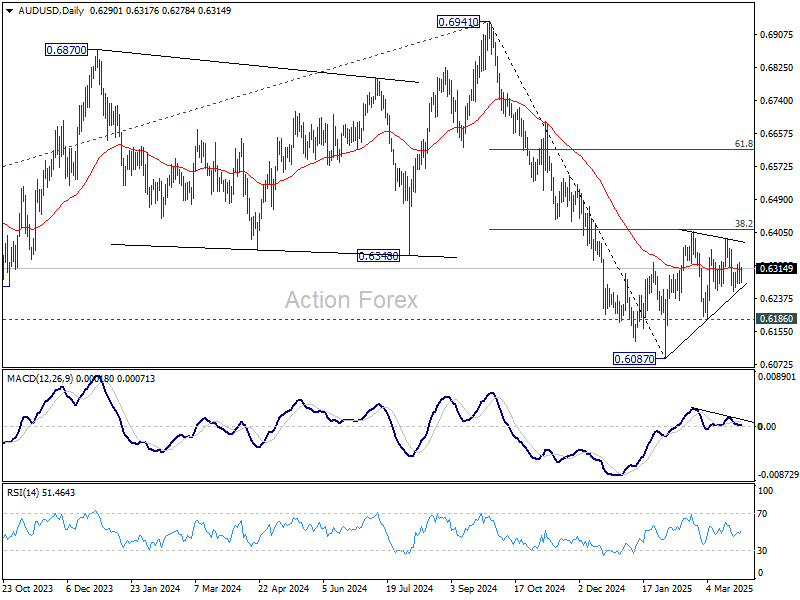
AUD/USD Daily Report
Daily Pivots: (S1) 0.6274; (P) 0.6302; (R1) 0.6327; More...
AUD/USD is extending the consolidation pattern from 0.6087 and i9ntraday bias stays neutral. On the downside, firm break of near term trend line support (now at 0.6266) will argue that the pattern has already completed. Intraday bias will be back on the downside for 0.6186 support. Further break there will solidify this bearish case and target 0.6087 low. For now, in case of another rise, upside should be limited by 38.2% retracement of 0.6941 to 0.6087 at 0.6413.
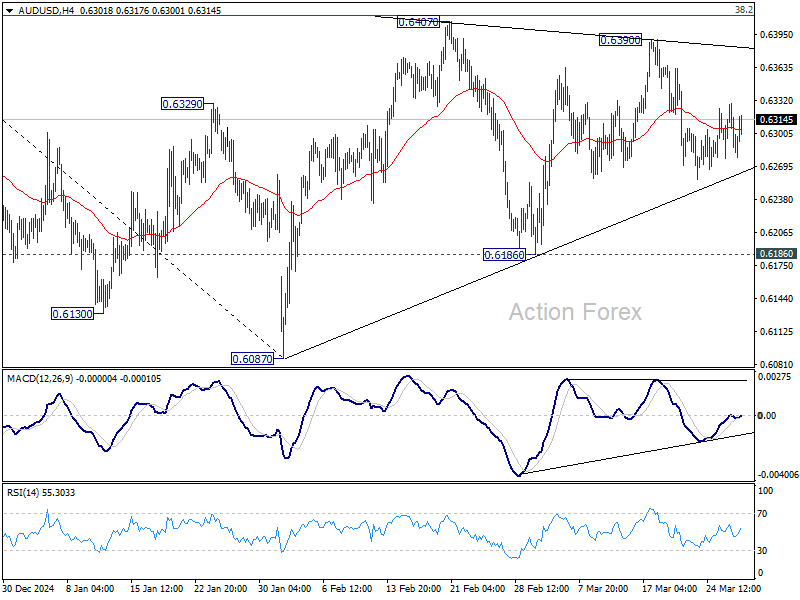
In the bigger picture, fall from 0.6941 (2024 high) is seen as part of the down trend from 0.8006 (2021 high). Next medium term target is 61.8% projection of 0.8006 to 0.6169 from 0.6941 at 0.5806. In any case, outlook will stay bearish as long as 55 W EMA (now at 0.6467) holds.
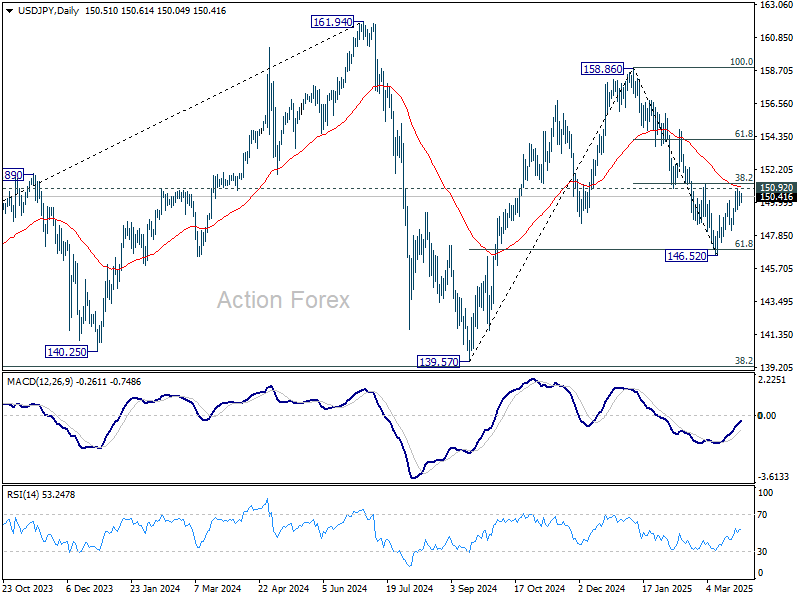
USD/JPY Daily Outlook
Daily Pivots: (S1) 149.33; (P) 150.14; (R1) 150.72; More...
Outlook in USD/JPY remains unchanged. Strong resistance is still expected from 150.92 to complete the corrective recovery from 146.52. On the downside break of 148.17 support will bring retest of 146.52 first. Sustained trading below 61.8% retracement of 139.57 to 158.86 at 146.32 will resume the fall from 158.86 to 139.57 support. However, firm break of 150.92 will argue that fall from 158.86 has completed and turn bias back to the upside for 154.79 resistance next.
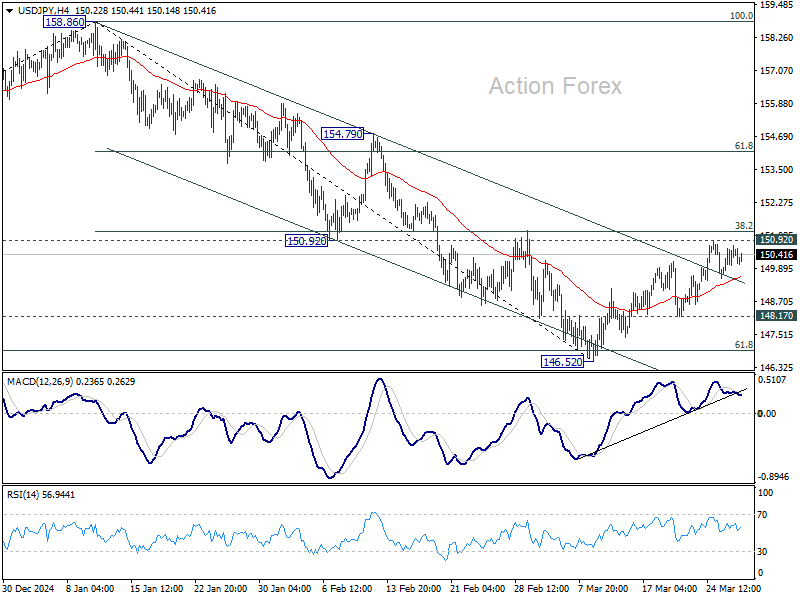
In the bigger picture, price actions from 161.94 are seen as a corrective pattern to rise from 102.58 (2021 low), with fall from 158.86 as the third leg. Strong support should be seen from 38.2% retracement of 102.58 to 161.94 at 139.26 to bring rebound. However, sustained break of 139.26 would open up deeper medium term decline to 61.8% retracement at 125.25.
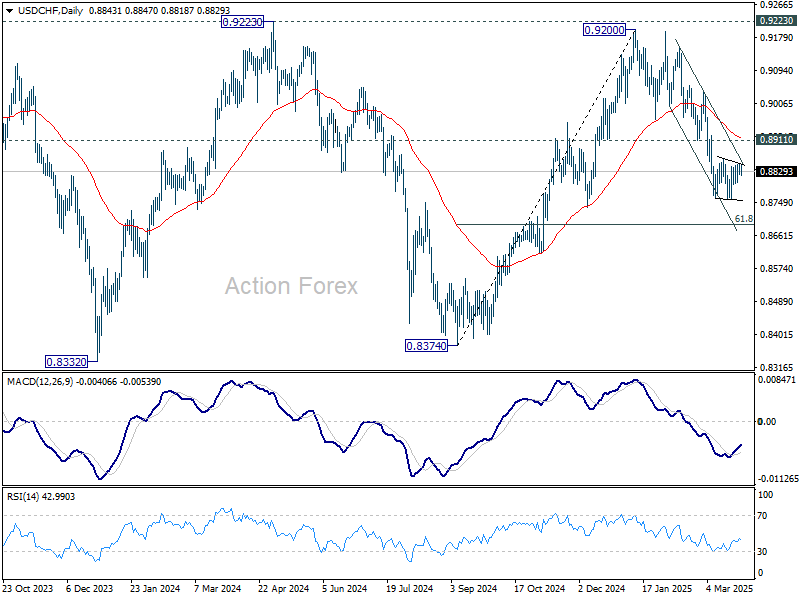
USD/CHF Daily Outlook
Daily Pivots: (S1) 0.8818; (P) 0.8834; (R1) 0.8855; More…
Intraday bias in USD/CHF remains neutral for the moment. Consolidation from 0.8757 could extend further. In case of stronger recovery, upside should be limited by 0.8911 support turned resistance. On the downside, break of 0.8757 will resume the fall from 0.9200 to 61.8% retracement of 0.8374 to 0.9200 at 0.8690. Sustained break there will pave the way back to 0.8374 support.
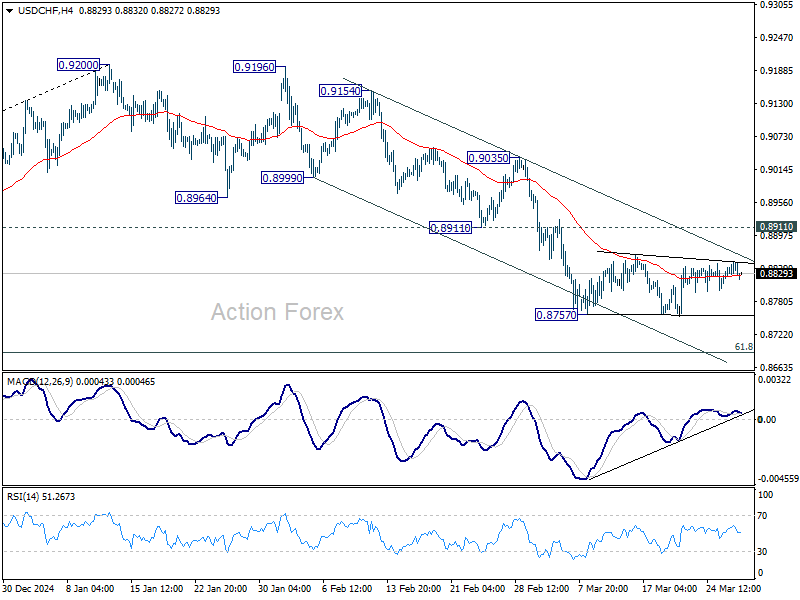
In the bigger picture, rejection by 0.9223 key resistance keep medium term outlook bearish. That is, larger fall from 1.0342 (2017 high) is not completed yet. Firm break of 0.8332 (2023 low) will confirm down trend resumption.
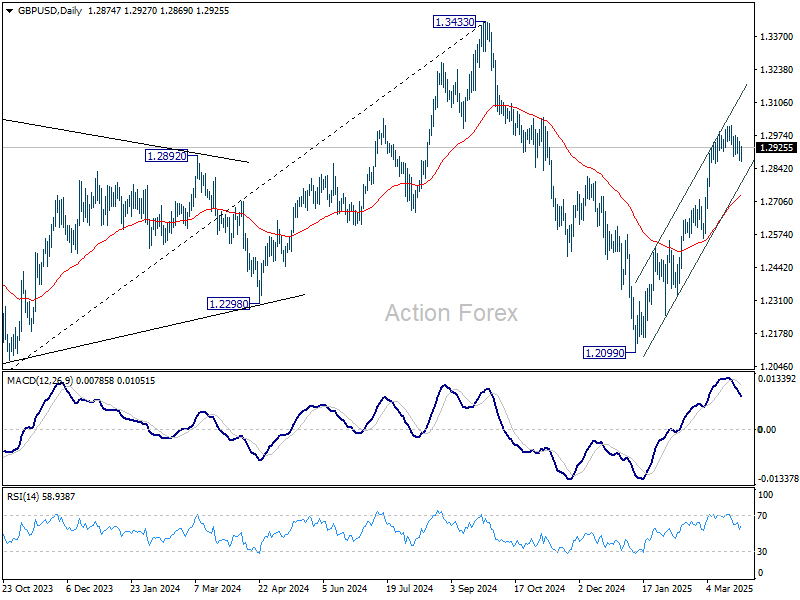
GBP/USD Daily Outlook
Daily Pivots: (S1) 1.2858; (P) 1.2905; (R1) 1.2935; More...
GBP/USD recovered again after brief dip to 1.2869 and intraday bias stays neutral. Correct fall from 1.3013 short term top could extend lower to near term channel support (now at 1.2792). . But downside should be contained by 38.2% retracement of 1.2248 to 1.3013 at 1.2721 to bring rebound. On the upside, break of 1.3013 will resume the rally from 1.2099.
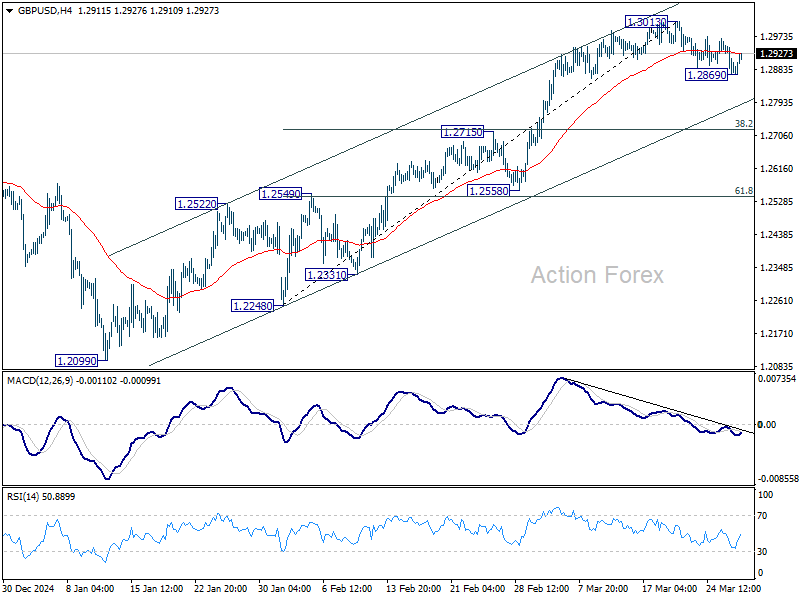
In the bigger picture, up trend from 1.3051 (2022 low) is not completed. Resumption is expected after corrective pattern from 1.3433 completes. Next target will be 1.4248 key resistance. This will now remain the favored case as long as 1.2099 support holds.
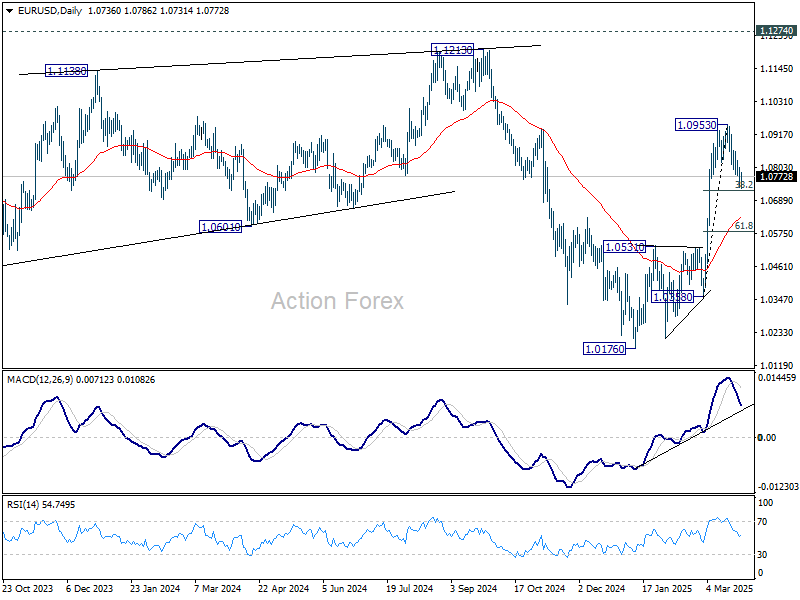
EUR/USD Daily Outlook
Daily Pivots: (S1) 1.0729; (P) 1.0767; (R1) 1.0789; More...
Outlook in EUR/USD is unchanged that strong support is expected from 38.2% retracement of 1.0358 to 1.0953 at 1.0726 to completion the correction from 1.0953. On the upside, break of 1.0857 will bring retest of 1.0953 first. Firm break there will resume larger rise from 1.0176. However, sustained break of 1.0726 will bring deeper correction to 55 D EMA (now at 1.0630).
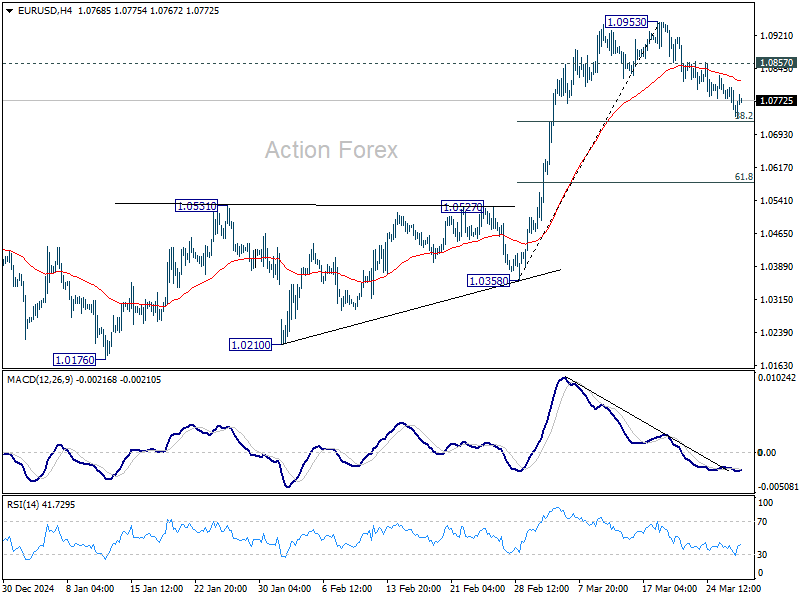
In the bigger picture, prior strong break of 55 W EMA (now at 1.0675) suggests that fall from 1.1274 (2024 high) has completed as a three wave correction to 1.0176. Rise from 0.9534 is still intact, and might be ready to resume. Decisive break of 1.1274 will target 100% projection of 0.9534 to 1.1274 from 1.0176 at 1.1916. Also, that will send EUR/USD through a multi-decade channel resistance will carries larger bullish implication. This will now be the favored case as long as 1.0531 resistance turned support holds.
Auto Tariff Hits Wall Street, But Currencies Shrug Off the Drip Feed
The steady drip of tariff news from US President Donald Trump continued overnight, pushing US equities lower and weighing on risk sentiment globally. The tech-heavy NASDAQ led the decline with a drop of over 2%, while broader US indexes also closed in the red. In Asia, Japan’s Nikkei and South Korea’s Kospi followed with notable declines—particularly in auto stocks—while other regional bourses stayed relatively steady, suggesting selective impact.
Despite the equity selloff, currency markets have shown muted reactions so far. Major FX pairs and crosses are treading water, largely trapped within yesterday’s ranges. This suggests that while traders are alert to the evolving trade policy, many are experiencing tariff fatigue and are reluctant to reposition aggressively before next week’s pivotal developments.
The latest tariff news centers around a 25% duty on imported cars and light trucks “not made in the United States,” scheduled to take effect on April 3. However, the rollout comes with key exemptions. Automotive parts compliant with USMCA are spared, and all other auto parts imports are exempt until May 3 to allow time for administrative clarity. It’s a classic case of shock softened by implementation ambiguity.
The centerpiece remains April 2, which Trump has dubbed “liberation day” and “the big one,” when reciprocal tariffs will be formally announced. However, in a shift of tone, Trump now says the measures will be “very lenient,” and “less than the tariff they’ve been charging (the US) for decades,” hinting at a softer-than-expected rollout. That may explain the relatively calm tone in FX markets despite the ongoing trade drama.
In terms of currency performance this week, Canadian Dollar is leading the charge along with commodity currencies. Aussie and Kiwi follow, while traditional safe havens like Yen and Dollar are under pressure. Euro joins them as one of the weakest, while Sterling and Swiss Franc are in the middle of the pack.
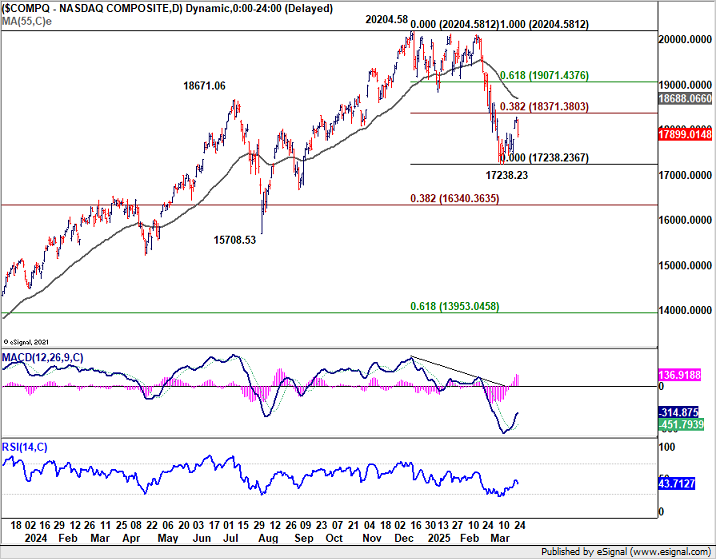
Technically, the selloff in NASDAQ overnight is just continuation of the near-term consolidation pattern from the 17238.23 low. Another bounce toward 38.2% retracement of 2024.58 to 17238.23 at 18371.38 remains possible. But strong resistance at the 55 D EMA (now at 18688.06) should cap upside. The larger correction from the 20204.58 peak is still expected to resume eventually, with a break below 17238.23 at a later stage.
In Asia, at the time of writing, Nikkei is down -0.97%. Hong Kong HSI is up 0.79%. China Shanghai SSE is up 0.23%. Singapore Strait Times is up 0.41%. Japan 10-year JGB yield is up 0.006 at 1.593, approaching 1.6% mark. Overnight, DOW fell -0.31%. S&P 500 fell -1.12%. NASDAQ fell -2.04%. 10-year yield rose 0.031 to 4.338.
Fed’s Musalem: Persistent tariff inflation could delay cuts or force hikes
St. Louis Fed President Alberto Musalem warned that while the initial effects of import tariffs may be short-lived, their broader inflationary impact could linger. He stressed concern that underlying inflation may be influenced more persistently than expected, and if so, Fed might have to consider a tighter policy stance.
Although this isn’t his baseline scenario, Musalem emphasized that the Fed must remain vigilant to second-round effects from tariffs.
He noted that if inflation stays above the 2% target and the economy remains strong, the current “modestly restrictive” monetary stance would need to be maintained longer.
More significantly, "If the labor market remains resilient and the second-round effects from tariffs become evident, or if medium- to longer-term inflation expectations begin to increase actual inflation or its persistence, then modestly restrictive policy will be appropriate for longer or a more restrictive policy may need to be considered," he said.
BoC minutes: Rate cut driven by tariff threats, signals no guidance amid uncertainty
BoC’s March 12 Summary of Deliberations revealed that the decision to cut the policy rate by 25 bps to 2.75% was driven primarily by "tariff threats and elevated uncertainty".
Governing Council members acknowledged that, under normal circumstances, holding the rate at 3% would have been appropriate. However, the impact of steel and aluminum tariffs, additional tariff threats, and the unpredictable stance of the US administration had begun to materially affect business and consumer decisions. This was "significantly weakening the near-term outlook".
Looking ahead, BoC emphasized the complexity of the situation and the fluid nature of trade tensions. "It would not be appropriate to provide guidance on the future path for the policy interest rate," the minutes noted.
Looking ahead
Eurozone M3 money supply is the only feature in European session. Later in the day, US will release Q1 GDP final, goods trade balance, jobless claims and pending home sales.
EUR/USD Daily Outlook
Daily Pivots: (S1) 1.0729; (P) 1.0767; (R1) 1.0789; More...
Outlook in EUR/USD is unchanged that strong support is expected from 38.2% retracement of 1.0358 to 1.0953 at 1.0726 to completion the correction from 1.0953. On the upside, break of 1.0857 will bring retest of 1.0953 first. Firm break there will resume larger rise from 1.0176. However, sustained break of 1.0726 will bring deeper correction to 55 D EMA (now at 1.0630).
In the bigger picture, prior strong break of 55 W EMA (now at 1.0675) suggests that fall from 1.1274 (2024 high) has completed as a three wave correction to 1.0176. Rise from 0.9534 is still intact, and might be ready to resume. Decisive break of 1.1274 will target 100% projection of 0.9534 to 1.1274 from 1.0176 at 1.1916. Also, that will send EUR/USD through a multi-decade channel resistance will carries larger bullish implication. This will now be the favored case as long as 1.0531 resistance turned support holds.
GBP/USD Eases Gains—Can US GDP Data Fuel Fresh Volatility?
Key Highlights
- GBP/USD started a downside correction from the 1.3000 resistance zone.
- It traded below a connecting bullish trend line with support at 1.2960 on the 4-hour chart.
- EUR/USD dipped below the 1.0850 and 1.0800 support levels.
- The US GDP could grow 2.3% in Q4 2024.
GBP/USD Technical Analysis
The British Pound struggled to continue higher above 1.3015 against the US Dollar. GBP/USD started a downside correction below the 1.2950 level.
Looking at the 4-hour chart, the pair traded below a connecting bullish trend line with support at 1.2960. The pair dipped below the 23.6% Fib retracement level of the upward move from the 1.2557 swing low to the 1.3014 high.
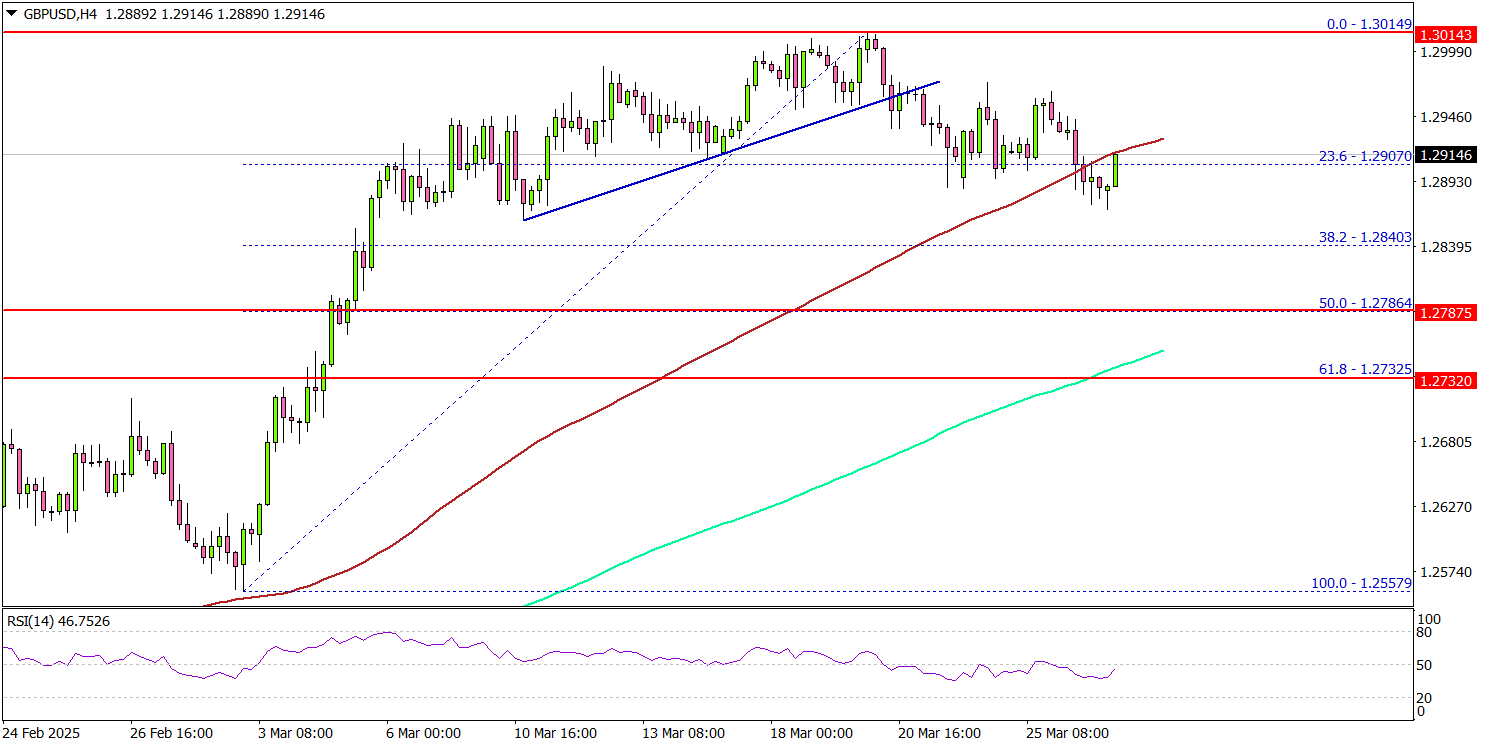
There was a move below the 1.2920 support and the 100 simple moving average (red, 4-hour), but the pair is still above the 200 simple moving average (green, 4-hour).
On the upside, the pair is facing resistance near the 1.2950 level. The next major resistance is near the 1.2980 level. The main resistance is now forming near the 1.3000 zone. A close above the 1.3000 level could set the tone for another increase. In the stated case, the pair could even clear the 1.3080 resistance.
On the downside, immediate support sits near the 1.2840 level. The next key support sits near the 1.2785 level and the 50% Fib retracement level of the upward move from the 1.2557 swing low to the 1.3014 high. Any more losses could send the pair toward the 1.2730 level.
Looking at EUR/USD, the pair started a short-term downside correction after the bulls failed to clear the 1.0950 resistance zone.
Upcoming Economic Events:
- US Gross Domestic Product for Q4 2024 – Forecast 2.3% versus previous 2.3%.
- US Initial Jobless Claims - Forecast 225K, versus 223K previous.