
Sample Category Title
US GDP Ticks Higher, British Pound Eyes UK Retail Sales
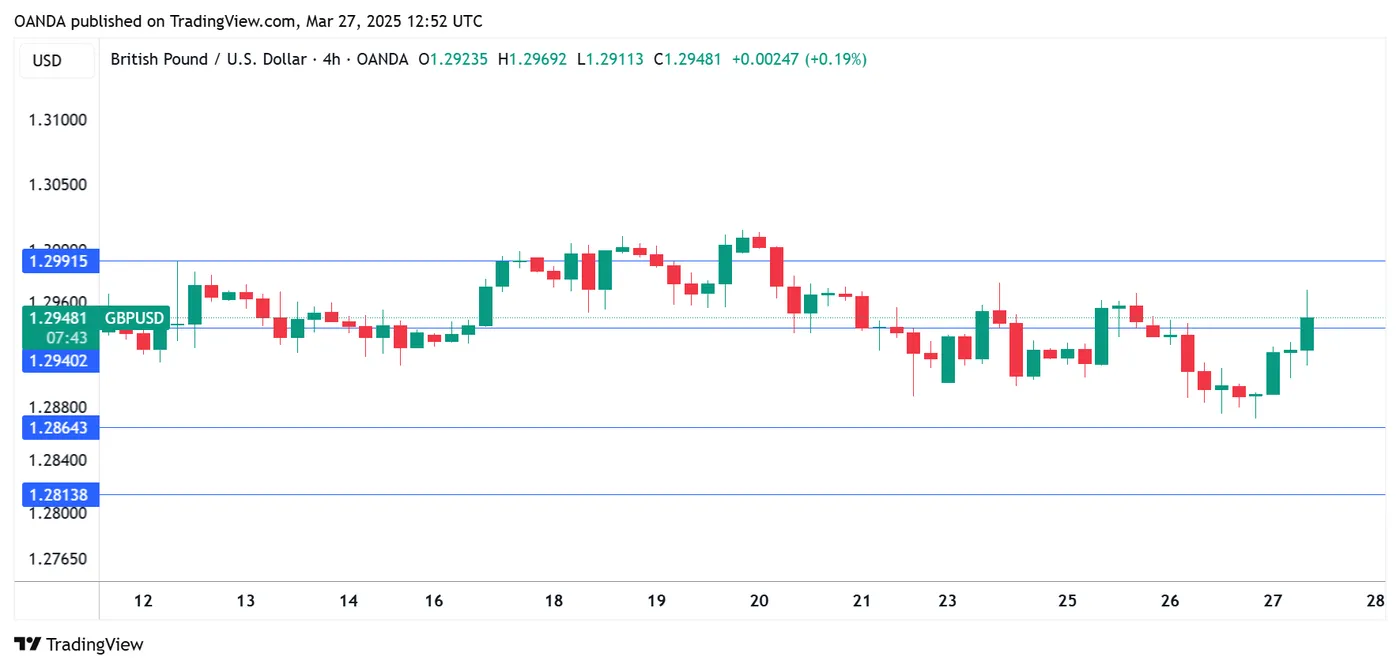
The British pound is higher on Thursday. In the European session, GBP/USD is trading at 1.2924, up 0.50% on the day.
UK retail sales expected lower for February
The UK releases the February retail sales report on Friday, with the markets bracing for a decline of 0.3% m/m. Retail sales soared 1.7% in January, crushing expectations and hitting the highest level since May 2024. Annualized, retail sales are expected to ease to 0.5%, down from 1% in January.
The Confederation of British Industry (CBI) reported a sharp drop in sales volumes in March, as the retail sales index fell to -41, down from -23 in February. This was the lowest reading since July 2024.
The CBI reported that retailers blamed the soft report on global trade tensions and the autumn budget have dampened consumer and business confidence, leading to reduced demand.
Businesses will see an increase in employers' taxes next month, which could lead to significant job losses, which in turn will hurt consumer spending.
The UK will also release final GDP data for the fourth quarter. The initial estimate showed that the economy expanded 0.1% after no growth in Q3. Annualized, the initial estimate came in at 1.4%, up from 1.0% in Q3. The final estimates are expected to confirm the initial readings, which would indicate that the UK economy continues to struggle.
US GDP ticks higher to 2.4%
In the US, Final GDP (3rd estimate) for the fourth quarter came in at 2.4% y/y, slightly higher unchanged than the 2.3% gain in the previous two estimates. This was down sharply from the 3.1% in Q3. The Federal Reserve is carefully monitoring the economy's slow decline and has signaled it will lower rates twice during the year.
GBP/USD Technical
- GBP/USD is testing resistance at 1.2940, followed by resistance at 1.2991
- 1.2864 and 1.2813 are the next support levels
USD/JPY Mid-Day Outlook
Daily Pivots: (S1) 149.33; (P) 150.14; (R1) 150.72; More...
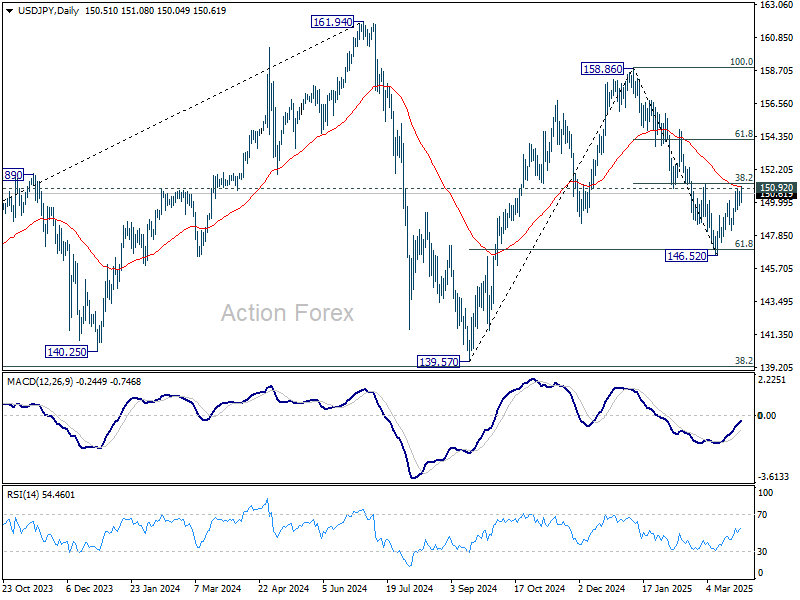
Intraday bias in USD/JPY remains neutral for the moment. Strong resistance is still expected from 150.92 to complete the corrective recovery from 146.52. On the downside break of 148.17 support will bring retest of 146.52 first. Sustained trading below 61.8% retracement of 139.57 to 158.86 at 146.32 will resume the fall from 158.86 to 139.57 support. However, firm break of 150.92 will argue that fall from 158.86 has completed and turn bias back to the upside for 154.79 resistance next.
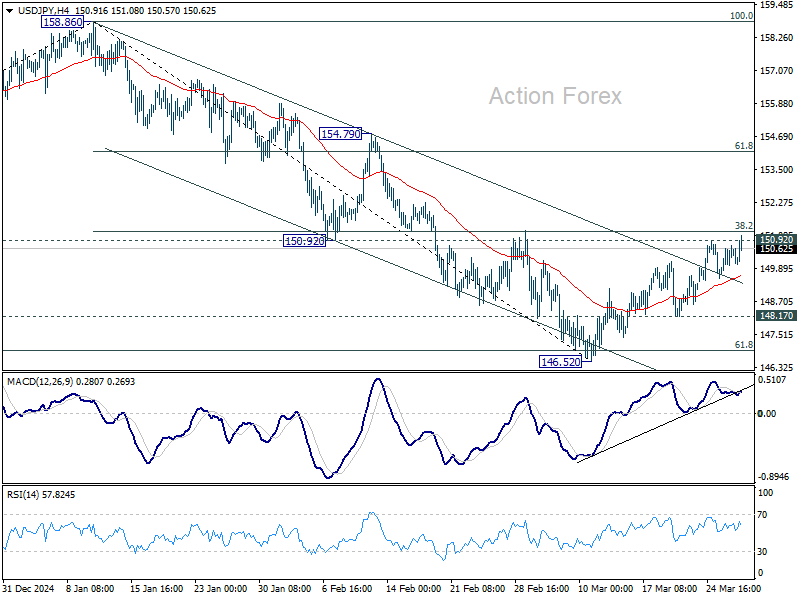
In the bigger picture, price actions from 161.94 are seen as a corrective pattern to rise from 102.58 (2021 low), with fall from 158.86 as the third leg. Strong support should be seen from 38.2% retracement of 102.58 to 161.94 at 139.26 to bring rebound. However, sustained break of 139.26 would open up deeper medium term decline to 61.8% retracement at 125.25.
USD/CHF Mid-Day Outlook
Daily Pivots: (S1) 0.8818; (P) 0.8834; (R1) 0.8855; More…
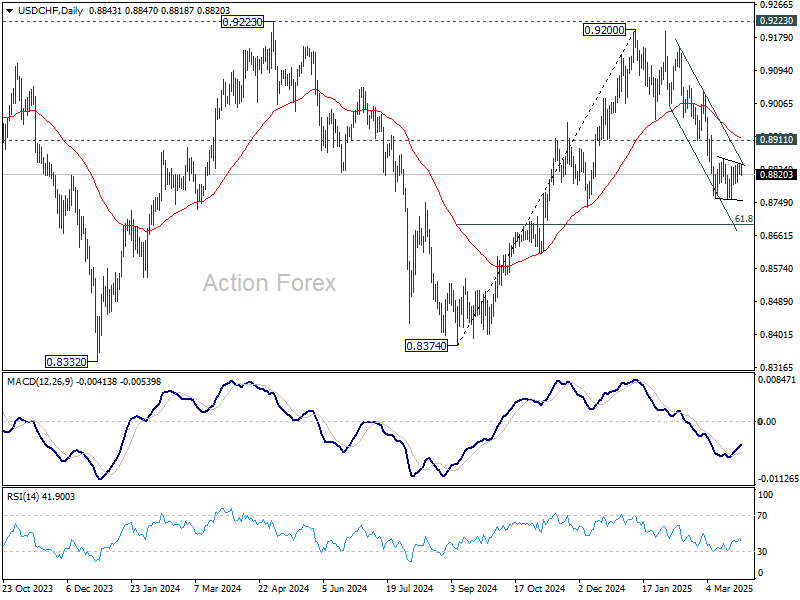
USD/CHF is still staying in consolidation above 0.8757 and intraday bias remains neutral. In case of stronger recovery, upside should be limited by 0.8911 support turned resistance. On the downside, break of 0.8757 will resume the fall from 0.9200 to 61.8% retracement of 0.8374 to 0.9200 at 0.8690. Sustained break there will pave the way back to 0.8374 support.
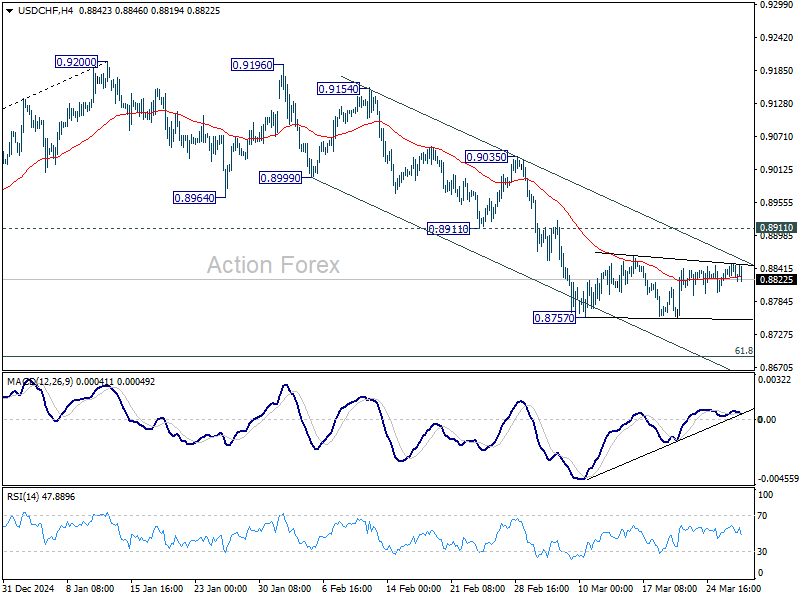
In the bigger picture, rejection by 0.9223 key resistance keep medium term outlook bearish. That is, larger fall from 1.0342 (2017 high) is not completed yet. Firm break of 0.8332 (2023 low) will confirm down trend resumption.
EUR/USD Mid-Day Outlook
Daily Pivots: (S1) 1.0729; (P) 1.0767; (R1) 1.0789; More...
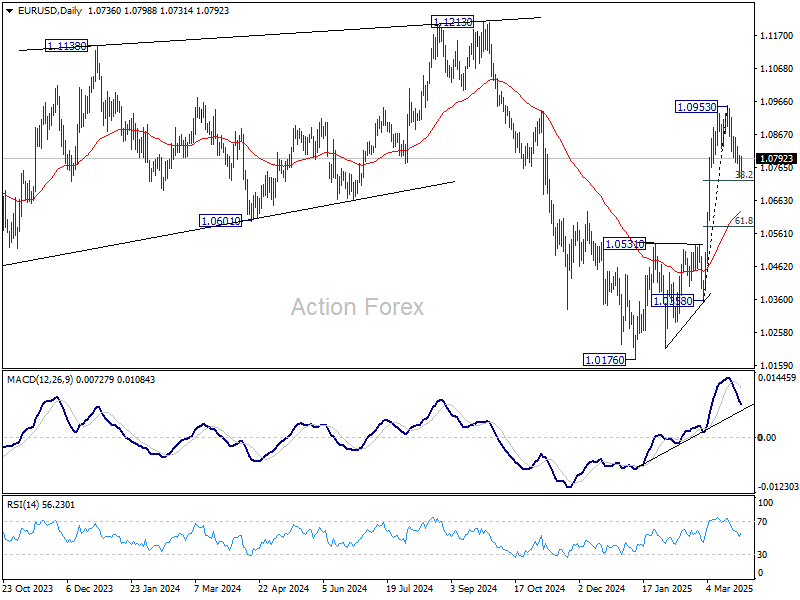
Intraday bias in EUR/USD is turned neutral with current recovery. Outlook is unchanged that strong support is expected from 38.2% retracement of 1.0358 to 1.0953 at 1.0726 to completion the correction from 1.0953. On the upside, break of 1.0857 will bring retest of 1.0953 first. Firm break there will resume larger rise from 1.0176. However, sustained break of 1.0726 will bring deeper correction to 55 D EMA (now at 1.0630).
In the bigger picture, prior strong break of 55 W EMA (now at 1.0675) suggests that fall from 1.1274 (2024 high) has completed as a three wave correction to 1.0176. Rise from 0.9534 is still intact, and might be ready to resume. Decisive break of 1.1274 will target 100% projection of 0.9534 to 1.1274 from 1.0176 at 1.1916. Also, that will send EUR/USD through a multi-decade channel resistance will carries larger bullish implication. This will now be the favored case as long as 1.0531 resistance turned support holds.
Sterling and Euro Rebound, Gold Jumps Amid Intensifying Trade Tensions
Global headlines remain focused on US President Donald Trump’s unfolding tariff regime. But traders are telling a slightly different story. FTSE and DAX slip into negative territory, but the pullback in equities remains limited. Sterling and Euro are both strengthening against Dollar indeed.
Tones out of London and Brussels are in stark contrast. UK Chancellor Rachel Reeves signaled a desire to avoid escalation, saying the UK has no intention to join the trade war at this stage. European Commission President Ursula von der Leyen struck a firmer stance, warning the US tariffs would harm businesses and consumers. EU also vowed retaliation with a “robust toolbox.”
So far, it appears that the bounce in EUR/USD and GBP/USD are mainly due to Dollar's own weakness. If anything, Dollar’s decline suggests traders might already be pre-positioning for next week’s announcement of reciprocal tariffs. But it’s hard to draw firm conclusions yet, especially with quarter-end portfolio adjustments likely distorting some of the price action across assets.
In the broader currency markets, commodity currencies remain firmly in control. Aussie has taken over as the week’s leader, followed by Loonie and Kiwi. At the other end of the spectrum, Yen remains the weakest. Euro and Dollar are trailing just ahead of Yen, while Sterling and Swiss Franc sit in the middle of the performance board.
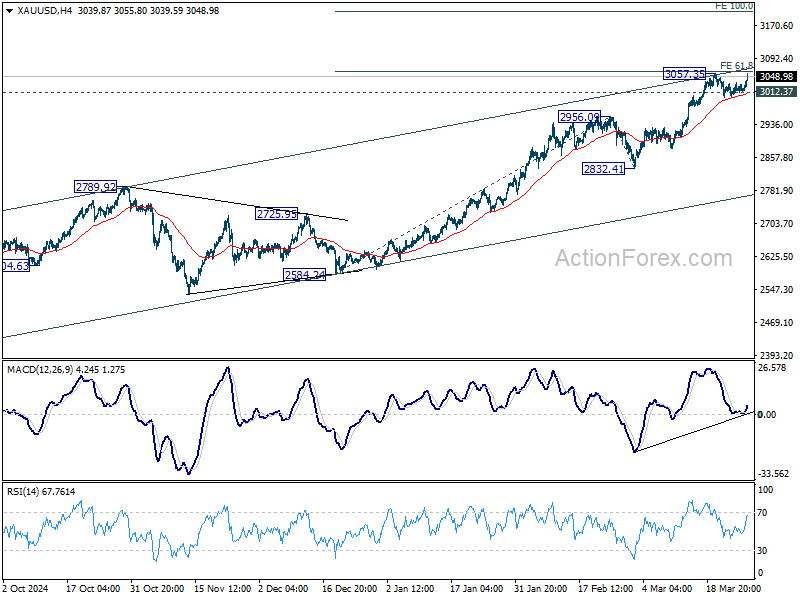
Technically, Gold is having a strong session, rebounding sharply as traders digest the latest trade rhetoric. Rise from 2832.31 might still have one more leg. But we'd maintain that upper channel resistance (now at around 3080) should post strong resistance to limit upside and bring correction. Break of 3012.37 support will bring deeper pull back to 2956.09 resistance turned support and below.
In Europe, at the time of writing, FTSE is down -0.84%. DAX is down -1.20%. CAC is down -0.72%. UK 10-year yield is up 0.058 at 4.791. Germany 10-year yield is down -0.026 at 2.774. Earlier in Asia, Nikkei fell -0.60%. Hong Kong HSI rose 0.41%. China Shanghai SSE rose 0.15%. Singapore Strait Times rose 0.45%. Japan 10-year JGB yield rose 0.005 to 1.592.
US initial jobless claims falls to 224k vs exp 225k
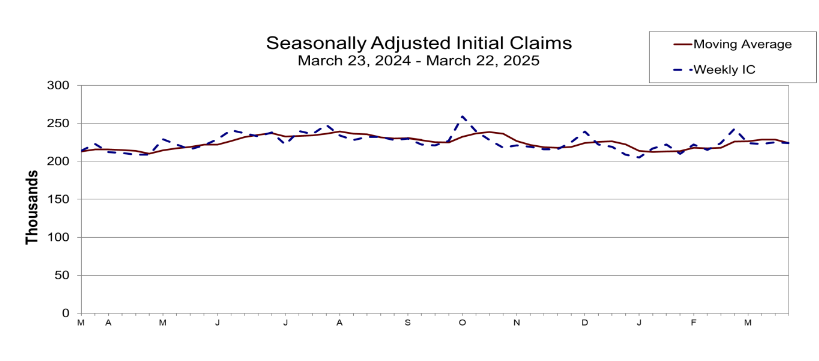
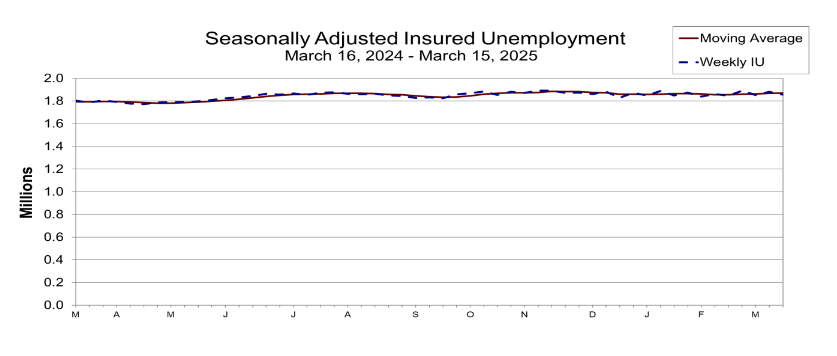
US initial jobless claims fell -1k to 224k in the week ending March 22, versus expectation of 225k. Four-week moving average of initial claims fell -5k to 224k. Continuing claims fell -25k to 1856k in the week ending March 15. Four-week moving average of continuing claims rose 2k to 1870k.
Also released, goods exports rose 4.1% mom to USD 178.6B, seasonally adjusted, in February. Goods imports fell -0.2% mom to USD 326.5B. Trade balance reported USD 147.9B deficit, larger than expectation of USD 134.6B.
Q4 GDP growth was finalized at 2.4% annualized. GDP price index was finalized at 2.3%.
ECB’s Wunsch: April rate pause should be on the table
Belgian ECB Governing Council member Pierre Wunsch suggested that pausing rate cuts in April should at least be “on the table”, and highlighted how tariff-induced stagflation poses a policy dilemma.
Wunsch warned that tariffs would complicate ECB’s path forward: “To the extent that tariffs will impact the economy … this will have an impact on our decision-making,” he noted.
While downplaying the immediate importance of April's tariff development, Wunsch stressed that "It’s going to have an impact over the medium term.”
In contrast, Latvian Governing Council member Martins Kazaks suggested that if ECB’s baseline scenario holds, a “gradual reduction in rates in the future” could be expected.
GBP/USD Mid-Day Outlook
Daily Pivots: (S1) 1.2858; (P) 1.2905; (R1) 1.2935; More...
GBP/USD rebounded notably today but stays in range below 1.3013 short term top. Intraday bias remains neutral first. Corrective fall from 1.3013 could still extend lower to channel support (now at 1.2806). But downside should be contained by 38.2% retracement of 1.2248 to 1.3013 at 1.2721 to bring rebound. On the upside, break of 1.3013 will resume the rally from 1.2099.
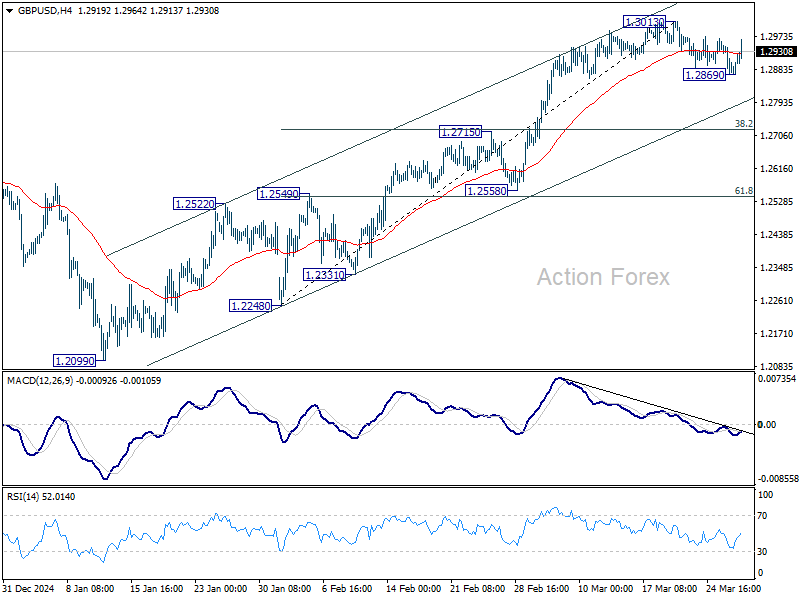
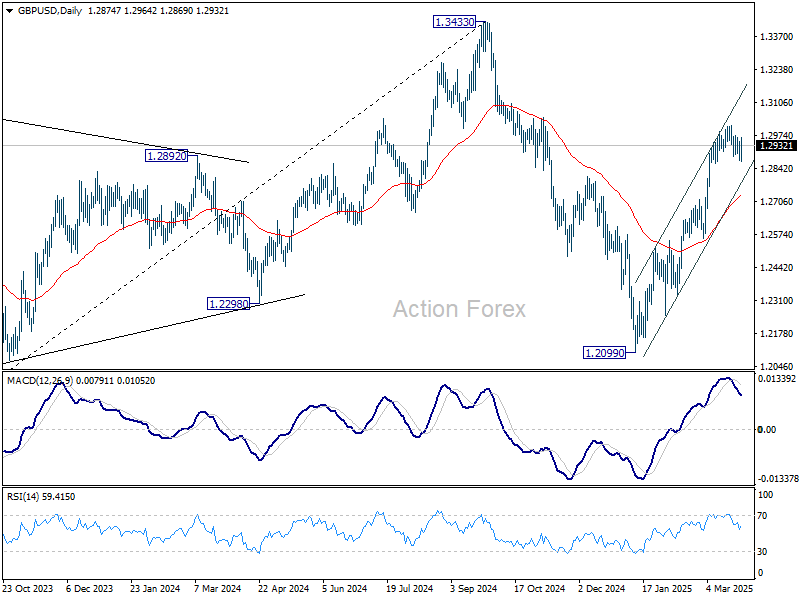
In the bigger picture, up trend from 1.3051 (2022 low) is not completed. Resumption is expected after corrective pattern from 1.3433 completes. Next target will be 1.4248 key resistance. This will now remain the favored case as long as 1.2099 support holds.
GBP/USD Mid-Day Outlook
Daily Pivots: (S1) 1.2858; (P) 1.2905; (R1) 1.2935; More...
GBP/USD rebounded notably today but stays in range below 1.3013 short term top. Intraday bias remains neutral first. Corrective fall from 1.3013 could still extend lower to channel support (now at 1.2806). But downside should be contained by 38.2% retracement of 1.2248 to 1.3013 at 1.2721 to bring rebound. On the upside, break of 1.3013 will resume the rally from 1.2099.
In the bigger picture, up trend from 1.3051 (2022 low) is not completed. Resumption is expected after corrective pattern from 1.3433 completes. Next target will be 1.4248 key resistance. This will now remain the favored case as long as 1.2099 support holds.
US initial jobless claims falls to 224k vs exp 225k
US initial jobless claims fell -1k to 224k in the week ending March 22, versus expectation of 225k. Four-week moving average of initial claims fell -5k to 224k. Continuing claims fell -25k to 1856k in the week ending March 15. Four-week moving average of continuing claims rose 2k to 1870k.
Also released, goods exports rose 4.1% mom to USD 178.6B, seasonally adjusted, in February. Goods imports fell -0.2% mom to USD 326.5B. Trade balance reported USD 147.9B deficit, larger than expectation of USD 134.6B.
Q4 GDP growth was finalized at 2.4% annualized. GDP price index was finalized at 2.3%.
Bears Stick to 200-Day MA
Market picture
The crypto market gained around 1.8% last week to $2.86 trillion. The strong rally on Sunday and Monday was replaced by a stall just below the 200-day moving average. This line acts as a long-term trend reference for large funds, which tend to sell below it and buy when the price is higher. The bears clearly don’t want to give up last month’s gains and are keeping the market from moving higher.
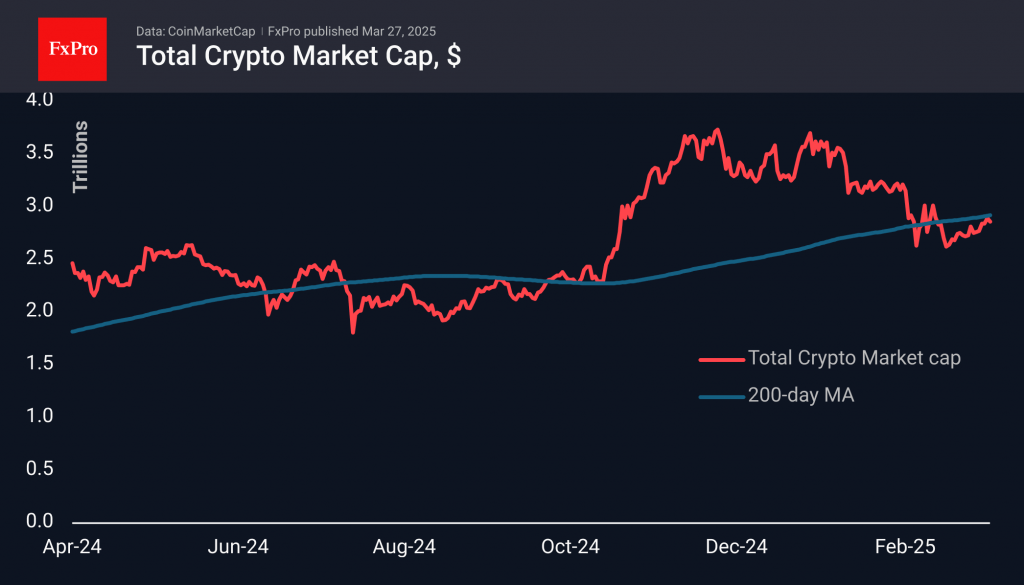
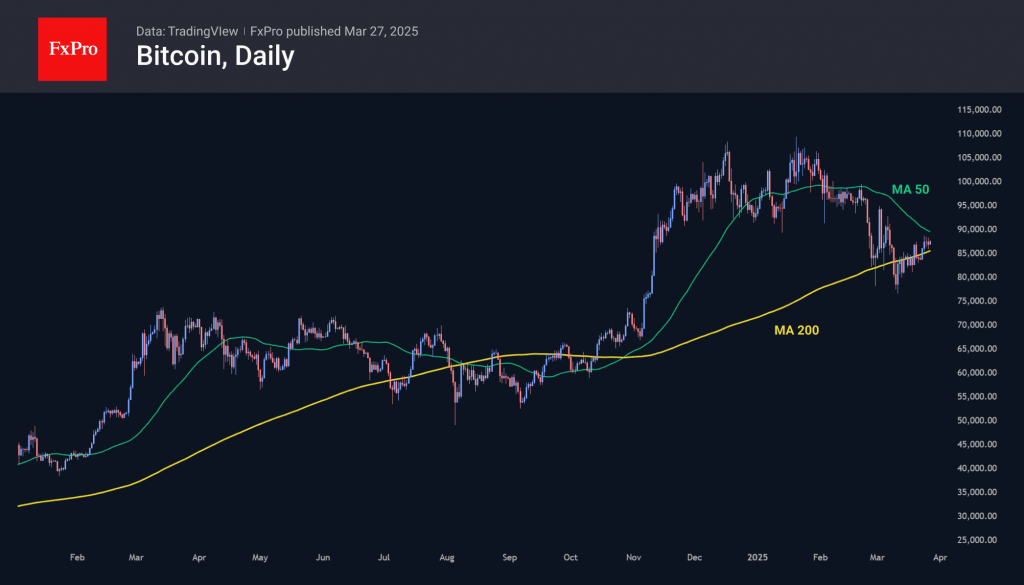
Bitcoin has been dancing around its 200-day MA for the past three weeks but has been trading steadily higher for the past few days despite preferring to stay in its shadow. This is a very positive sign of a change in long-term market sentiment. We also note that negative news from the stock market has become less of a concern for Bitcoin. At the same time, we believe that the acceleration in the growth of the first cryptocurrency should not be expected before a consolidation above the 50-day moving average. This acts as a medium-term trend signal line, passing close to 90,000. A consolidation above it could accelerate price growth and attract new buyers.
News background
Investor sentiment reflects the funding rate in perpetual bitcoin futures. Even after BTC rebounded above $87,000, the rate remains in the negative zone. This means that traders are not willing to pay a premium to open long positions.
The cost of borrowing stablecoins on lending platforms has fallen to around 4%, reflecting a reduced appetite for leverage and other strategies that require lending, confirming the market’s uncertain outlook.
The US SEC has closed its case against blockchain game developer Immutable. The firm received a Wells notice in October 2024. The regulator’s claims related to the company, its CEO, and its IMX ecosystem fund.
USDC’s stablecoin capitalisation exceeded $60bn for the first time, reaching a new all-time high. The figure has doubled over the year. USDC remains the second most popular stablecoin.
EUR/USD Faces Further Decline Amid Market Jitters and Trump’s Tariff Threat
The EUR/USD pair dropped to 1.0778 on Thursday, staging a modest correction but remaining under pressure amid deteriorating market sentiment.
Key drivers weighing on EUR/USD
The latest sell-off is driven by heightened trade war fears. On Wednesday, US President Donald Trump announced a 25% tariff on all imported cars and light trucks, set to take effect on 2 April. The move, seen as retaliation against foreign tariffs on US goods, escalates trade tensions. Markets view this as a major risk, with potential consequences including slower US economic growth and higher inflation.
Adding to the bearish sentiment, fresh economic data revealed:
- US consumer confidence plunged to a four-year low
- Core capital goods orders (excluding defence and aircraft) declined, breaking a three-month growth streak – a worrying sign for business investment
Investors now await Friday’s Core PCE Price Index – the Fed’s preferred inflation gauge – and the revised US Q4 2024 GDP estimate, which could set near-term market direction.
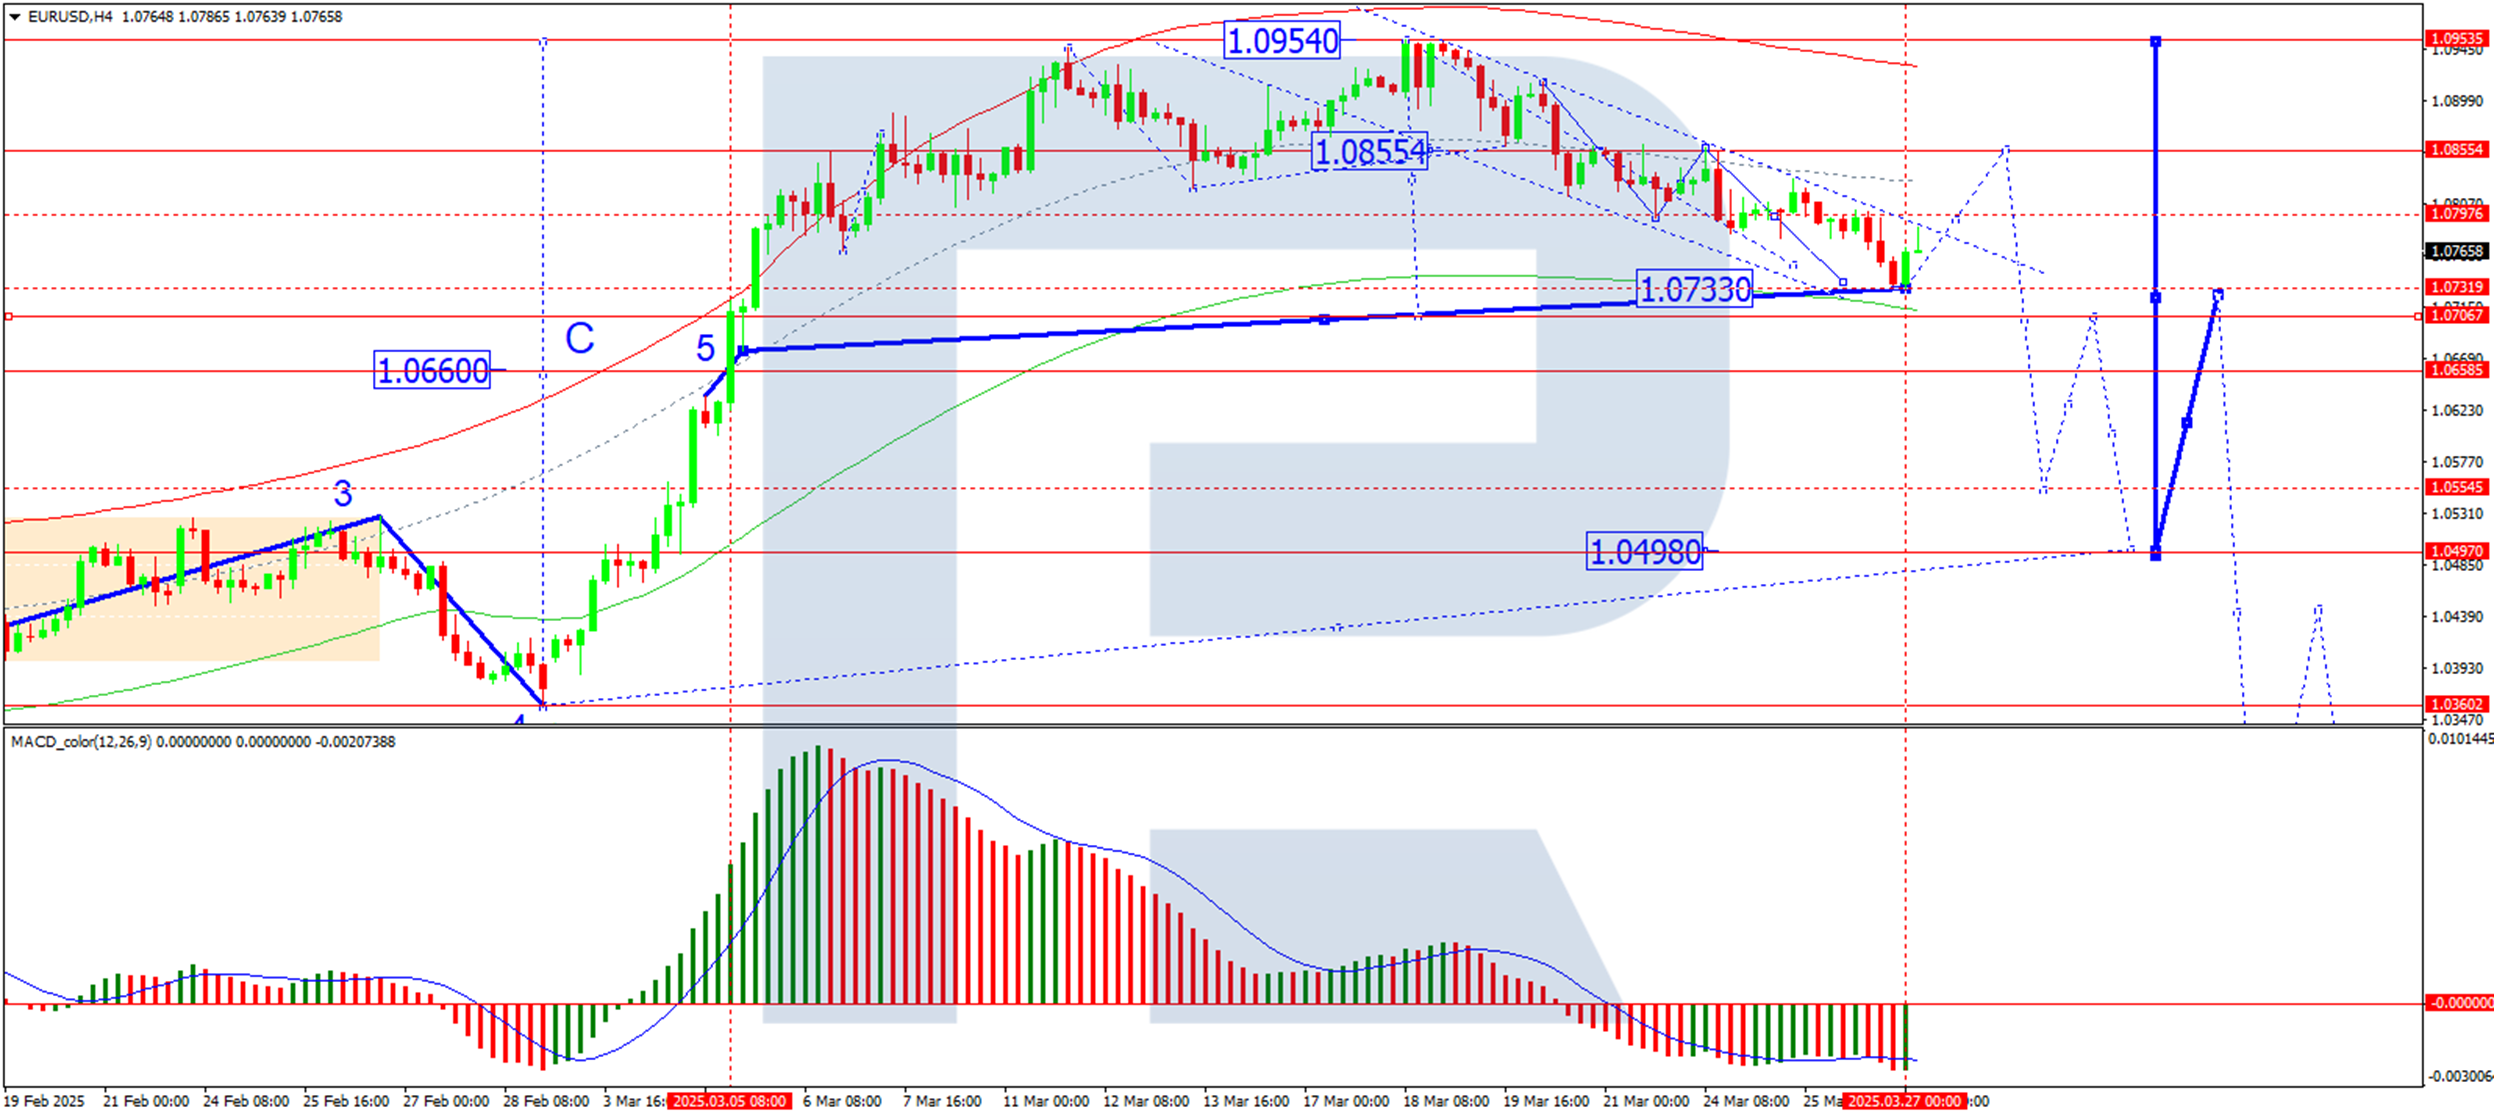
Technical analysis of EUR/USD
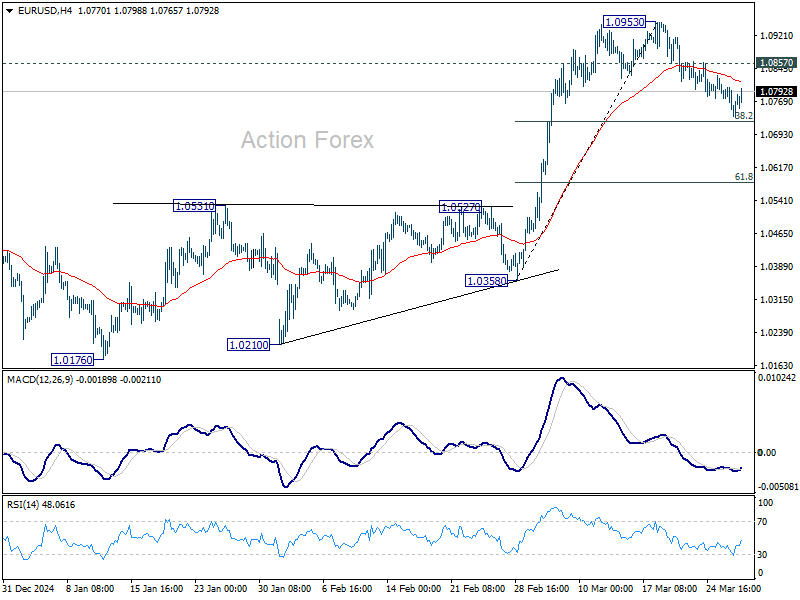
On the H4 chart of EUR/USD, the market completed a downward move to 1.0733. A correction towards 1.0855 is likely today. Once this correction ends, a new decline towards 1.0707 may begin. Technically, this scenario is confirmed by the MACD indicator: its signal line is below zero and pointing downward to new lows.
.
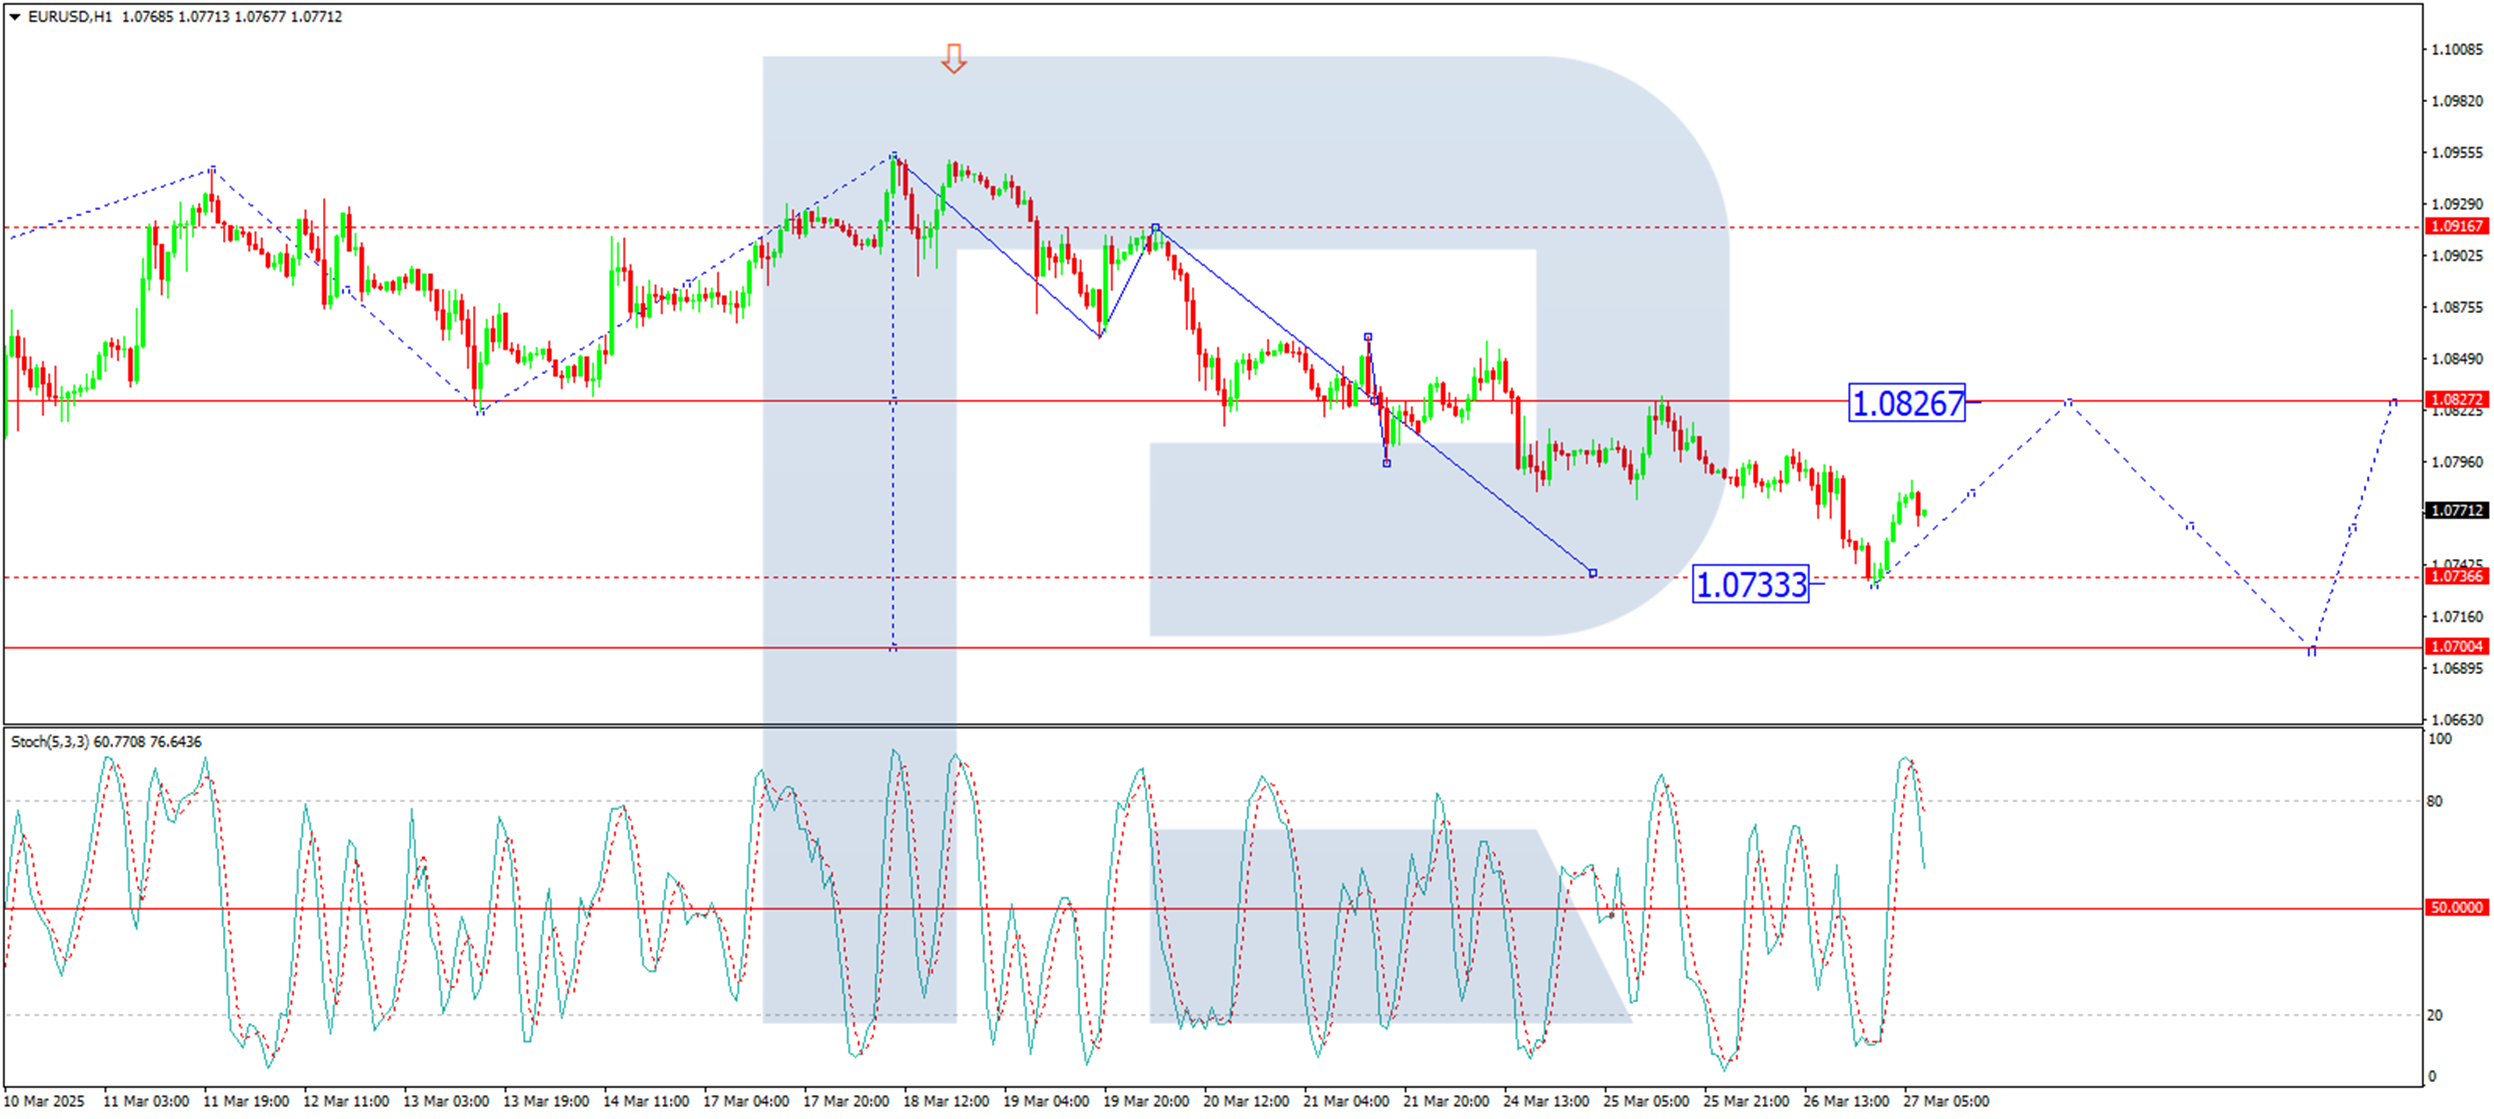
On the H1 EUR/USD chart, the market has formed a consolidation range around the level of 1.0826 before breaking lower to 1.0733. This move has nearly met its local downside target. Today, a corrective pullback towards 1.0826 (testing from below) is possible. Once this correction ends, a renewed decline towards 1.0700 could unfold. This move is viewed as the first wave of a broader downtrend. If this level is reached, another bounce towards 1.0826 cannot be ruled out. Technically, this scenario is confirmed by the Stochastic oscillator: its signal line is above 80 and preparing to drop towards 20.
Conclusion
With trade war risks weighing on sentiment and technical indicators pointing to continued downside, EUR/USD could test 1.0700 in the coming sessions. Traders should monitor US inflation data and GDP revisions for confirmation of the next major move.
Hang Seng Index Technical Outlook: At Risk of Multi-Week Corrective Decline Within Major Bullish Trend
- The major uptrend phase of the Hang Seng Index from January 2024 remains intact.
- Daily RSI momentum indicator suggested an overstretched rally where its medium-term uptrend may have reached a terminal point on 19 March.
- A multi-week corrective decline may take shape now, watch the 24,980 key medium-term resistance on the Hang Seng Index.
Since our last publication, the price actions of the Hang Seng Index have staged an up move towards the medium-term resistance zone of 24,400/24,980 and rallied by 15% to print an intraday high of 24,874 on 19 March.
Overall, the Hong Kong stock market is one of the stellar positive outperformers, together with European bourses, in the first quarter of 2025, riding on the coattails of China’s Artificial Intelligence (AI) “lower operational costs” theme play triggered by DeepSeek as well as the commitment of Chinese top policy makers to implement more expansionary fiscal policies to boost domestic consumption to reverse the ongoing deflationary spiral in the Chinese economy after the conclusion of the recent National People’s Congress meeting in early March.
K-shaped performance between Hang Seng Index & US stock indices may persist
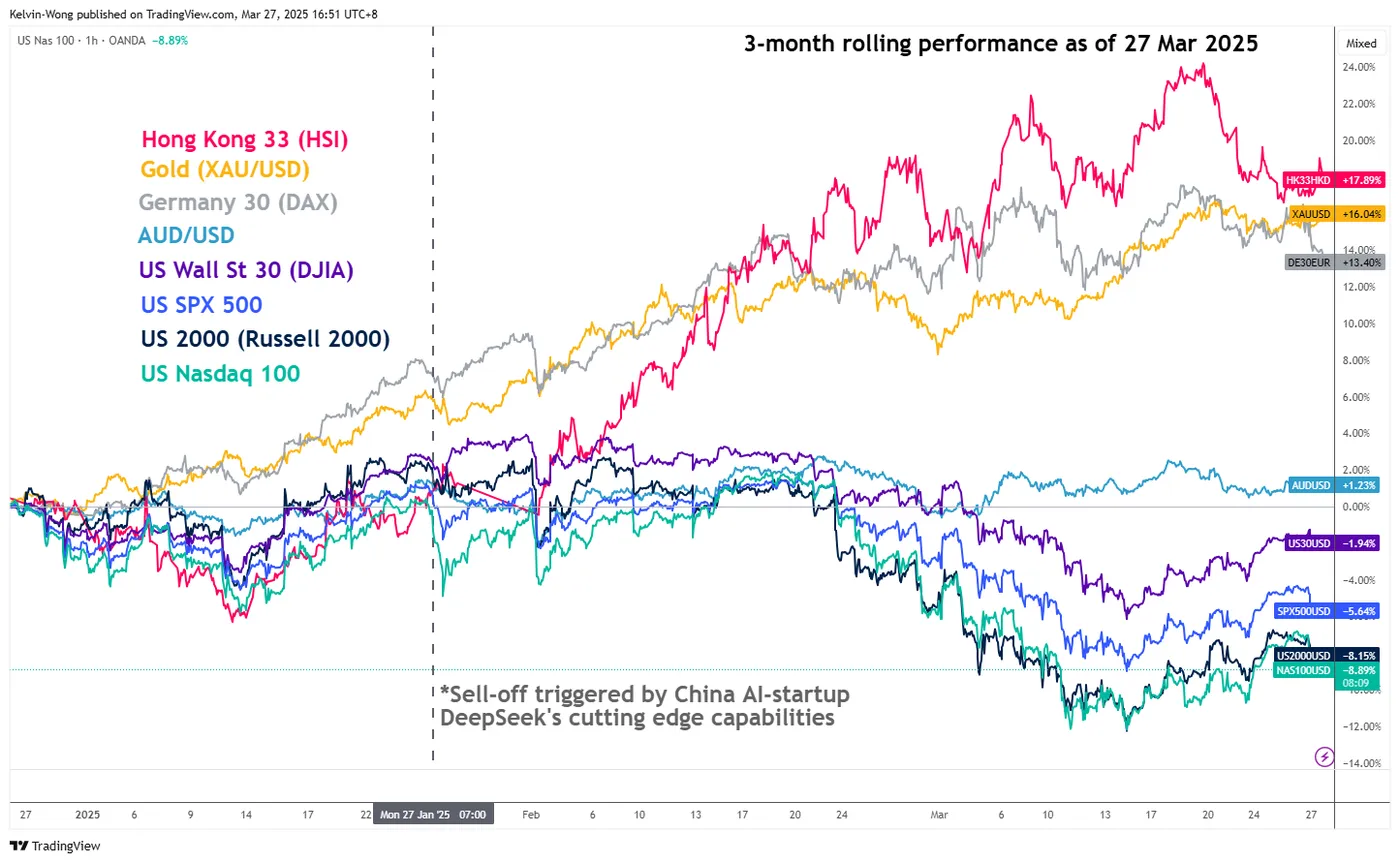
Fig 1: 3-month rolling performances of Hong Kong & US major CFD stock indices as of 27 Mar 2025 (Source: TradingView, click to enlarge chart)
The Hang Seng Index has recorded a positive Q1-to-date gain of 18% as of 26 March. In contrast, the benchmark US stock indices wobbled with a loss of 2.8% for the S&P 500 and a larger magnitude of -5.2% inflicted on the mega-cap technology-centric Nasdaq over a similar period due to rising stagflation risks in the US economy from trade tariffs.
A similar K-shaped performance can be seen as well between OANDA’s contract-for-difference (CFD) stock indices on the Hang Seng Index and the four major US benchmark stock indices based on a three-month rolling performance basis as of Thursday, 27 March at this time of the writing (see Fig 1).
Overstretched rally
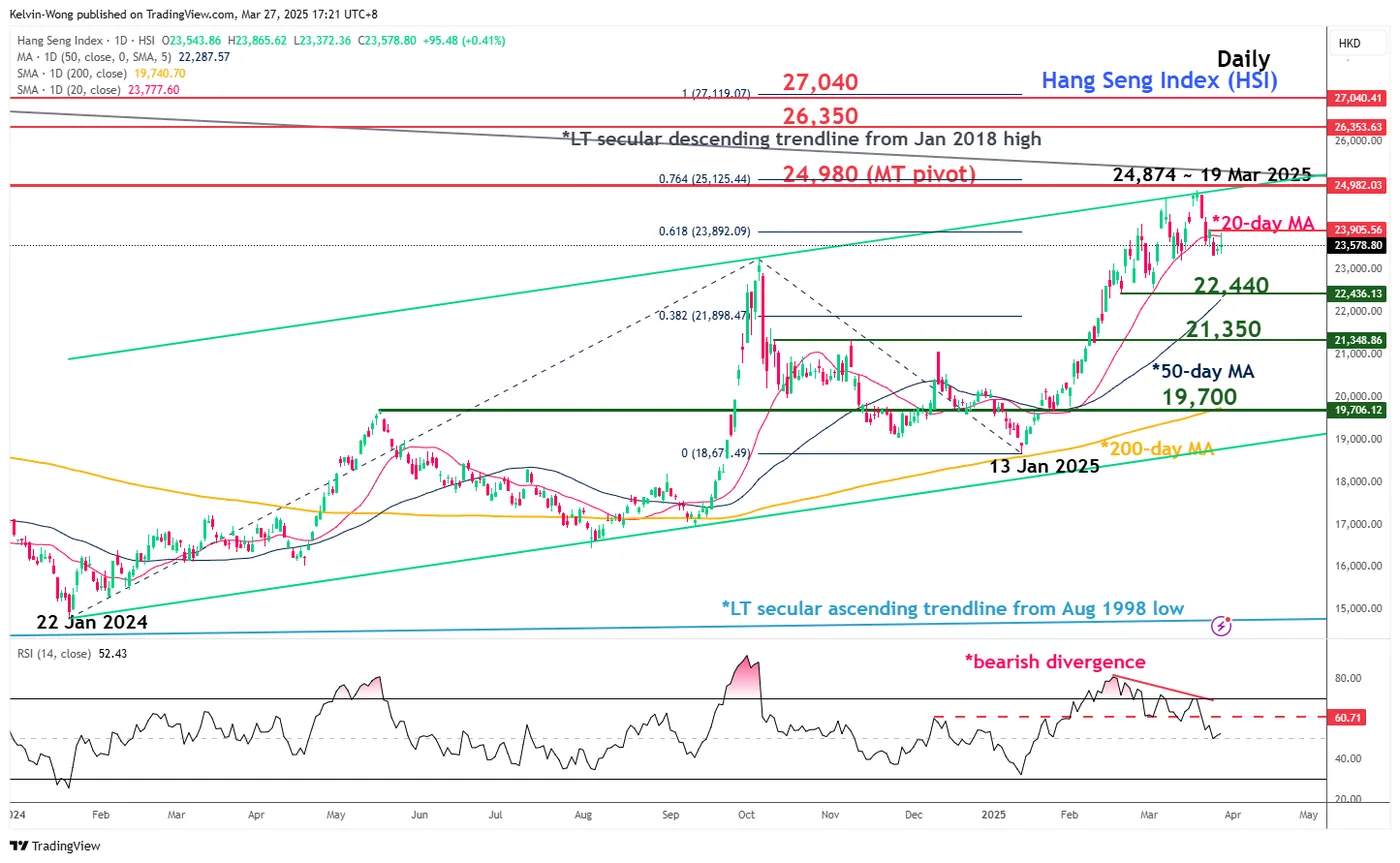
Fig 2: Hang Seng Index major & medium-term trends as of 27 Mar 2025 (Source: TradingView, click to enlarge chart)
In the lens of the technical analysis, price actions of highly liquid tradable instruments do not move vertically but rather oscillate within a broader trend phase.
The major uptrend phase of the Hang Seng Index since 22 January 2024 remains intact as it continues to trade above the rising key 200-day moving average.
The most recent three-month medium-term uptrend phase from 13 January low of 18,671 to 19 March high of 24,874 has reached an overstretched condition as depicted by the recent bearish divergence signal being flashed out by its daily RSI momentum indicator at its overbought region on 20 March.
In addition, its price actions have started to trade below its 20-day moving average since 25 March, which increases the odds that the three-month uptrend may have reached its terminal point on 19 March upon the bearish reaction off the upper boundary of the major ascending channel.
Watch the 24,980 key medium-term pivotal resistance on the Hang Seng Index, where it is likely to shape a potential multi-week corrective decline at this juncture to expose the medium-term supports at 22,440 and 21,350 before another impulsive up move sequence materialises (see Fig 2).
However, a clearance above 24,980 invalidates the bearish scenario for the bulls to take centre stage for the next medium-term resistances to come in at 26,350 and 27,040.