
Sample Category Title
When It All Unravels
Big trends win out in the end. New realities can take time to emerge, but when they do, things can break quickly. The US outlook is a case in point.
When we commented back in January that ‘Higher interest rates and a seemingly overvalued exchange rate. One can’t help thinking that reality will bite the US exceptionalism narrative sooner or later.’, we did not expect some of that reckoning to come so soon. The shift in sentiment – and its speed – illustrate two key features of a world shaped by evolving trends.
First, big trends win out in the end. The world changes, and anything that is not compatible with the evolving trend will eventually need to adjust to be in line with it.
Second, when the current reality rests in large part on people’s beliefs and behaviour, then the timing of a shift to be compatible with the new reality will be hard to predict. But when it happens, it can happen quickly. The collapse of communism in a so-called ‘preference falsification cascade’ is the canonical example. The shifting US narrative is a double-bump version of the same mechanism. First came the ‘vibe shift’ break from the prevailing sociopolitical norms following the election, and then the break of the US exceptionalism narrative in recent weeks. We don’t see that narrative coming back.
Moore’s law galore
One of the elements of the US exceptionalism narrative had been a bullish view of US dominance in AI and crypto, spurred on by actual and expected policy announcements. The presumption had been that the US would have an unassailable first-mover advantage. Its deep capital markets and depth of engineering talent complemented the access to data advantages of a handful of US-headquartered firms. DeepSeek’s release of its AI chatbot – particularly the decision to release the technology as open source – punctured that bubble. Yet an understanding of the economics of technological progress would tell you not to have believed in an unassailable advantage in the first place.
It is in the nature of technologies in the early, rapid phase of development that costs and prices decline quickly as technology advances. Compute-intensive technologies are especially vulnerable to this dynamic because of Moore’s Law, the empirical regularity that chips’ computing power doubles roughly every two years.
It is also in the nature of compute-intensive technologies that advances can sometimes occur in leaps. When your product is purely algorithmic, you are vulnerable to someone else coming along with a better algorithm, cutting costs and prices by an order of magnitude in the process.
Electricity shock treatment
This combination of rapid cost decline and occasional big leaps is not confined to obviously computer-oriented technologies. Genomics is another example: recall that the Human Genome Project cost about $US2.7 billion back in 2000 to sequence a single human genome. Nowadays, that cost is about $US1000, and people in the field talk about the $100 genome being not far off. Part of that cost decline lines up with Moore’s Law, but there have clearly also been some big leaps along the way. While this might seem like an esoteric example, the potential implications for health outcomes are profound.
An example with more obviously pervasive implications comes from the energy sector. The relative cost of renewable generation technologies continues to decline. And while some of the costs of different energy sources are a policy choice – think approval processes and safety standards – the underlying driver of this relative cost shift is technological.
Relatedly, it is easy to forget that technological progress also improves the efficiency of energy consumption. If you do, you can end up overcooking your forecasts of future energy demand (see Figure 5.1 in the Finkel Report, for example). New appliances are typically more energy efficient: for example, a new washing machine typically consumes about half the electricity used by a 15-year-old model. Improvements in insulation, logistics planning and other activities also matter. Here, too, there are the occasional leaps, such as the switch from halogen to LED, lowering energy consumption for lighting by an order of magnitude.
The exponential trends that emerge from these technological drivers are among the underpinnings of the adage that people overestimate the change that will occur over the next couple of years but underestimate the change that will occur over the next ten years.
If, suddenly, there is an alternative
The dynamics of technological change should have led to more scepticism about the technological elements of the US exceptionalism narrative. The financial market context has a similar ‘this can’t last’ flavour.
The US dollar is overvalued. That is the big trend that will win out. History would suggest that periods of exchange rate overvaluation eventually correct via depreciation, though it can take a few years. It is essentially impossible to say exactly when the next leg down will occur, especially as fiscal trends imply US rate differentials are likely to at least partly compensate for the growth risks. This overvaluation could therefore persist for a while, just not forever.
Another reason why the US dollar can stay overvalued for a while is that investors have a bit of a TINA problem: There Is No Alternative to US Treasuries. Investors feeling nervous about the prospect of a significant depreciation of USD-denominated assets over the next few years would need to invest in something else. So far, though, no other low-risk asset class has the size and depth of the US Treasury market that would allow it to be that alternative.
This is why some of the recent shifts in policy in Europe could have profound implications. European sovereign bonds are currently fragmented with different risks and circumstances. If that fragmentation were to diminish, European sovereign bonds would all be of comparable credit standing. Indeed, a structural shift in European debt dynamics could be underway already. Consider the growing issuance of pan-European bonds by the European Commission, the collective move to raise and co-ordinate defence spending across the continent, and success in narrowing fiscal divergences between member nations. If investors gain confidence in this longer-term evolution, we could see attitudes shift towards treating European bonds more like a single, deeper market – and thus a true alternative to Treasuries.
As recent weeks have shown, when human collective beliefs and decisions are involved, things can unravel much sooner and faster than you think.
USD/JPY Faces Obstacles on The Path Higher
Key Highlights
- USD/JPY struggled to continue higher above the 150.15 level.
- A connecting bearish trend line is forming with resistance at 150.00 on the 4-hour chart.
- GBP/USD could gain pace for a move above the 1.3000 resistance.
- Gold surged to another record high above the $3,040 zone.
USD/JPY Technical Analysis
The US Dollar declined heavily below the 152.00 level against the Swiss Franc. USD/JPY even spiked toward 146.50 before it found some support.
Looking at the 4-hour chart, the pair recovered some losses and traded above the 148.50 level. However, the bears were active near the 150.00 zone. A high was formed at 150.15 and the pair corrected lower.
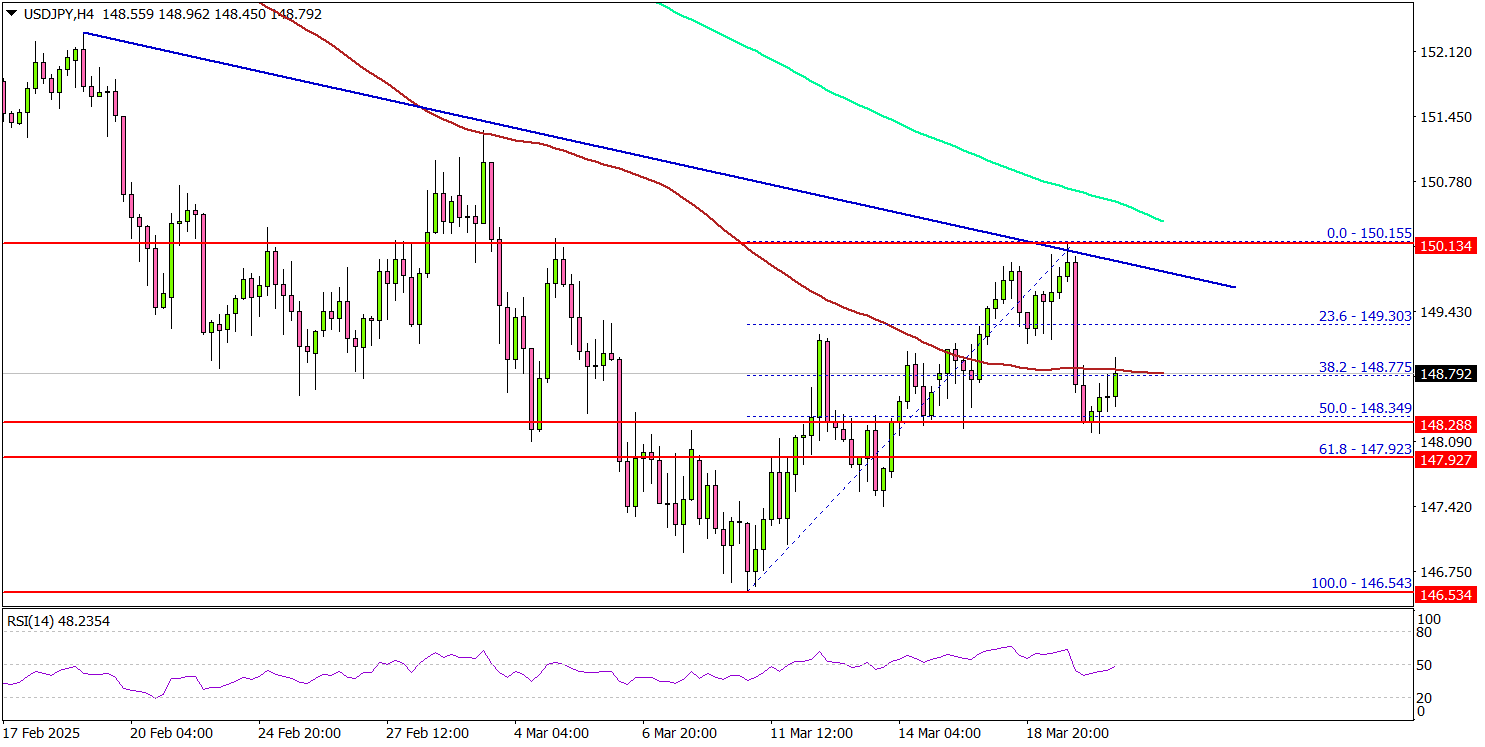
There is also a connecting bearish trend line forming with resistance at 150.00 on the same chart. The pair remained below the 100 simple moving average (red, 4-hour) and the 200 simple moving average (green, 4-hour).
On the upside, the pair is facing resistance near the 149.20 level. The next major resistance is near the 149.50 level. The main resistance is now forming near the 150.00 zone.
A close above the 150.00 level could set the tone for another increase. In the stated case, the pair could even clear the 151.20 resistance.
On the downside, immediate support sits near the 148.00 level. The next key support sits near the 147.40 level. Any more losses could send the pair toward the 146.50 level.
Looking at GBP/USD, the pair remains supported and might aim for a move above the 1.3000 resistance zone.
Upcoming Economic Events:
- Fed's Williams speech.
BoC Governor: Crucial to Stop Initial Tariff Price Shocks from Becoming Generalized Inflation
Bank of Canada Governor Tiff Macklem issued a stark warning on the economic consequences of prolonged US tariffs, emphasizing that broad-based and long-lasting trade barriers will depress Canadian exports, reduce overall output, and push consumer prices higher.
In a speech overnight, Macklem noted that the unpredictability of US tariffs, marked by "constant policy reversals", has injected significant uncertainty into the outlook for Canadian businesses and households.
Macklem highlighted two major areas of concern: uncertainty about which tariffs will be imposed and for how long, and uncertainty about their economic impact.
Already, the BoC has observed that businesses are cutting back investment and hiring, and many households are growing more cautious with spending. He warned that if broad-based tariffs remain in place, the result will be "less demand, less economic growth and higher inflation".
While monetary policy cannot prevent the initial rise in prices caused by tariffs, Macklem stressed that it must act to "prevent those initial, direct price increases from spreading".
"We must ensure that higher prices from tariffs do not become ongoing generalized inflation," he emphasized.
Brent Oil Price Update: Crude Reacts to Iran Sanctions & Potential US Tariffs
- Brent Crude prices are experiencing volatility due to conflicting factors: increased US crude inventories but decreased fuel supplies, new US sanctions on Iran, and potential US tariffs.
- The possibility of extending Chevron's license to operate in Venezuela is being considered.
- Technically, Brent Crude is trading within a tight range (70.18 - 72.39), with the RSI indicator suggesting potential momentum shifts.
Brent crude prices remain in a tight range this week as bears and bulls jostle for supremacy. The back and forth between bulls and bears continued today as a larger-than-expected drop in U.S. fuel supplies and rising tensions in the Middle East offset the impact of a stronger dollar.
U.S. government data revealed that distillate inventories, like diesel and heating oil, dropped by 2.8 million barrels last week, much more than the 300,000-barrel drop predicted in a Reuters poll. Meanwhile, U.S. crude inventories increased by 1.7 million barrels, surpassing the expected rise of 512,000 barrels.
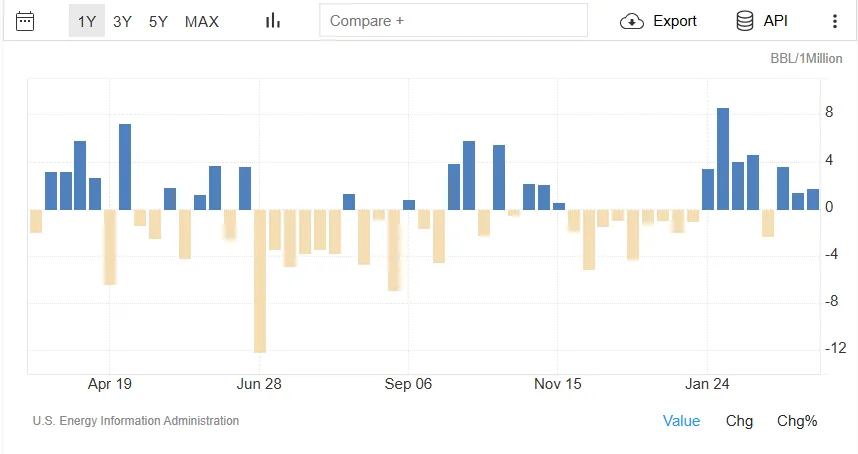
Source: TradingEconomics
There has been a slight jump in prices over the last hour or so as news filtered through that the US issued new Iran-related sanctions. The new sanctions related to Iran, targeting a person and several companies, including a small Chinese oil refinery, for buying and processing Iranian oil, according to the Treasury Department. Iran produces over 3 million barrels of oil per day.
Looking at recent developments and the chance that this move proves sustainable is rather slim. I am willing to stick my neck out and say that the choppy price action of late looks set to continue. Stimulus measures from China coupled with rising Geopolitical risk in the Middle East will keep Oil prices volatile.
There is also the proposed universal tariffs by the US due to be announced on April 2, 2025 which will also play a role. Depending on the scope of the tariffs this could have a negative impact on sentiment.
Chevron Venezuela Licence to be Extended?
President Donald Trump is thinking about allowing Chevron to continue operating in Venezuela, despite previously letting their sanction waiver expire earlier this year, according to the Wall Street Journal.
The idea of extending the waiver came up during Trump’s meeting with oil and gas executives at the White House on Wednesday. The president and his team are also discussing the option of placing tariffs on countries that buy Venezuelan oil. This move would aim to make it harder for China to expand its role in Venezuela’s oil industry.
Chevron has warned that if they leave Venezuela, China might step in to take their place. This argument appeals to Trump’s concerns about China’s growing influence.
Chevron has been sending about 240,000 barrels of Venezuelan oil to the U.S. every day under the waiver. This makes up a quarter of Venezuela’s total oil production.
Chevron also had big plans to increase exports from one of its projects, Petropiar, by 50% this year, reaching 143,000 barrels a day. These plans could move forward if President Trump agrees to replace some sanctions with tariffs and extends Chevron’s license.
Should this go ahead it will only add to concerns of oversupply which are already prevalent among many analysts and market participants.
Final Thoughts
Personally, I think this may be a bit premature. Oil inventory data shows the market is slightly under supplied in the early part of 2025. I think despite all the warning signs, there is a real possibility that supply and demand may remain balanced this year which could lead to long periods of Oil price consolidation moving forward.
Technical Analysis - Brent Crude
This is a follow-up analysis of my prior report “Brent Crude Update - Oil Prices Rally as EIA Reduces Oil Surplus Estimates” published on 12 March 2025.
From a technical analysis standpoint, Brent has remained confined to the range between 72.39 and 70.18 since March 12.
Oil continues to exhibit choppy price action with a bullish day usually followed up by a bearish day or an indecisive one.
Looking for signs of Oils next move and the RSI may be useful in this regard.
On the chart below, the period 14 RSI on a daily chart is approaching the neutral 50 level. A break above this level is usually a sign that momentum is shifting and this could help bulls push price out of the current range.
Immediate resistance at 72.39 before the 74.00 and 74.53 come into focus.
On the downside, support may be found at 70.18 before the 69.52 and 68.70 come into focus.
Brent Crude Oil Daily Chart, March 20, 2025
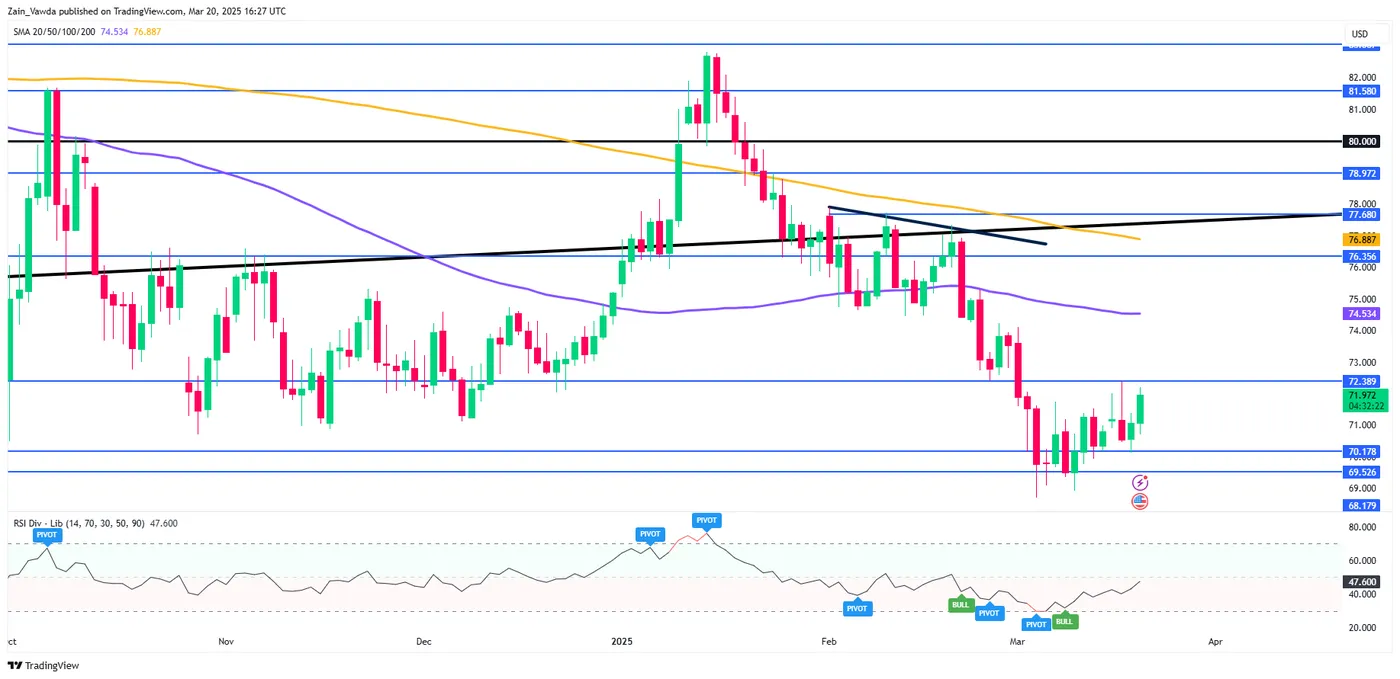
Source: TradingView
Support
70.18
69.52
68.70
Resistance
72.39
74.00
74.53
AUDNZD Wave Analysis
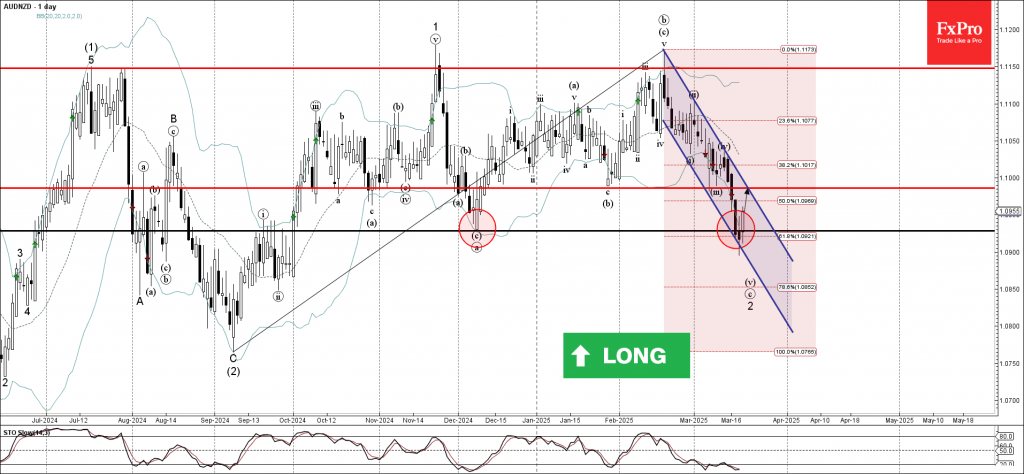
AUDNZD: ⬆️ Buy
- AUDNZD reversed from key support level 1.0930
- Likely to rise to resistance level 1.0985
AUDNZD currency pair recently reversed up from the support zone between the key support level 1.0930 (former multi-month from December), support trendline of the daily down channel from February and the lower daily Bollinger Band.
The upward reversal from this support zone will likely form the daily Japanese candlesticks reversal pattern Morning Star – if the pair closes today near the current level.
Given the strength of the support level 1.0930 and the oversold daily Stochastic, AUDNZD currency pair can be expected to rise to the next resistance level 1.0985.
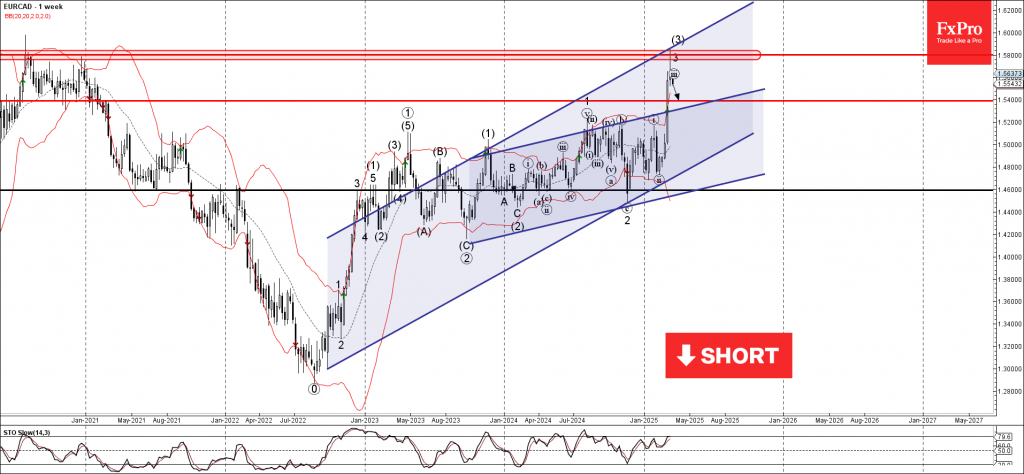
EURCAD Wave Analysis
EURCAD: ⬇️ Sell
- EURCAD reversed from the resistance zone
- Likely to fall to support level 1.5400
EURCAD currency pair recently reversed sharply from the resistance zone between the key resistance level 1.5800 (former major resistance from 2020) and the resistance trendline of the weekly up channel from 2022.
The downward reversal from this resistance zone will likely form the daily Japanese candlesticks reversal pattern Evening Star.
Given the strength of the resistance level 1.5800, EURCAD currency pair can be expected to fall to the next support level 1.5400.
Bank of England Review – Slow and Steady
- As expected, the BoE today kept the Bank Rate unchanged at 4.50%.
- The vote split was slightly to the hawkish side but we do not see this as a broad shift in sentiment within the MPC.
- Overall, the statement revealed that BoE still favours a "gradual" and "careful" approach to easing monetary policy whilst highlighting heightened uncertainty.
- The market reaction was modest with Gilt yields tracking slightly higher and EUR/GBP moving lower on the hawkish vote split.
As expected, the Bank of England (BoE) decided to keep the Bank Rate unchanged at 4.50% today. The vote split had a hawkish twist to it with 8 members voting for an unchanged decision and Dhingra voting for a 25bp cut.
The BoE retained its previous guidance noting that "a gradual and careful approach to the further withdrawal of monetary policy restraint is appropriate". As expected, the BoE highlighted the elevated uncertainty noting that "economic uncertainties, both globally and domestically, had risen recently". The BoE likewise kept the wording that "monetary policy will need to continue to remain restrictive for sufficiently long until the risks to inflation returning sustainably to the 2% target in the medium term have dissipated further". On the inflation front, the MPC flagged an increased focus on the pass through from wage growth to non-energy core goods, where focus has previously been centred around primarily service inflation.
Overall, we think the communication today supports our call of a continuous gradual approach to the cutting cycle. We expect the next 25bp cut in May with the Bank Rate ending the year at 3.75%. While we have previously highlighted that we saw the risks skewed towards a swifter cutting cycle in 2025, we now see the risk picture as more balanced.
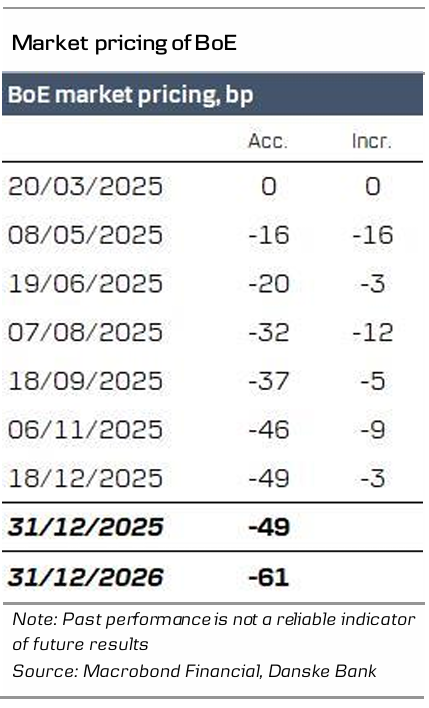
Rates. Gilt yields moved higher across the board on the hawkish vote split. Markets price 16p worth of cuts for May and around 50bp by YE 2025, cf. the margin table. We highlight the potential for BoE to deliver more easing in 2025 than currently priced, expecting three additional cuts this year with the next cut in May.
FX. EUR/GBP moved lower on the announcement with the hawkish vote split taking centre stage. The still cautious guidance delivered today highlights the more gradual approach of the BoE. More broadly, we expect EUR/GBP to move lower in the coming quarters driven by a relatively hawkish BoE compared to G10 peers, an investment environment characterised by continued tight credit spreads and a positive correlation for GBP to a USD positive investment environment (which we expect will return). While we continue to expect a growth pickup in the UK delivered from a fiscal boost, the shift in fiscal stance in Germany leaves the impact from the relative growth outlook more muted for the cross. The key risks are reignited debt concerns and a more forceful policy easing stance from the BoE.
Sunset Market Commentary
Markets
European markets took a different, more pessimistic view on yesterday’s Fed policy meeting compared to the US. They appear to have more attention to the (stagflationary) risks in the new forecasts instead of Powell’s reassuring message. European stocks dropped more than 1% with Wall Street suffering from spillover effects. But contrasting with the previous sessions, it’s US sentiment that now improved for the better. US equities quickly swapped losses for minor gains. Core bonds strengthened with Treasuries outperforming Bunds. US rates extend the post-Fed drop by declining 2.3-4.2 bps across the curve. They are off intraday lows though, helped by consensus-crushing existing home sales. Bunds had some catching up to do with Treasuries but were unable to post additional gains after gapping higher at the open. German yields ease between 1.6 and 3.7 bps against the backdrop of an important European summit on the matter of defense spending (and how to fund it), Ukraine and European competitiveness. Meanwhile several ECB members hit the wires, including president Lagarde. She stuck to the March message. Policy is “meaningfully less restrictive” and the ECB is data-dependent. Lagarde noted that elevated uncertainty (over trade) prohibits the ECB from committing to anything. Dutch governor Knot said the ECB is close to a neutral stance and is open-minded on the April decision. He cited uncertainty surround a range of sometimes opposing factors such as the impact from tariffs and the “budgetary expansion in the largest member state”. Estonia’s Muller believes tariffs pose upside risks while Portugal’s Centeno said it’s “more dubious”. USD and JPY take the lead on FX markets. EUR/USD slips to 1.083, DXY is testing 104. Sterling gains against the euro (EUR/GBP 0.835) after a slightly stronger than expected labour market report and the Bank of England’s status quo in a 8-1 vote. One member favoured a cut. Two members who voted for cuts at all three previous meetings today supported the halt, prompting a “hawkish pause” label to the decision. To hold the rate at 4.5% after February’s cut was a compromise between higher inflation and stronger-than-expected GDP growth versus “business survey indicators [that] generally continue to suggest weakness in growth and particularly in employment intentions.” Intensifying global trade policy uncertainty is obviously not helping in making a clearcut decision. So the BoE retained “a gradual and careful approach to the further withdrawal of monetary policy restraint […].” UK yields left the intraday bottoms (up to -7 bps) after the policy announcement and with a US-driven sentiment improvement now even trade flat.
News & Views
The Swedish Riksbank kept its policy rate unchanged at 2.25% and assesses that the rate will remain at this level going forward (over the policy horizon according to updated forecasts i.e. until 2028 Q1). That way, it officially puts an end to the cutting cycle that started slightly under a year ago at a policy rate of 4%. CPIF inflation has become higher than expected and is assessed to remain at between 2% and 3% for the rest of the year. The Swedish economy is in a recovery phase, but the rebound in the labour market will take a little longer. The overall growth and inflation outlook remains intact compared with December, which is obviously surrounded by a higher degree of uncertainty. The Executive Board stresses vigilance regarding contagion effects that could lead to inflation not falling back as expected. Today’s message didn’t really came as a surprise. EUR/SEK changes hands around 11.03. A reflationary-inspired euro helped avoid a break below the 11 support area earlier this month.
The Swiss National Bank lowered its key rate as expected by another 25 bps to 0.25%. The new inflation forecast has hardly changed since December. Without the rate cut, the forecast would have been lower in the medium term. It puts average annual inflation at 0.4% for 2025, 0.8% for 2026 and 0.8% for 2027, based on a 0.25% policy rate over the forecast horizon. That’s within the SNB’s 0%-2% inflation target. The SNB expects GDP growth of between 1% and 1.5% for this year and 1.5% in the next. Domestic demand is likely to benefit from rising real wages and the easing of monetary policy. Moderate economic activity abroad could dampen foreign trade. SNB President Schlegel added that today’s cut had an expansionary impact, implying a lower probability of more action down the road. The SNB will remain active in the FX market if necessary, but recently received some help from a stronger euro in battling CHF-strength. EUR/CHF trades around 0.9565 with the bottom of the broad 0.93-0.97 trading range in place since the start of last year becoming ever stronger.
USDCHF: Diverging Policies from the Fed and SNB – What to Expect?
USDCHF: What Do the Fed and the SNB Say?
The USDCHF has been at the centre of attention following the monetary policy decisions of the Federal Reserve (Fed) and the Swiss National Bank (SNB). What can we expect now?
The Fed Holds Rates, but the Dot Plot Gives Clues...
Yesterday, the Fed kept rates unchanged at 4.25%-4.5%, citing economic uncertainty and inflation risks. Powell mentioned concerns about tariffs and immigration restrictions.
The Dot Plot showed that most FOMC members expect only two rate cuts in 2025. This suggests that the Fed intends to maintain control over inflation and avoid loosening too quickly.
The SNB Cuts Rates… and Could Keep Going
Meanwhile, the SNB surprised the market by reducing its interest rate by 25 basis points, bringing it to 0.25%, its lowest level since 2022. This is the fifth rate cut since 2024, signalling concerns over low inflation and economic risks.
Additionally, the SNB clarified that it is still ready to intervene in the forex market if necessary.
What Happens Next with USDCHF?
The divergence is clear: the Fed remains cautious with rate cuts, while the SNB continues to loosen its monetary policy. This could support USDCHF in the short term, although volatility will depend on upcoming macroeconomic data and market sentiment.
Will the dollar rebound, or will the Swiss franc resist? Stay tuned for the next moves!
Technical Analysis - USDCHF, H4
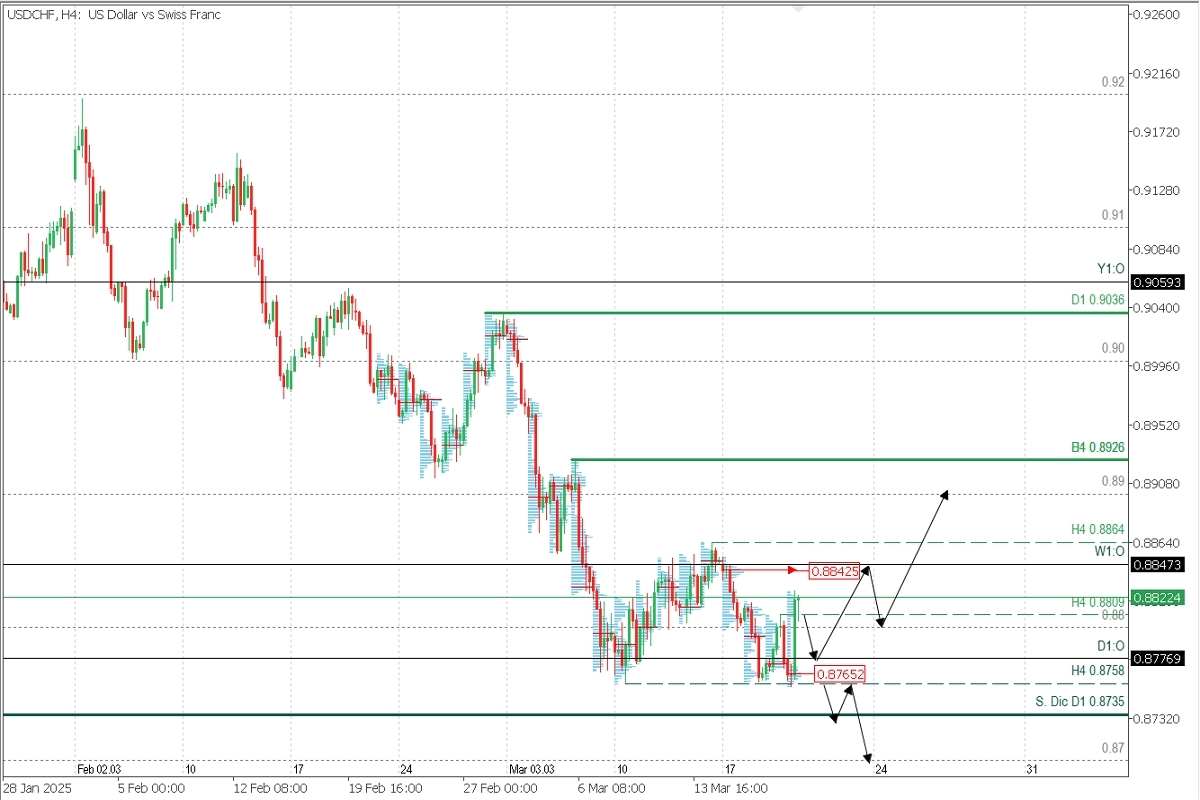
Supply Zones (Sell): 0.8842 // 0.89
Demand Zones (Buy): 0.8765
The recent SNB rate cut was the main driver of the price rally during the European morning, causing a breakout of the key H4 resistance at 0.8809, leaving a wide-range bullish candle with inefficiency (volume void) that the market typically corrects.
In this context, a pullback is expected to cover that area, seeking liquidity at the daily open (D1:O) 0.8776 and the Asian POC at 0.8765, demand zones (buy) that will likely be defended by bulls to trigger a new price rally towards the next supply zone at 0.8842, confirming the intraday bullish reversal. Only after breaking this level can we consider extending buys towards 0.89 and the next daily key resistance at 0.8926.
On the other hand, if the demand zone between 0.8776 and 0.8765 is decisively broken, the bullish trend will continue, as an increase in sell orders will likely lead to a break below December's support at 0.8735, extending the decline towards the psychological level at 0.87.
Technical Summary
- Bearish Scenario: Sell below 0.8809 with targets at 0.8777 and 0.8765, where we could return to buy if an intraday bullish reversal pattern forms on M5. If this doesn’t occur, sales will continue towards 0.8735 and 0.87 in extension.
- Bullish Scenario: Buy above 0.870 (waiting to form and confirm a reversal pattern on M5) with targets at 0.8842, 0.8864, and 0.89 in extension.