
Sample Category Title
(BOE) Bank Rate maintained at 4.5%
Monetary Policy Summary, March 2025
The Monetary Policy Committee (MPC) sets monetary policy to meet the 2% inflation target, and in a way that helps to sustain growth and employment. The MPC adopts a medium-term and forward-looking approach to determine the monetary stance required to achieve the inflation target sustainably.
At its meeting ending on 19 March 2025, the MPC voted by a majority of 8–1 to maintain Bank Rate at 4.5%. One member preferred to reduce Bank Rate by 0.25 percentage points, to 4.25%.
As the Committee noted in February, there has been substantial progress on disinflation over the past two years, as previous external shocks have receded, and as the restrictive stance of monetary policy has curbed second-round effects and stabilised longer-term inflation expectations. That progress has allowed the MPC to withdraw gradually some degree of policy restraint, while maintaining Bank Rate in restrictive territory so as to continue to squeeze out persistent inflationary pressures.
Since the MPC’s previous meeting, global trade policy uncertainty has intensified, and the United States has made a range of tariff announcements, to which some governments have responded. Other geopolitical uncertainties have also increased and indicators of financial market volatility have risen globally. The German government has announced plans for significant reform to its fiscal rules.
While UK GDP growth estimates have been slightly stronger than expected at the time of the February Monetary Policy Report, business survey indicators generally continue to suggest weakness in growth and particularly in employment intentions. In recent quarters, subdued activity has been judged to reflect both demand and supply factors.
Twelve-month CPI inflation increased to 3.0% in January from 2.5% in December, slightly higher than expected in the February Report. Domestic price and wage pressures are moderating, but remain somewhat elevated. Although global energy prices have fallen back recently, they remain higher than last year and CPI inflation is still projected to rise to around 3¾% in 2025 Q3. While inflation is expected to fall back thereafter, the Committee will pay close attention to any consequent signs of more lasting inflationary pressures.
At this meeting, the Committee voted to maintain Bank Rate at 4.5%.
Based on the Committee’s evolving view of the medium-term outlook for inflation, a gradual and careful approach to the further withdrawal of monetary policy restraint is appropriate. Should there be greater or longer-lasting weakness in demand relative to supply, this could push down on inflationary pressures, warranting a less restrictive path of Bank Rate. Should there be more constrained supply relative to demand and more persistence in domestic wages and prices, including from second-round effects related to the near-term increase in CPI inflation, this would warrant a relatively tighter monetary policy path.
The Committee will continue to monitor closely the risks of inflation persistence and what the evidence may reveal about the balance between aggregate supply and demand in the economy. Monetary policy will need to continue to remain restrictive for sufficiently long until the risks to inflation returning sustainably to the 2% target in the medium term have dissipated further. The Committee will decide the appropriate degree of monetary policy restrictiveness at each meeting.
Minutes of the Monetary Policy Committee meeting ending on 19 March 2025
1: Before turning to its immediate policy decision, the Committee discussed: the international economy; monetary and financial conditions; demand and output; and supply, costs and prices.
The international economy
2: UK-weighted global GDP was estimated to have grown by 0.5% in 2024 Q4, in line with the projection in the February Monetary Policy Report. Since the MPC’s February meeting, there had been a further increase in geopolitical and global trade policy uncertainty, and it was likely that this elevated uncertainty would persist. The US administration had imposed tariffs on some goods imports from some of its trading partners, as well as on all steel and aluminium imports, to which some governments had responded with tariffs of their own.
3: The Committee judged that the consequent risks around the near-term outlook for activity in a number of advanced economies, including the United Kingdom, remained to the downside. The overall effect on UK inflation was less clear at present, and would depend on where other countries’ trade policies settled and how these transmitted through different economic channels, including exchange rates. The Committee noted that this was a rapidly evolving situation, which it would monitor closely and assess further in the May policy round.
4: Euro-area GDP growth had remained subdued, increasing by 0.2% in 2024 Q4, marginally higher than the February Report projection. The S&P Global HCOB PMI composite output index had suggested a modest increase in activity at the start of the year. Looking ahead, the German government had announced plans for significant reform to its fiscal rules, including making way for sizeable increases in defence and infrastructure spending.
5: US GDP had increased by 0.6% in 2024 Q4, in line with the February Report projection. Going forward, growth was expected to slow on the back of tariff and wider policy uncertainty, among other factors. Indicators of activity for 2025 Q1 suggested a weakening in household consumption growth and consumer confidence, while some surveys of firms’ output and investment expectations had also fallen in February.
6: In China, GDP had grown by 1.6% in 2024 Q4, and the government had set an annual growth target of around 5% for 2025. Growth was expected to slow in Q1 as the impact of past policy stimulus was fading. The imposition of tariffs by the US posed a downside risk to activity this year, although this could be somewhat ameliorated by the further fiscal stimulus announced in March.
7: The euro-area labour market had remained somewhat tight but had continued to normalise, while the labour market in the United States had remained close to balance. Unemployment in these regions remained at or near historical lows, and indicators of pay growth had generally been cooling.
8: Annual headline consumer price inflation had decreased slightly in the euro area and the United States, owing largely to base effects. In the euro area, twelve-month HICP inflation had decreased to 2.3% in February, while core inflation had also fallen slightly to 2.6%. In the United States, PCE inflation had fallen slightly to 2.5% in January, and core PCE inflation had fallen to 2.6%. Services price inflation remained somewhat elevated in both economies. Some measures of short and medium-term household inflation expectations in the United States had risen, possibly reflecting the impact of anticipated tariffs.
9: Since the MPC’s February meeting, negotiations around a potential ceasefire in Ukraine, and the consequent possible prospect of a boost in global gas and oil supply, had contributed to declines in wholesale energy prices, although they had remained higher than last year. European wholesale near-term gas futures prices had fallen since the previous meeting by around 20%, with the potential relaxation of winter storage targets and a surge in liquefied natural gas imports also playing a role. Brent crude spot prices had fallen by 7%, to $71 per barrel, which was additionally reflective of the announced increased in OPEC+ supply from April, as well as weakening US economic activity and uncertainty around trade policies.
Monetary and financial conditions
10: Since the MPC’s previous meeting, financial market volatility had risen globally, reflecting an intensification of geopolitical and trade policy uncertainty.
11: There had been contrasting financial market developments across jurisdictions since the February MPC meeting. In the United States, government bond yields were lower, the dollar had depreciated, and equity prices were notably lower, having fallen by around 10% over the past month. Market contacts had noted that these movements in part reflected the impact of policy uncertainty on the US economic growth outlook. In contrast, in the euro area, government bond yields had increased sharply, driven by significant news on more expansionary German fiscal policy. On 5 March, German ten-year government bond yields had risen by around 30 basis points, the largest one-day move in over 30 years. The euro exchange rate had appreciated and euro-area equity prices, while volatile, had risen on balance.
12: Since the MPC’s previous meeting, the market-implied path for policy rates had fallen in the United States and had risen in the euro area. Nonetheless, expected policy rates over the next three years remained materially higher in the United States than in the euro area. At its meeting on 6 March, the ECB Governing Council had announced a 25 basis point reduction in its deposit facility rate to 2.5%, in line with market expectations. At its meeting ending on 19 March, the Federal Reserve’s Federal Open Market Committee was expected to leave the target range for the federal funds rate unchanged, at 4.25% to 4.5%.
13: Overall, since the MPC’s previous meeting, financial market movements in the United Kingdom had been affected by global developments but had been smaller than in the United States and the euro area. Gilt yields had risen, there had been some appreciation in the sterling effective exchange rate and UK equity prices were on balance little changed. Market contacts continued to highlight two-sided risks to the UK macroeconomic outlook. The median respondent to the Bank’s latest Market Participants Survey (MaPS) expected CPI inflation to peak at around 3.5% in Q3 this year, an increase relative to expectations in the previous survey. Respondents continued to expect inflation to be at the 2% target at the three-year horizon. There had been little change in medium-term UK financial market inflation compensation measures.
14: Market expectations were for Bank Rate to remain unchanged at this meeting. Thereafter, the median MaPS respondent expected a further 75 basis points of Bank Rate cuts this year. Market contacts emphasised elevated economic uncertainty, with perceptions that the near-term distribution for Bank Rate was skewed towards fewer cuts. Consistent with that, the path for Bank Rate implied by market pricing was somewhat higher than for the median MaPS respondent, declining by a little over 50 basis points over the rest of the year.
15: Pass-through from the relevant risk-free reference rates to saving and borrowing rates facing households and corporates had remained broadly in line with historical experience. The main exception had been household sight deposit rates, which had fallen by less and more slowly than Bank Rate since August, although these rates had not risen by as much as Bank Rate during the recent tightening cycle.
16: The average rate paid on the stock of floating rate mortgages had fallen since Bank Rate was first cut in August last year, reflecting full pass through at a pace in line with previous experience. But the average rate paid on the stock of fixed rate mortgages had risen as the majority of fixed term mortgages refinanced at higher rates. Overall, that meant the average rate paid on the total stock of all outstanding mortgages had continued to rise, albeit at a decreasing rate. An increasing proportion of households were choosing to borrow over longer terms, which reduced monthly capital repayments in the near term but meant they would have more debt to service further out.
17: House prices and mortgage lending had continued to recover in recent months. Market contacts noted that part of that rise might reflect a bringing forward of house purchases ahead of increases to Stamp Duty Land Tax due to take effect from April. House purchase mortgage approvals had remained broadly flat since last August at relatively robust levels.
18: There had been a relatively large increase in aggregate sterling broad money in January, driven by the volatile Non-Intermediary Other Financial Companies sector as well as inflows into the household and private non-financial company sectors. Given the volatility in near-term money data, lower-frequency trends typically provided a more reliable cross-check on the outlook. The ratio of broad money to nominal GDP had continued to drift down to around its end-2019 level, and was slightly below the level implied by the extrapolation of its trend between 2012 and 2019.
Demand and output
19: UK GDP had risen by 0.1% in 2024 Q4, above the -0.1% rate that had been expected in the February Monetary Policy Report. Quarterly growth had been supported by a 0.4% increase in monthly GDP in December. That in turn had been accounted for by a pickup in business-to-business services activity. The level of GDP had fallen back by 0.1% on the month in January, largely reflecting weakness in manufacturing output.
20: Reflecting the higher starting point to the level of 2025 Q1 GDP, Bank staff now expected around ¼% growth in 2025 Q1, higher than the 0.1% that had been incorporated in the February Report. This nowcast was, however, somewhat stronger than the combined steer from business surveys, of 0.0 to 0.1%, that was probably more representative of the underlying rate of growth. The S&P Global UK composite PMI output index had stabilised at just over 50 in recent months, although recent CBI output series had been somewhat weaker. The Bank’s Agents had reported that activity remained subdued, with weak consumer and business sentiment perceived as the main barrier to growth.
21: The Committee discussed the broader narrative behind recent weakness in activity. Official GDP data had been volatile over the past couple of years, but a slowing in growth was apparent on both headline GDP and other indicator-based underlying metrics towards the end of last year. As the Committee had considered in detail at its previous meeting, this was likely to reflect both weaker supply and a shortfall of demand relative to that weaker supply. Economic uncertainties, both globally and domestically, had risen recently. The data also suggested that monetary policy was continuing to weigh on activity, with slower growth in those industries that were more sensitive to interest rates. Intelligence from both the Decision Maker Panel survey and the Agents had pointed to a number of additional factors, including employment costs and global uncertainties, that continued to restrain firms’ investment decisions. The household saving ratio had remained elevated.
22: The Chancellor would announce the Spring Statement on 26 March, alongside an updated economic and fiscal forecast from the Office for Budget Responsibility.
Supply, costs and prices
23: Quality issues with the official labour market data continued to be an area of concern for the MPC. Low achieved sample sizes and very low response rates meant that Labour Force Survey (LFS)-based estimates of labour market dynamics remained subject to considerable uncertainties, which increased the challenge of gauging the underlying state of labour market activity. The MPC had, for some time, utilised a wide range of information beyond official data to inform its judgements on the labour market, including business surveys and intelligence from the Bank’s Agents.
24: A range of early-stage and more timely indicators of labour market dynamics, typically those reflecting labour demand and firms’ hiring decisions, had weakened in recent months to varying degrees. Some indicators, such as the S&P Global UK PMI composite employment and REC Report on Jobs permanent staff placements indices, had deteriorated markedly to levels consistent with shrinking employment. Other indicators had not weakened to the same extent. The volume of vacancies over recent months had been broadly flat at similar levels to 2019 Q4. The three-month rolling average of HMRC payroll estimates of inflows to employee jobs had remained below its level in early 2024, whereas estimates of outflows had been relatively stable over the same period.
25: The overall weakening in these early-stage indicators suggested that some modest deterioration in late-stage indicators, such as redundancy and unemployment rates, should be expected over the coming months. The latest intelligence from the Agents suggested that employment intentions had weakened, on balance, and more firms had reported hiring pauses or freezes. These contacts had said that they would review staffing levels through natural attrition or redundancies if the outlook did not improve. The rolling three-month average of HR1 redundancy notifications, a leading indicator of actual redundancies, had remained, on average, at its historical norm in recent months.
26: Measures of labour market tightness had continued to ease slightly. The vacancies to unemployment ratio had remained around Bank staff’s estimate of its equilibrium level. The latest intelligence from the Agents’ contacts suggested that recruitment difficulties had normalised. Such developments pointed to a labour market that was broadly in balance.
27: The LFS estimate of employment growth in the three months to January had been stronger than expected in the February Monetary Policy Report. The collective steer from business surveys, HMRC payroll data and the Agents’ employment intention scores pointed to underlying quarterly employment growth of 0.1% in 2025 Q1, broadly consistent with expectations at the time of the February Report. This was below population growth of around ¼%.
28: A broad set of indicators suggested that underlying pay growth had eased further in recent months, albeit to a still elevated level and above what could be explained by economic fundamentals. This softening in underlying pay growth contrasted with annual growth in private sector regular average weekly earnings (AWE), which had picked up to 6.1% in the three months to January from 4.9% in the three months to September. Bank staff analysis suggested that compositional effects, reflecting changes in the sectoral and full-time mix of employees, had accounted for only some of this increase in AWE growth. It also appeared that some sectors with historically volatile pay growth had accounted for the increase in AWE growth in 2024 Q4. Downweighting these volatile sectors brought the AWE measure more into line with Bank staff’s estimate of underlying pay growth.
29: The MPC noted that in February the ONS had announced that in a forthcoming release it would open up revisions to the AWE data over a longer back run than the usual revision to the preceding month’s estimate, to allow for late and updated returns from one business to be included.
30: The latest pay settlements and pay expectations data had been consistent with the February Report projection for pay growth to ease over the course of this year. Data from the Bank’s and Brightmine’s settlements databases suggested that the median rate of pay awards had remained at around 3 to 4% in the three months to February, although these estimates had been based on relatively small sample sizes. The latest intelligence from the Agents suggested average pay rises for 2025 of 3.5% to 4%, consistent with the average of 3.7% reported in the Agents’ annual pay survey conducted ahead of the February Report. The latest Decision Maker Panel (DMP) survey had reported that businesses’ pay growth expectations for the year ahead had remained at 3.9% in the three months to February. The MPC continued to monitor closely the flow of pay settlements information and other data that would provide signals for the future path of pay growth.
31: Twelve-month CPI inflation had increased to 3.0% in January from 2.5% in December. This was slightly higher than had been forecast at the time of the February Report, reflecting upside news to core goods and food prices. Core CPI inflation had also increased, to 3.7%, in line with expectations at the time of the February Report.
32: Core consumer goods price inflation had risen to 1.6% in January, alongside a material increase in food consumer price inflation, to 3.3%. Alongside external shocks, it was possible that domestic factors, such as labour costs, had been a driver of the recent pickup in core consumer goods and food prices. Additionally, the Agents had reported that some of their contacts had passed on costs associated with the Extended Producer Responsibility for packaging regulations, which were due to be finalised in July. The Agents’ contacts had indicated that there could be additional pass-through from these costs in the second half of this year. In addition, there had been some pockets of strength in certain commodity prices, such as cocoa and coffee, which appeared to have had a significant impact on food inflation.
33: Services price inflation had risen from 4.4% in December to 5.0% in January. This increase was, however, somewhat weaker than had been expected at the time of the February Report. Underlying services price inflation had remained elevated across a broad range of measures, regardless of whether they were based on exclusionary, trimming or reweighting approaches. While these had been on a downward trajectory through 2024, there had been little change in annual underlying services price inflation between December and January. Measures of underlying services inflation would probably reflect some of the pass-through from the forthcoming increase in employers National Insurance contributions, requiring some caution in their interpretation over coming months.
34: CPI inflation was expected to rise further in the near term, to around 3¾% in 2025 Q3. This expectation was little changed from the projection made at the time of the February Report. Upside news to non-energy consumer goods prices had been offset by downside news to energy prices from downward moves in sterling oil and gas price curves relative to the assumptions in the February Report projection.
35: Indicators of households’ short- and medium-term inflation expectations had continued to rise in the latest data. The Citi/YouGov measure of median one-year ahead inflation expectations had risen to 3.9% in February, while the Bank/Ipsos measure had risen to 3.4%. This compared to pre-pandemic averages of 2.5% and 3.0% respectively. These increases could be broadly explained by households responding to actual inflation and in particular salient prices, such as food and energy, but they nevertheless represented an upside risk to future pay and inflation dynamics. Medium-term measures from these surveys had risen to similar levels and these had been a little above what could be explained by observed moves in the equivalent short-term measures.
36: Businesses’ inflation expectations had also risen, with the DMP reporting that businesses’ own price year-ahead inflation expectations had increased by 0.5 percentage points over the past six months, to 4.0% in the three months to February. This had left firms’ own-price inflation expectations marginally higher than own-price inflation realisations, which suggested firms no longer expected their own-price inflation rate to fall over the year ahead. The latest Consensus Economics survey of professional forecasters had reported an increase in the peak of the mean UK inflation forecast, to 3.7% in September 2025 up from 3.2% in the February survey.
The immediate policy decision
37: The Monetary Policy Committee (MPC) sets monetary policy to meet the 2% inflation target, and in a way that helps to sustain growth and employment. The MPC adopts a medium-term and forward-looking approach to determine the monetary stance required to achieve the inflation target sustainably.
38: Since the MPC’s previous meeting, global trade policy uncertainty had intensified, and the United States had made a range of tariff announcements, to which some governments had responded. Other geopolitical uncertainties had also increased and indicators of financial market volatility had risen globally. The German government had announced plans for significant reform to its fiscal rules. The MPC would continue to assess global developments closely.
39: The Committee considered domestic economic developments and how these informed the assessment that progress on disinflation was continuing. The news since the previous MPC meeting had been mixed and, taken together, broadly in line with expectations at the time of the February Monetary Policy Report.
40: The Committee stressed the importance for policy making of high quality and reliable official data across the full range of economic and labour market statistics.
41: While UK GDP growth estimates had been slightly stronger than expected at the time of the February Report, business survey indicators generally continued to suggest weakness in growth. In recent quarters, subdued activity had been judged to reflect both demand and supply factors.
42: The labour market had continued to ease, although it was still judged to be broadly in balance. Some indicators of employment intentions had deteriorated markedly, to levels consistent with shrinking employment. Other indicators, such as the number of vacancies, had not weakened to the same extent. The Committee was continuing to monitor the response of employers to increases in their costs and to the subdued level of activity.
43: Twelve-month CPI inflation had increased to 3.0% in January from 2.5% in December, slightly higher than had been expected in the February Report. This had reflected upside news in core consumer goods and food prices, which had more than offset slight downside news in services prices. Alongside external shocks, it was possible that domestic factors, such as labour costs, had been a driver of the recent pickup in non-energy goods prices.
44: Domestic price and wage pressures were moderating, but remained somewhat elevated. A broad range of measures had pointed to little change in underlying annual services price inflation between December and January. A range of indicators suggested that underlying pay growth had eased further in recent months, although annual growth in private sector regular average weekly earnings had picked up to 6.1% in the three months to January.
45: The latest wage settlements and pay expectations data had continued to suggest an easing in pay growth over the course of this year. The Committee would be monitoring incoming settlements data closely as they became available on a more comprehensive basis later in the year. More generally, the future trajectory of pay growth, relative to the likely path of productivity growth in the economy, would be an important determinant of the Committee’s views on the persistence of domestic inflationary pressures.
46: Household inflation expectations had risen in recent months, at both short and medium-term horizons. Businesses’ inflation expectations had also risen, with the Decision Maker Panel survey reporting that businesses’ own price year-ahead inflation expectations had increased over the past six months. There had been little change in medium-term UK financial market inflation compensation measures.
47: Although global energy prices had fallen back recently, they remained higher than last year and CPI inflation was still projected to rise to around 3¾% in 2025 Q3. While inflation was expected to fall back thereafter, the Committee would pay close attention to any consequent signs of more lasting inflationary pressures. Monetary policy would act to ensure that longer-term inflation expectations were anchored at the 2% target.
48: Since last summer, and as set out in Box A in the November Report, the Committee’s policy deliberations had been supported by the consideration of three cases that could affect the evolution of inflation persistence. These cases had focused on the uncertainties around domestic price and wage-setting behaviour, as the succession of very large external cost shocks in 2021–22 unwound and as headline CPI inflation returned close to the 2% target last year. These cases would change as the economy evolved and new shocks emerged.
49: Ahead of the May Report, the Committee was likely to consider scenarios for the risks around medium-term inflation, building on its recent deliberations. The MPC was currently focused on two particular risks. First, the extent to which there could be greater or longer-lasting weakness in demand relative to supply in the economy, in part reflecting uncertainties globally and domestically, which could push down on inflationary pressures in the medium term. Second, the extent to which there could be more persistence in domestic wage and prices, both from more constrained supply relative to demand and from additional second-round effects related to the projected near-term increase in CPI inflation. The MPC would review the evidence on the impact and likelihood of these broad risks as a part of its May policy round, alongside its baseline forecast.
50: At this meeting, eight members preferred to maintain Bank Rate at 4.5%. The Committee had noted in February that progress on disinflation in domestic prices and wages had generally continued. There had been relatively little news since the previous meeting from UK economic developments, notwithstanding the intensification in global uncertainties, and there continued to be a range of views underlying these members’ outlooks for the economy and inflation. There remained two-sided risks around the balance of supply and demand, and the persistence of domestic price and wage pressures. The underlying disinflationary process was expected to continue, but an accumulation of evidence would be used to assess progress. There was no presumption that monetary policy was on a pre-set path over the next few meetings.
51: One member preferred a 0.25 percentage point reduction in Bank Rate, to 4.25%. While global price developments had continued to pose risks for some time, disaggregated data pointed to inflation continuing to decline through both wage and price-setting channels. The earlier concerns of an asymmetry in the inflation process on the way down compared to the way up had not materialised, as goods disinflation had generally been passed through to consumers. The subdued outlook for demand remained consistent with services inflation normalising sustainably to target over the medium term. The setting of Bank Rate needed to account for policy transmission and the risks to supply capacity from a prolonged period of monetary restrictiveness.
52: Based on the Committee’s evolving view of the medium-term outlook for inflation, a gradual and careful approach to the further withdrawal of monetary policy restraint was appropriate. Should there be greater or longer-lasting weakness in demand relative to supply, this could push down on inflationary pressures, warranting a less restrictive path of Bank Rate. Should there be more constrained supply relative to demand and more persistence in domestic wages and prices, including from second-round effects related to the near-term increase in CPI inflation, this would warrant a relatively tighter monetary policy path.
53: The Committee would continue to monitor closely the risks of inflation persistence and what the evidence might reveal about the balance between aggregate supply and demand in the economy. Monetary policy would need to continue to remain restrictive for sufficiently long until the risks to inflation returning sustainably to the 2% target in the medium term had dissipated further. The Committee would decide the appropriate degree of monetary policy restrictiveness at each meeting.
54: The Chair invited the Committee to vote on the proposition that:
- Bank Rate should be maintained at 4.5%.
55: Eight members (Andrew Bailey, Sarah Breeden, Megan Greene, Clare Lombardelli, Catherine L Mann, Huw Pill, Dave Ramsden and Alan Taylor) voted in favour of the proposition. Swati Dhingra voted against the proposition, preferring to reduce Bank Rate by 0.25 percentage points, to 4.25%.
Operational considerations
56: On 19 March, the stock of UK government bonds held for monetary policy purposes was £623 billion.
57: The following members of the Committee were present:
- Andrew Bailey, Chair
- Sarah Breeden
- Swati Dhingra
- Megan Greene
- Clare Lombardelli
- Catherine L Mann
- Huw Pill
- Dave Ramsden
- Alan Taylor
Sam Beckett was present as the Treasury representative
USD/JPY Analysis: Dollar Weakens After Fed Decision
Yesterday, the Federal Reserve announced its interest rate decision, which, as expected, remained unchanged. Fed Chair Jerome Powell emphasised that there is no rush to cut rates amid uncertainty surrounding US inflation and the tariff policies implemented by the Trump administration.
This key announcement triggered volatility in financial markets, notably:
→ US stock indices rose;
→ the US dollar weakened, which was evident in currency (and cryptocurrency) charts involving USD pairs.
The most significant movement occurred in the USD/JPY chart, as the Bank of Japan was also active yesterday. While it also left interest rates unchanged, it acknowledged growing uncertainty around Japan’s economy and added a new reference to the "changing trade environment."
Technical Analysis of USD/JPY
As we noted on 21 February when analysing the Japanese yen’s exchange rate against the US dollar:
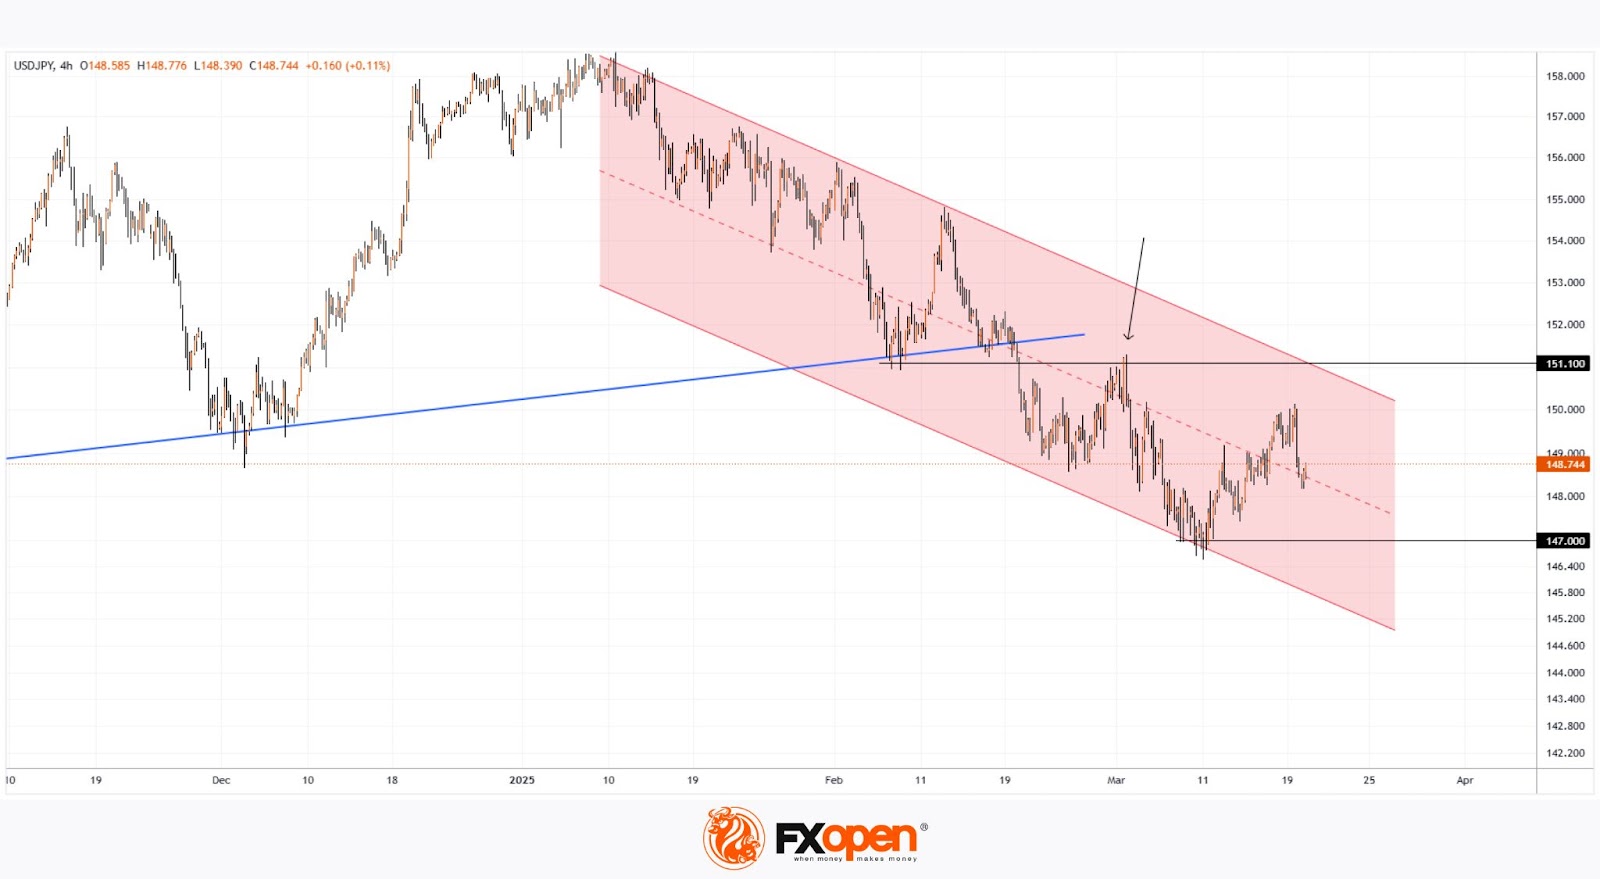
→ Price fluctuations are forming a downward channel (marked in red).
→ The former support at the lower boundary of the blue channel may now act as resistance.
Since then, the price has:
→ Tested the breakout level (indicated by an arrow) before continuing to decline within the channel, confirming its relevance.
→ Reached the lower boundary of the channel and rebounded upwards from the 147 yen per dollar level.
Given that the price is closely interacting with the channel lines and is currently around its median, it suggests that supply and demand are relatively balanced under these conditions. This is further supported by the fact that neither the Fed nor the Bank of Japan introduced surprises, leaving interest rates unchanged.
Trade over 50 forex markets 24 hours a day with FXOpen. Take advantage of low commissions, deep liquidity, and spreads from 0.0 pips. Open your FXOpen account now or learn more about trading forex with FXOpen.
This article represents the opinion of the Companies operating under the FXOpen brand only. It is not to be construed as an offer, solicitation, or recommendation with respect to products and services provided by the Companies operating under the FXOpen brand, nor is it to be considered financial advice.
ECB’s Lagarde warns US-EU tariff war could slash eurozone growth by 0.5%
Speaking to a European Parliament committe, ECB President Christine Lagarde warned that US tariffs of 25% on European imports could have a significant negative impact on the Eurozone economy, cutting growth by around 0.3% in the first year.
If the EU responds with retaliatory tariffs, the impact could deepen, reducing Eurozone GDP growth by as much as 0.5%.
While the sharpest impact would be felt in the first year, Lagarde emphasized that the effects would be long-lasting, leaving a "persistent negative effect on the level of output".
Beyond growth concerns, inflation outlook would also become highly uncertain in such a scenario.
In the short term, EU retaliatory measures and a weaker Euro—stemming from lower US demand for European products—could push inflation higher by around 0.5%.
In the medium term, weaker economic activity would dampen price pressures, ultimately counteracting the initial inflationary impact.
GBP/USD Signals Caution as BoE Takes Spotlight
- GBPUSD pulls lower after briefly touching 1.3000 area.
- Overbought signals reflect weakening bullish pressures.
- Buying the dip could be considered above the 200-SMA.
GBPUSD made a modest push into the 1.3000 area following the FOMC policy meeting on Wednesday, which kept the door open for rate cuts amid ongoing uncertainty about the US economic outlook.
The Bank of England is next on the calendar today, and the pair is currently trading moderately lower at 1.2964 after UK claimant counts jumped unexpectedly in February. While the central bank is widely expected to hold rates steady, any shifts in its communication tone in response to trade and geopolitical risks could generate fresh volatility.
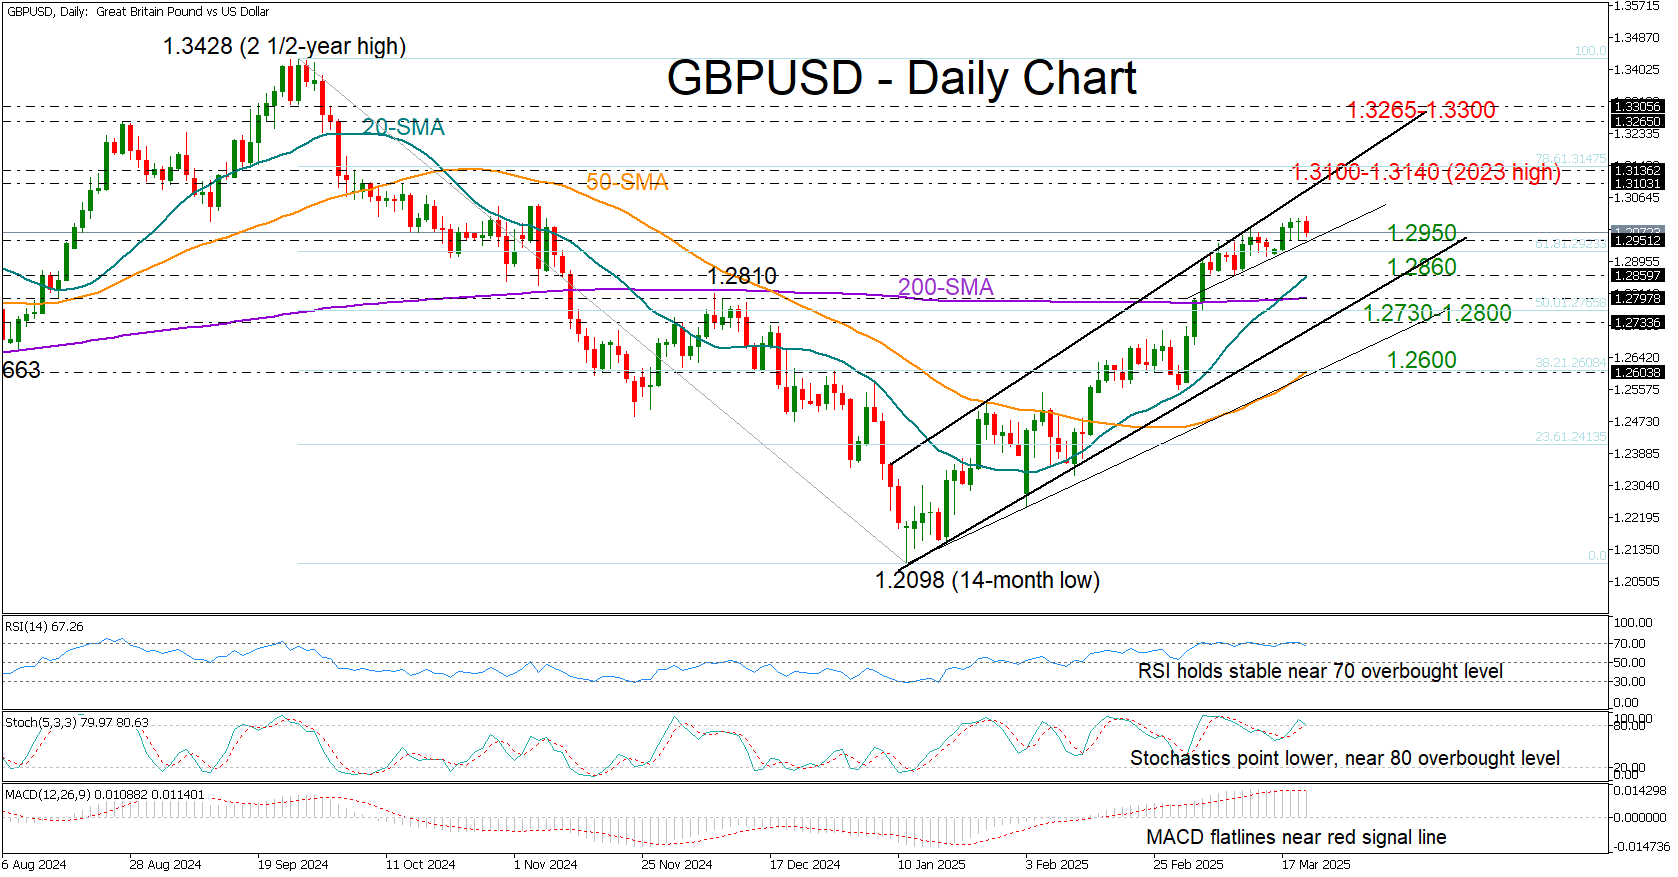
From a technical perspective, the bulls appear to be losing momentum, as indicated by the RSI and Stochastic oscillator, which have been flattening around overbought levels for the past two weeks. If the price slips below 1.2950, the 20-day simple moving average (SMA) could provide support near 1.2860, while the 200-day SMA and the key support trendline at 1.2730 could prevent a further deterioration in the outlook. If these levels fail to hold, the pair could tumble toward the 50-day SMA at 1.2600.
In the bullish scenario where the pair resumes its upward trajectory, initial resistance could emerge from the ascending trendline at 1.3100. The 2023 high of 1.3140 is also within reach and could act as a barrier before the 1.3265–1.3300 caution zone.
Overall, GBPUSD could face some headwinds in the short term, as technical indicators suggest the recent upward movement may be overextended. However, any declines are unlikely to significantly dent market sentiment unless the price drops below the 200-day SMA and the 1.2730 level.
Pound Hits 4.5-Month High: New Peaks on the Horizon
The GBP/USD pair surged to 1.3008 on Thursday, marking its highest level in 4.5 months. This upward momentum has fuelled speculation about additional gains for the British pound.
Global Factors to Drive GBP/USD Movement
The market has largely priced in the US dollar’s decline, which has provided a tailwind for the pound. The UK is in a favourable position amid ongoing global trade tensions. With limited trade ties to the US, the country is less exposed to major tariffs. Its neutral stance on global conflicts further supports the pound’s stability.
Today’s Bank of England (BoE) meeting is unlikely to significantly affect the pound, as markets have already priced in the expectation that interest rates will remain at 4.50%. Investors will instead focus on the BoE’s commentary, which is expected to maintain a cautious tone. Key points of interest include updates on inflation and GDP estimates.
The BoE’s forecasts are expected to remain unchanged, underscoring its data-dependent approach. The central bank’s wording is expected to signal a gradual approach to future rate cuts, reinforcing a measured and cautious monetary stance.
Looking ahead, global developments will have a greater impact on the pound’s trajectory than domestic factors, with its outlook remaining positive given the current geopolitical and economic climate.
Technical Analysis of GBP/USD
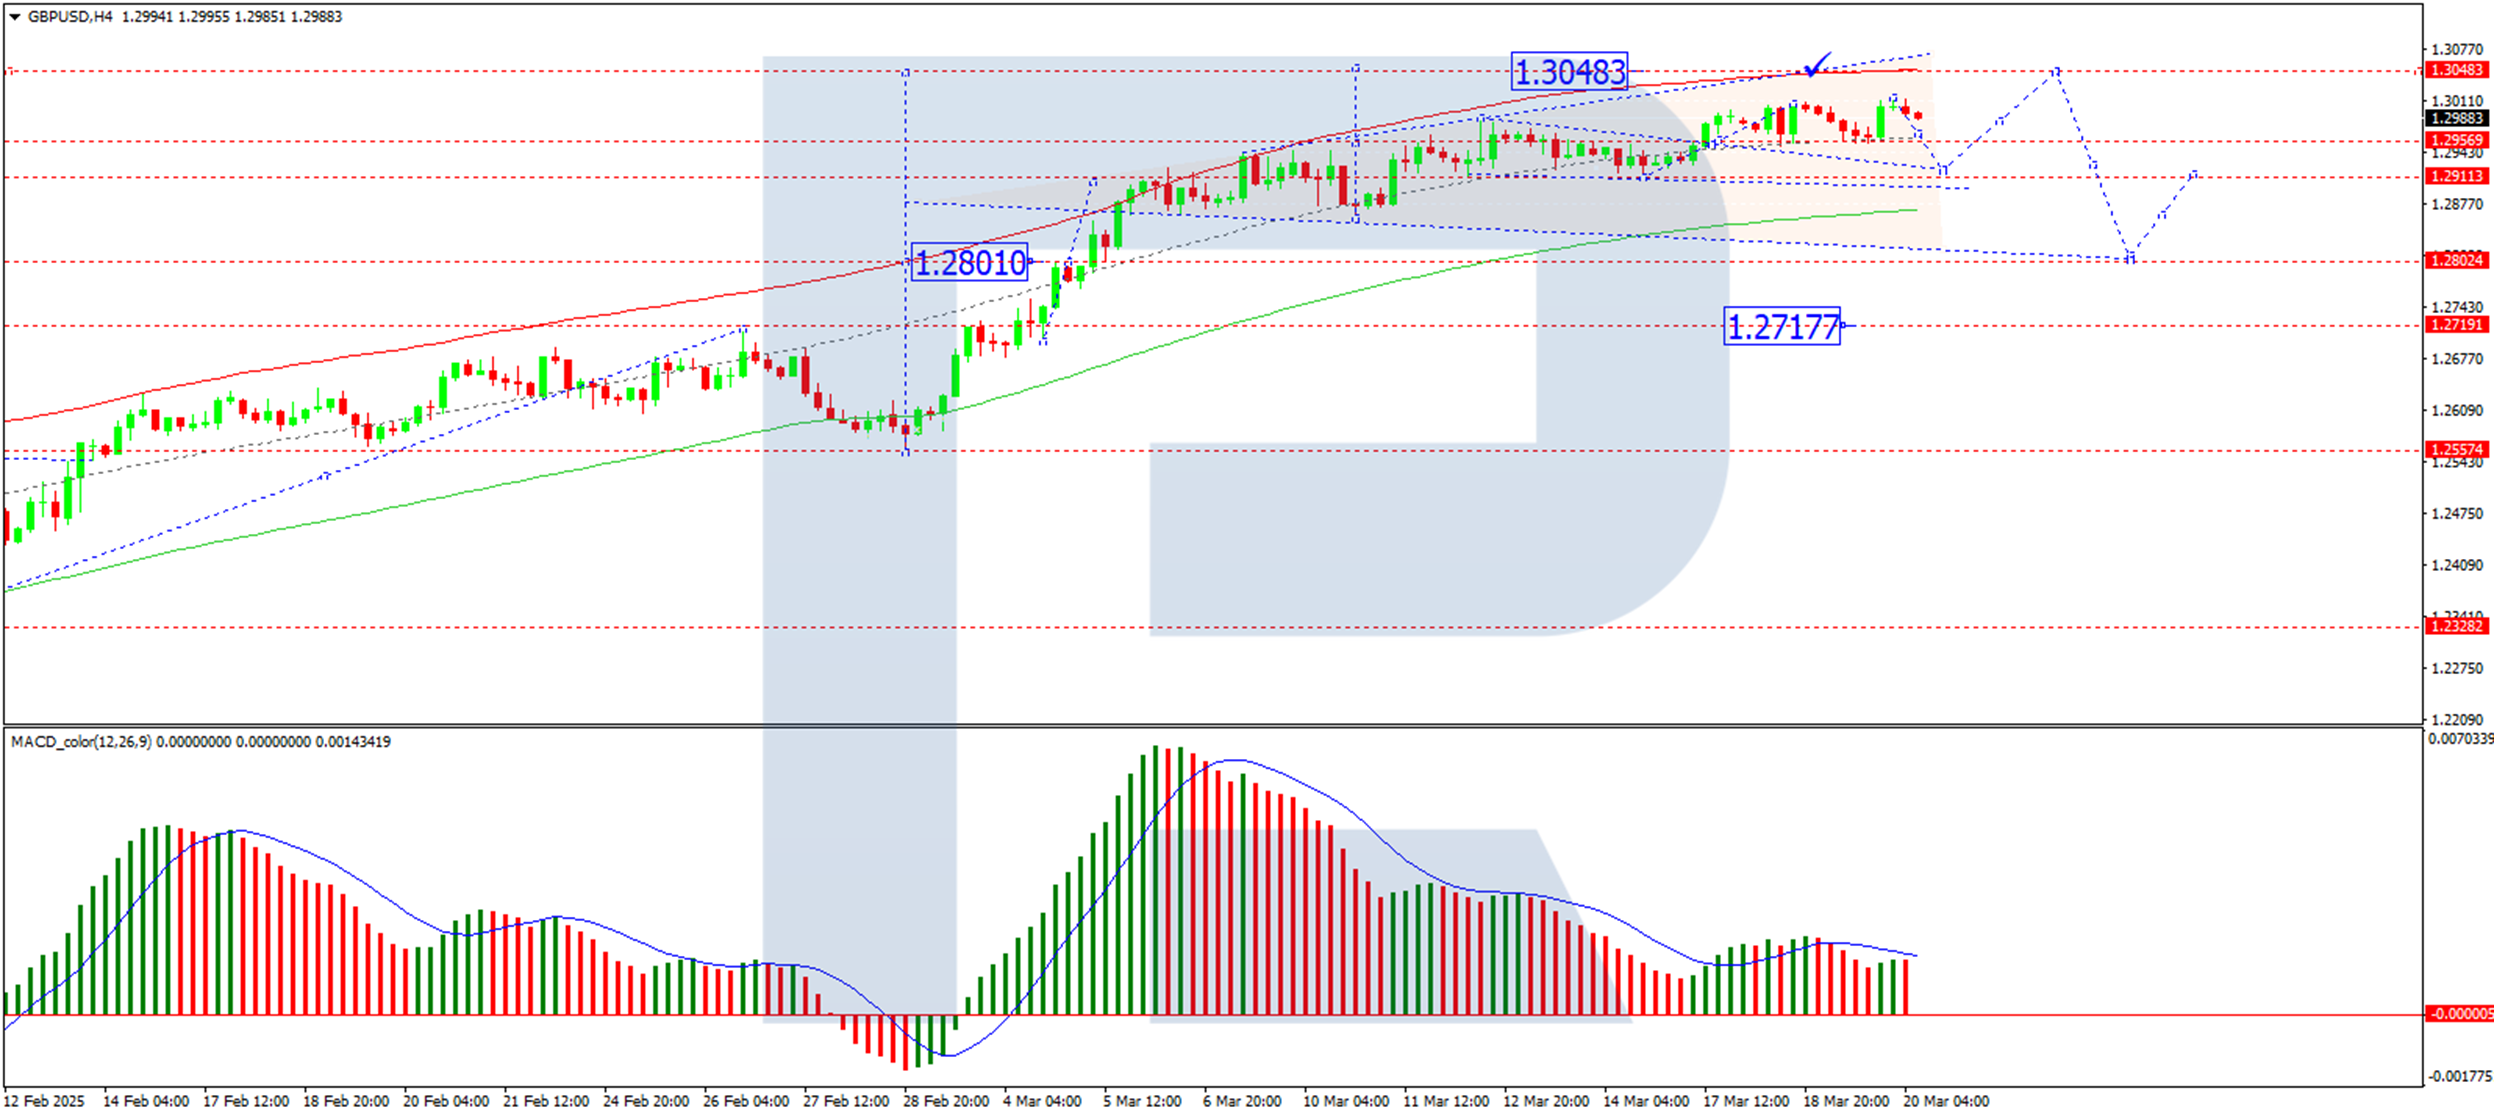
On the H4 chart, GBP/USD completed a growth wave, reaching 1.3013. Currently, the pair is consolidating below this level. A downward extension of the consolidation range to 1.2925 is anticipated, followed by a potential upward wave targeting 1.3048. Beyond this, a downward correction to 1.2800 could materialise. This scenario is supported by the MACD indicator, whose signal line is trending downward toward the zero level.
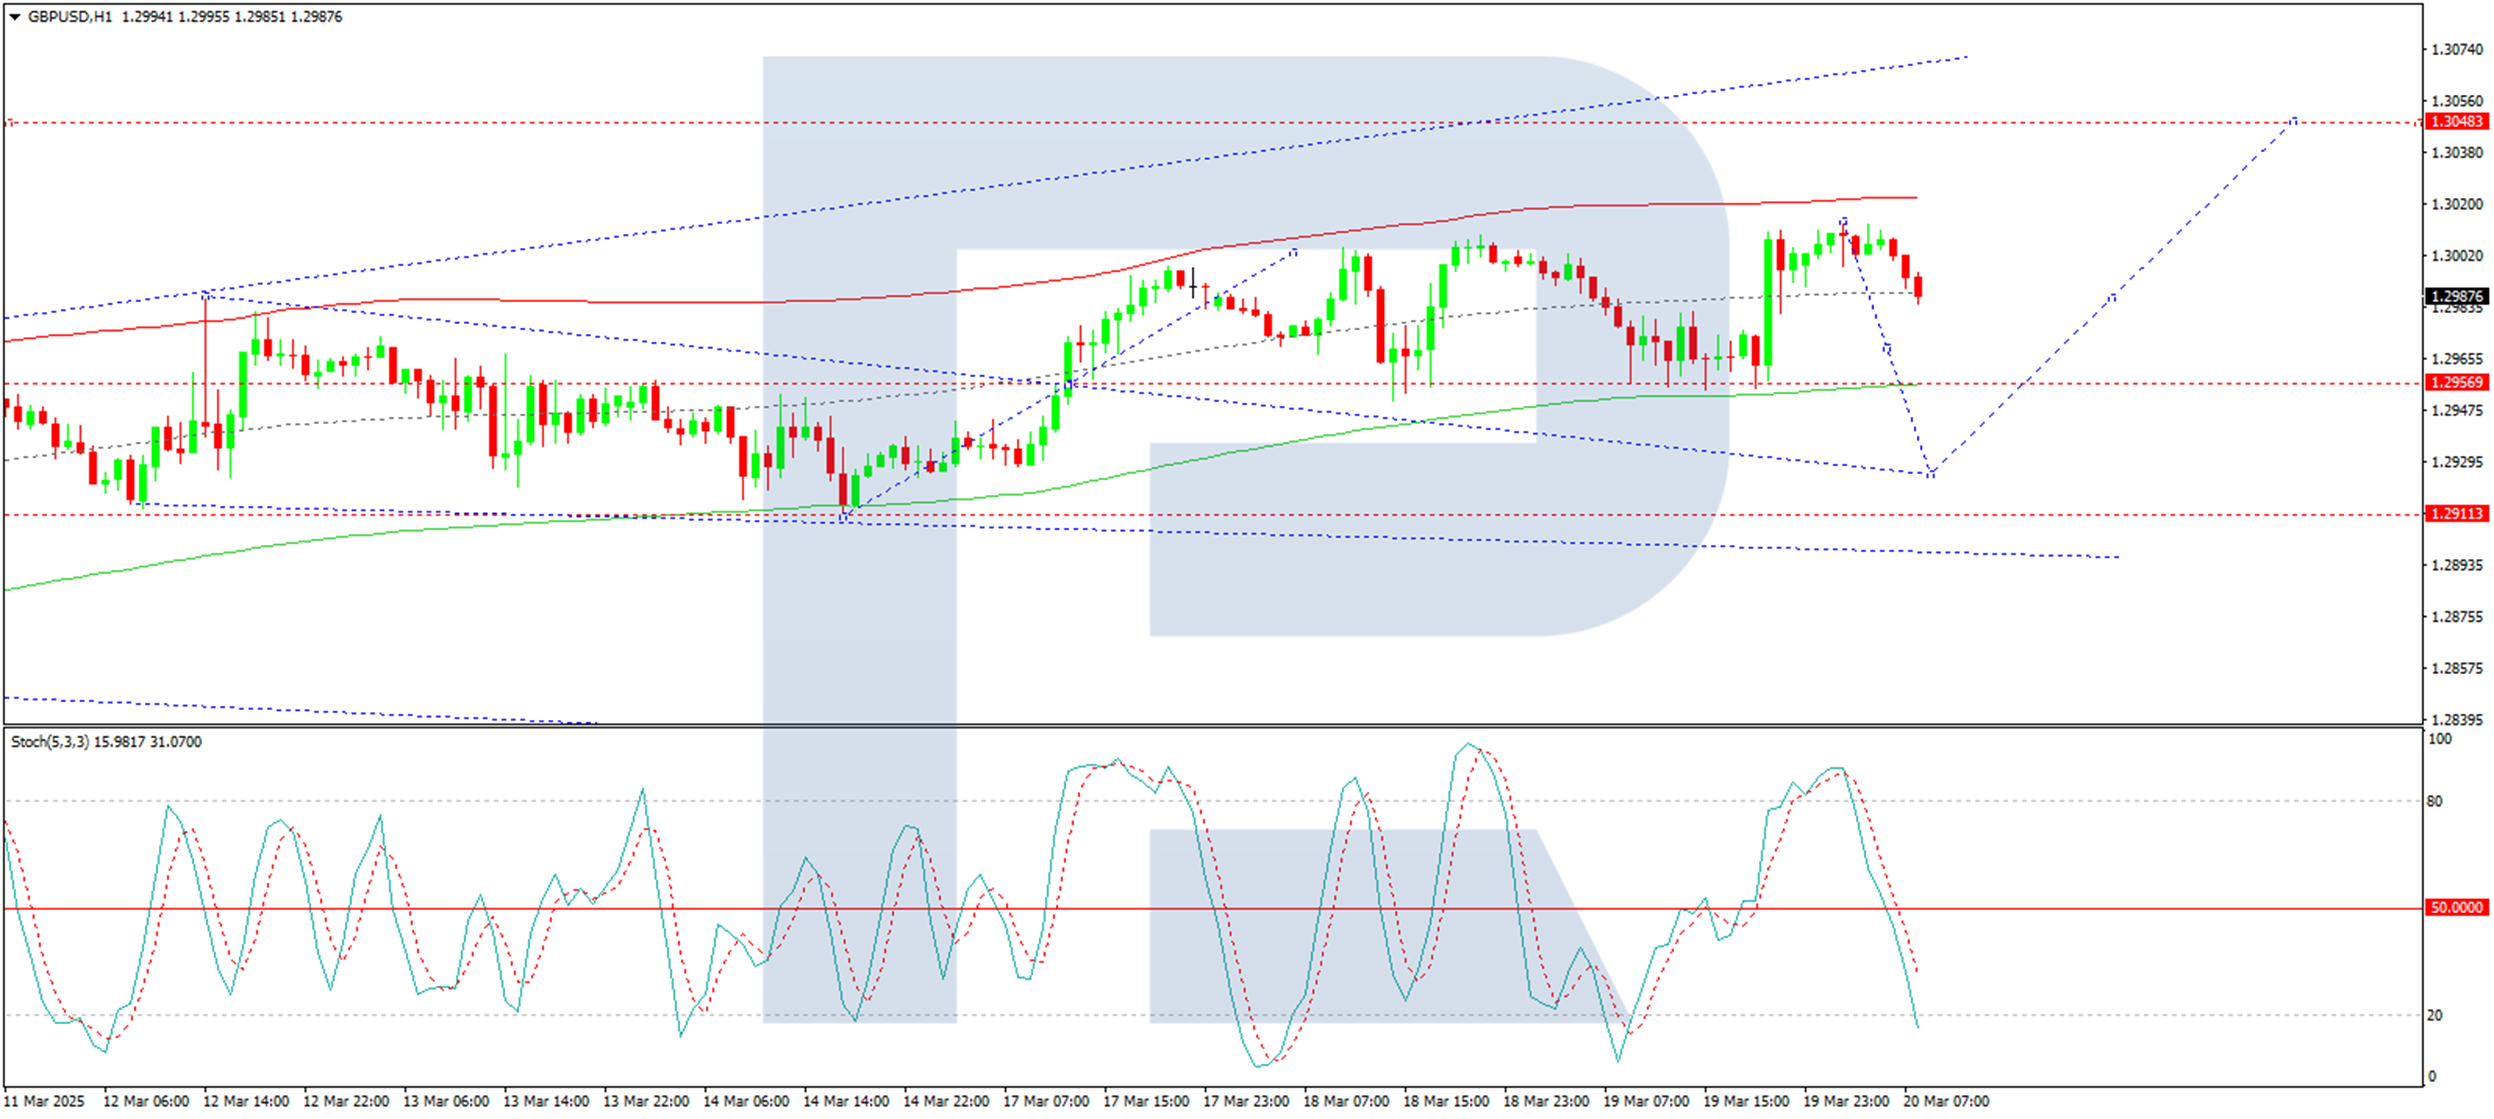
On the H1 chart, GBP/USD is forming a downward wave structure toward 1.2925. Once this wave completes, a move higher to 1.3048 is possible. Further ahead, a decline to 1.2717 remains a possibility. This outlook is corroborated by the Stochastic oscillator, whose signal line is below 50 and trending downward toward 20.
Conclusion
The pound’s recent rally to a 4.5-month high reflects a combination of US dollar weakness and the UK’s advantageous position in global trade dynamics. While the BoE meeting is unlikely to deliver surprises, the central bank’s cautious tone and data-dependent approach will be closely watched. Technically, GBP/USD is poised for further gains, though a corrective pullback is possible. Investors should watch global developments, which will likely dictate the pound’s next moves.
Yen and Euro Strengthen After Fed Meeting
At yesterday’s Fed meeting, contrary to expert expectations, officials left the benchmark interest rate unchanged at 4.50%. The Fed Chair highlighted a high degree of uncertainty in the current state of the US economy due to changes in tariff policy introduced by Donald Trump’s administration. Jerome Powell also noted rising inflation and a possible economic slowdown, stating that officials need more clarity before adjusting monetary policy.
These statements from the Fed contributed to a broad decline in the US dollar.
EUR/USD
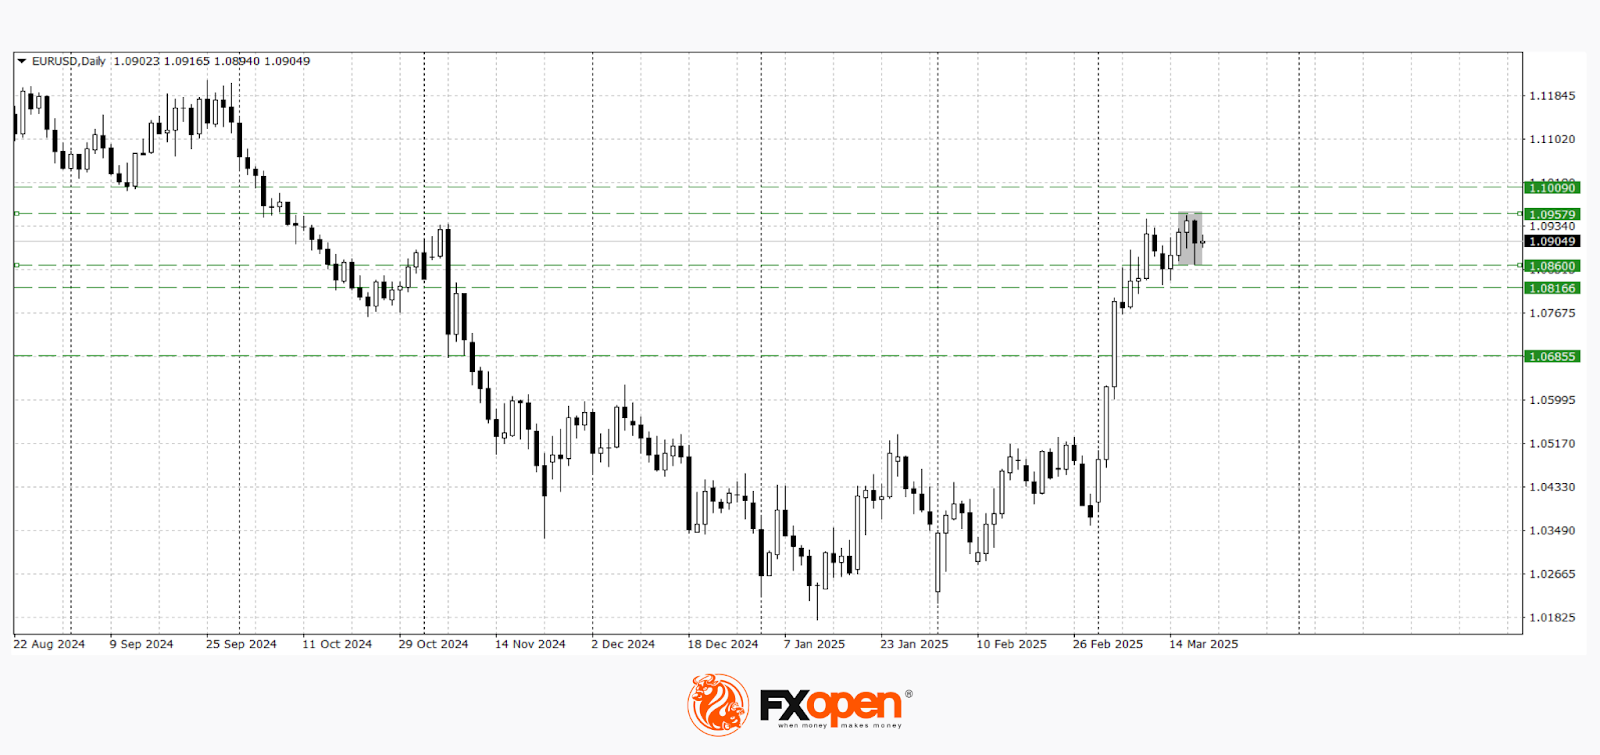
The euro weakened throughout the day yesterday, retreating from its recent highs near 1.0950. After the Fed’s decision, the pair rebounded from 1.0860 and briefly traded above 1.0900.
Technical analysis of EUR/USD suggests the possible start of a downward correction, as a "bearish engulfing" pattern has formed on the daily timeframe. If sellers manage to hold the pair below 1.0860, a retest of the key 1.0800 support level is likely. Conversely, if yesterday’s high is broken, the pair could continue its upward movement towards the psychological level of 1.1000.
Key events that may impact EUR/USD pricing in the upcoming trading sessions:
- Today at 10:00 (GMT+2): Germany Producer Price Index (PPI)
- Today at 11:00 (GMT+2): ECB President Lagarde’s speech
- Today at 12:00 (GMT+2): ECB Monthly Report
- Today at 13:00 (GMT+2): EU Leaders’ Summit
USD/JPY
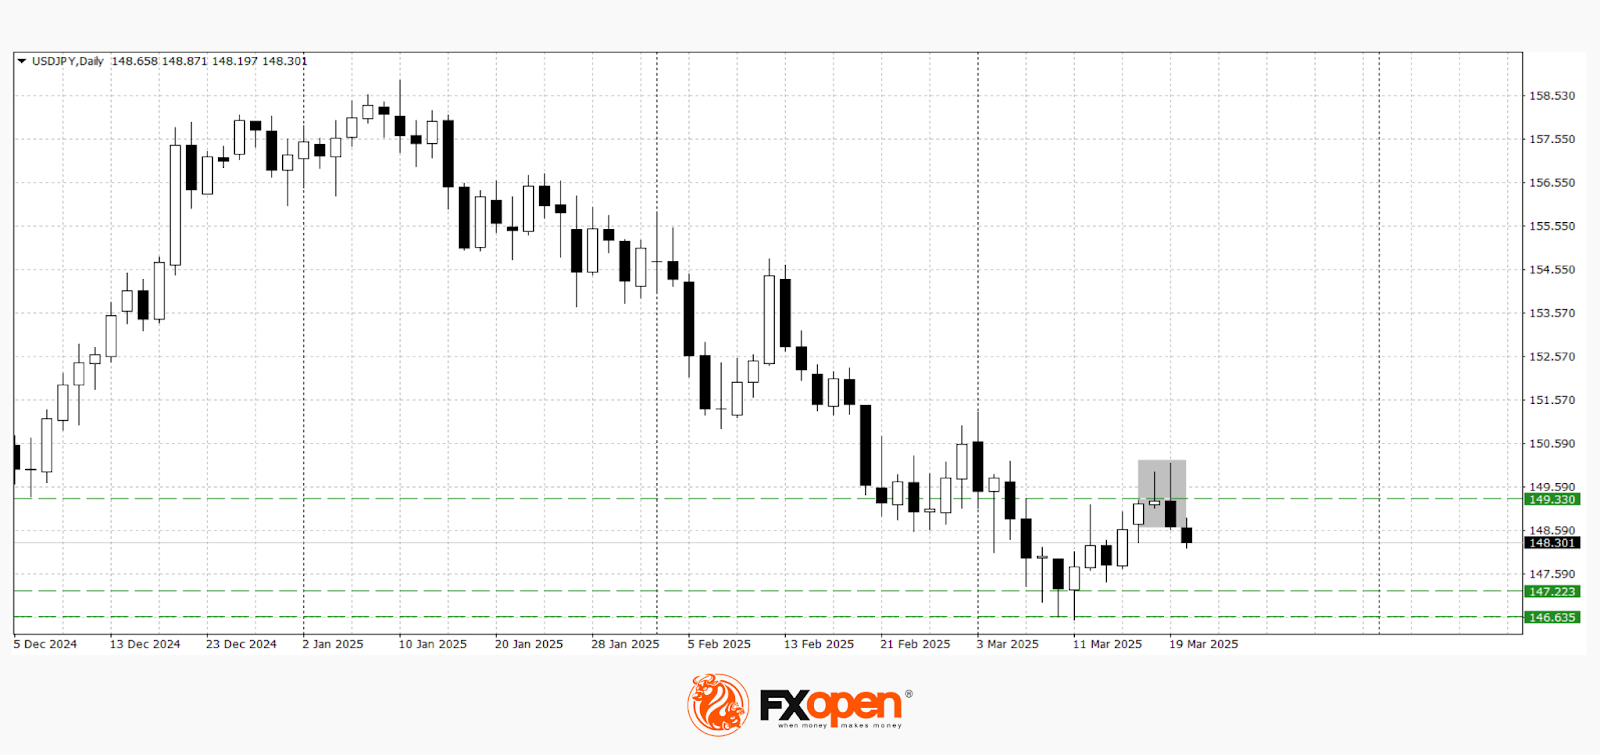
The USD/JPY currency pair tested the psychological resistance level at 150.00 yesterday. However, it failed to strengthen above this level, and a sharp rejection from 150.10 allowed sellers to form a "bearish engulfing" pattern on the daily timeframe.
Technical analysis of USD/JPY indicates a potential decline towards the 148.00–147.30 range. A break above 149.30 would invalidate the bearish scenario.
Key events that may impact USD/JPY pricing in the upcoming trading sessions:
- Today at 15:30 (GMT+2): US Initial Jobless Claims
- Today at 15:30 (GMT+2): Philadelphia Fed Manufacturing Index (US)
- Today at 17:00 (GMT+2): US Existing Home Sales
- Today at 23:30 (GMT+2): US Federal Reserve Balance Sheet
Trade over 50 forex markets 24 hours a day with FXOpen. Take advantage of low commissions, deep liquidity, and spreads from 0.0 pips. Open your FXOpen account now or learn more about trading forex with FXOpen.
This article represents the opinion of the Companies operating under the FXOpen brand only. It is not to be construed as an offer, solicitation, or recommendation with respect to products and services provided by the Companies operating under the FXOpen brand, nor is it to be considered financial advice.
SNB cuts 25bps, flags downside inflation risks and uncertain growth outlook
SNB delivered a widely expected 25bps rate cut, bringing the policy rate down to 0.25%. In its statement, SNB justified the decision by pointing to low inflationary pressures and "heightened downside risks to inflation".
The central bank acknowledged that Switzerland’s economic outlook has become "considerably more uncertain", particularly due to rising global trade tensions and geopolitical risks. The external environment remains a key threat to growth.
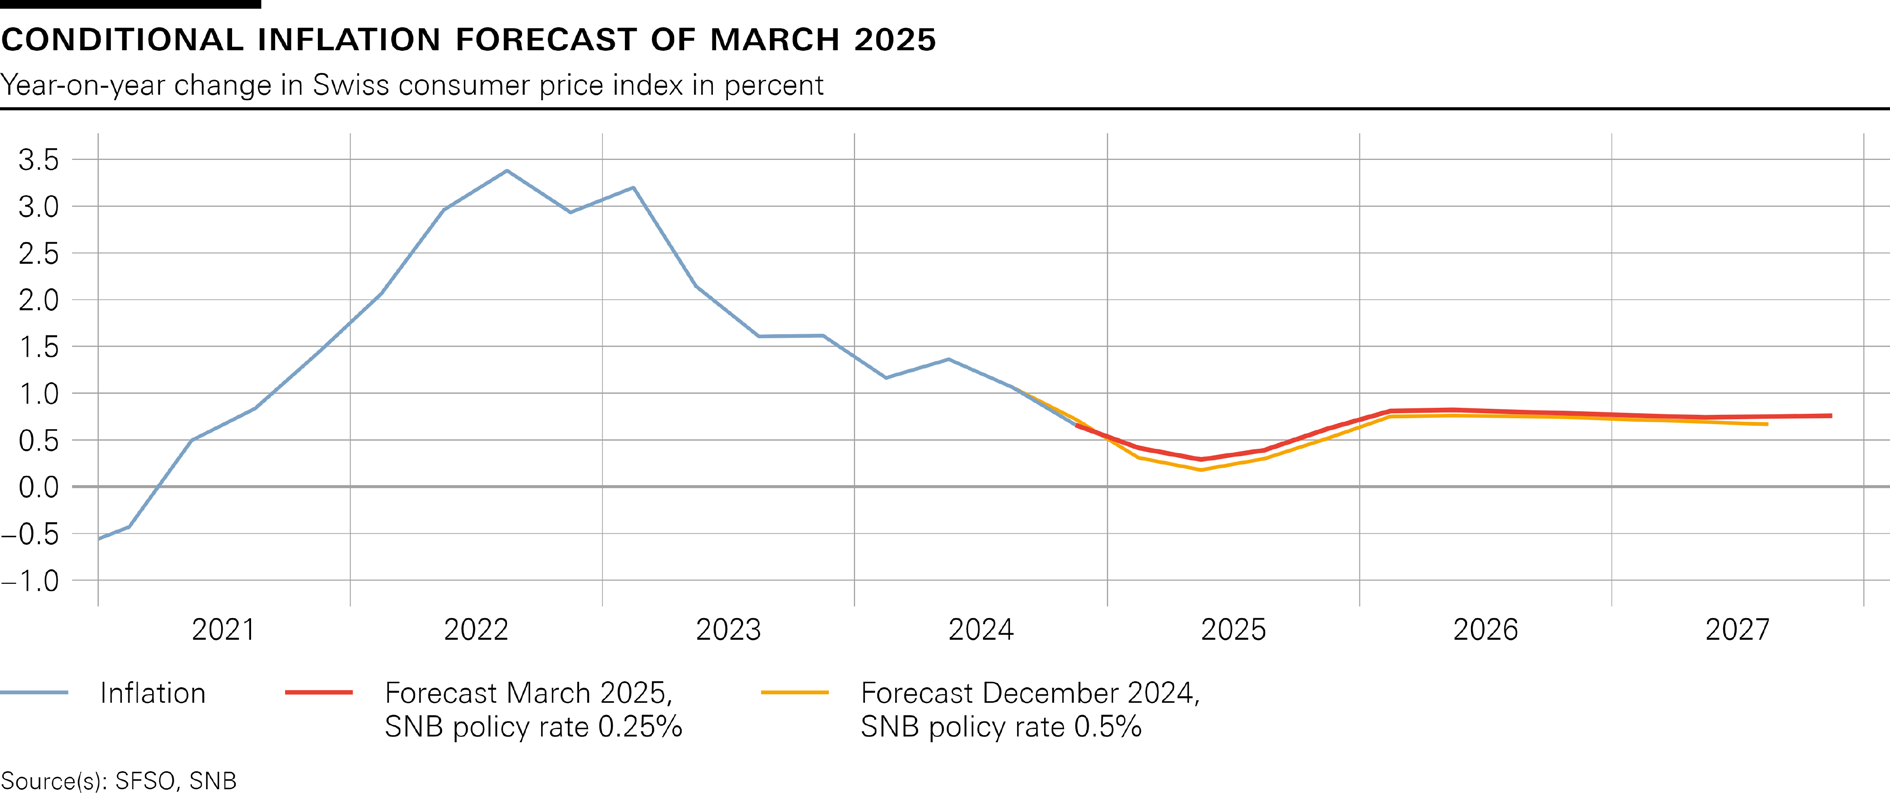
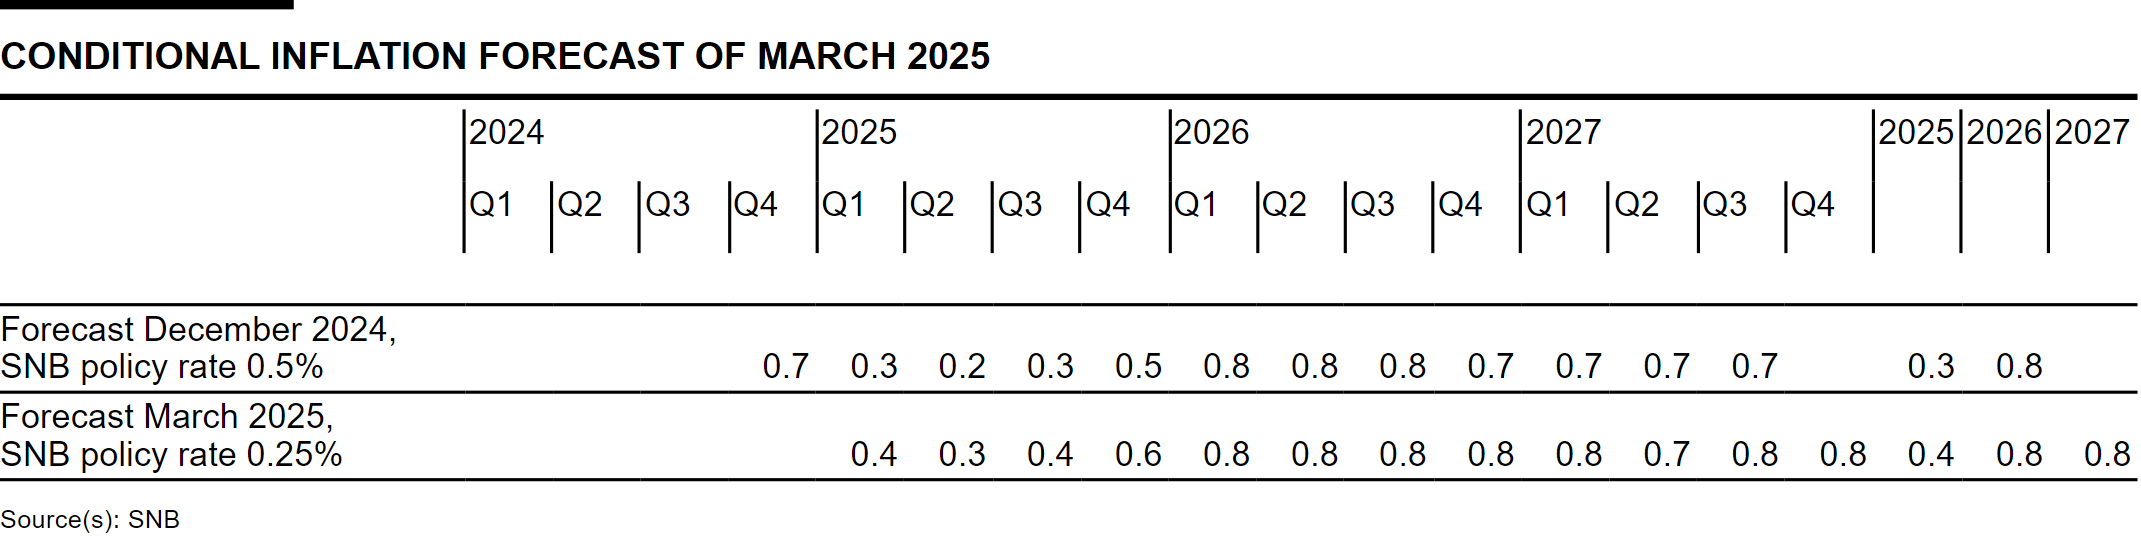
The new conditional inflation forecast suggests that inflation will remain well within its price stability range, averaging 0.4% in 2025, and 0.8% in both 2026 and 2027. These projections assume that the policy rate stays at 0.25% throughout the forecast horizon.
On the growth front, SNB expects GDP to expand between 1% and 1.5% in 2025, with domestic demand benefiting from rising real wages and easier monetary conditions. However, weak external demand is expected to act as a drag on growth. For 2026, SNB anticipates GDP growth of around 1.5%.
(SNB) Swiss National Bank eases monetary policy and lowers SNB policy rate to 0.25%
The Swiss National Bank is lowering the SNB policy rate by 0.25 percentage points to 0.25%. The new policy rate applies from tomorrow, 21 March 2025. Banks’ sight deposits held at the SNB will be remunerated at the SNB policy rate up to a certain threshold, and at 0% above this threshold. The SNB also remains willing to be active in the foreign exchange market as necessary.
With today’s rate adjustment, the SNB is ensuring that monetary conditions remain appropriate, given the low inflationary pressure and the heightened downside risks to inflation. The SNB will continue to monitor the situation closely and adjust its monetary policy if necessary, to ensure that inflation remains within the range consistent with price stability over the medium term.
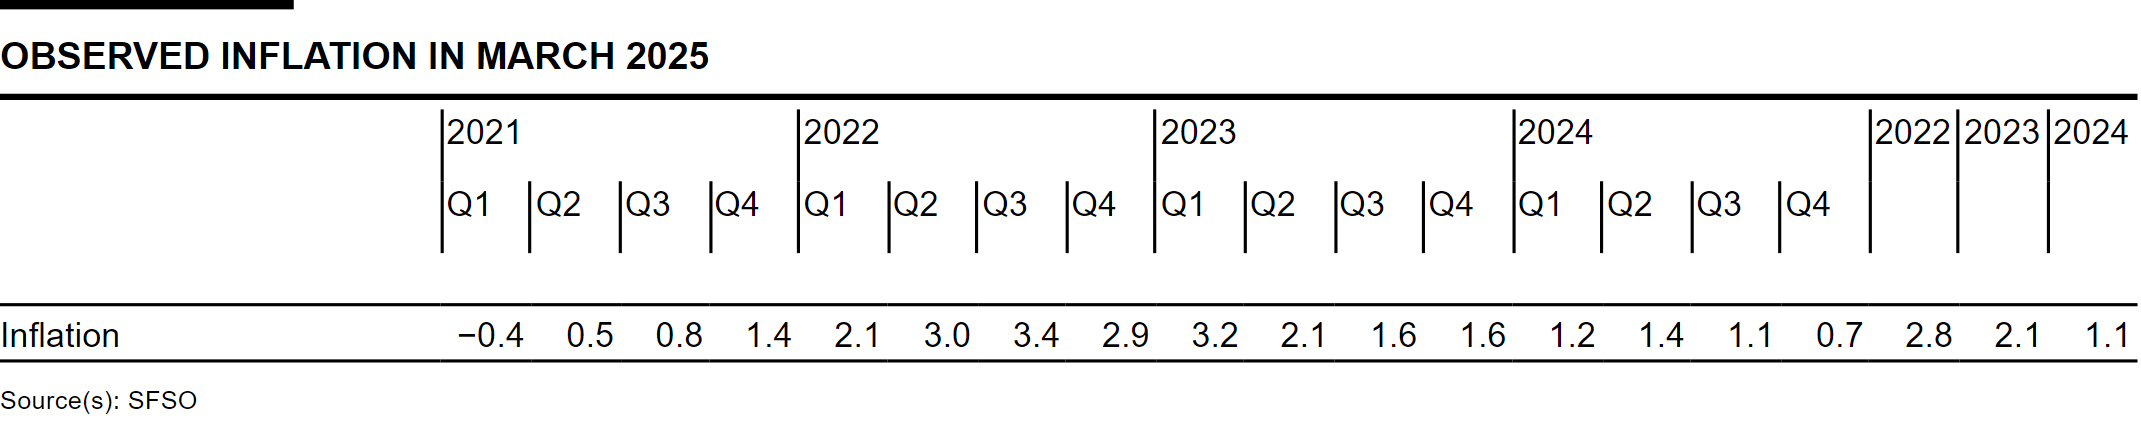
Since the last monetary policy assessment, inflation has developed in line with expectations. It decreased from 0.7% in November to 0.3% in February. This decline is attributable in particular to the drop in electricity prices in January. Overall, inflation is still being driven mainly by domestic services.
The new conditional inflation forecast has hardly changed since December. Without today’s rate cut, the forecast would have been lower in the medium term. The forecast is within the range of price stability over the entire forecast horizon (cf. chart). It puts average annual inflation at 0.4% for 2025, 0.8% for 2026 and 0.8% for 2027 (cf. table). The forecast is based on the assumption that the SNB policy rate is 0.25% over the entire forecast horizon.
Global economic growth was moderate in the fourth quarter of 2024. Inflation recently rose again somewhat in many countries, primarily driven by energy products. Underlying inflationary pressure is still elevated in many countries, albeit less markedly than a few quarters ago. Various central banks have therefore cut their policy rates further.
In its baseline scenario, the SNB anticipates that growth in the global economy will remain moderate over the coming quarters. Underlying inflationary pressure should continue to ease gradually over the next quarters, particularly in Europe.
This scenario for the global economy is currently subject to high uncertainty. The situation could change rapidly and markedly, particularly from a trade and geopolitical perspective. For example, increasing trade barriers could lead to weaker global economic development. At the same time, a more expansionary fiscal policy in Europe could provide stimulus to the economy in the medium term.
Economic growth in Switzerland was solid in the fourth quarter of 2024. The services sector and parts of manufacturing developed favourably. There was a further slight increase in unemployment, while the utilisation of overall production capacity was normal.
The SNB expects GDP growth of between 1% and 1.5% for the current year. Domestic demand is likely to benefit from rising real wages and the easing of monetary policy. By contrast, moderate economic activity abroad looks set to have a dampening effect on foreign trade. In this environment, unemployment is likely to continue to rise slightly. The SNB anticipates GDP growth of around 1.5% for 2026.
The economic outlook for Switzerland has become considerably more uncertain. Against the backdrop of increased trade and geopolitical uncertainties worldwide, developments abroad continue to represent the main risk.
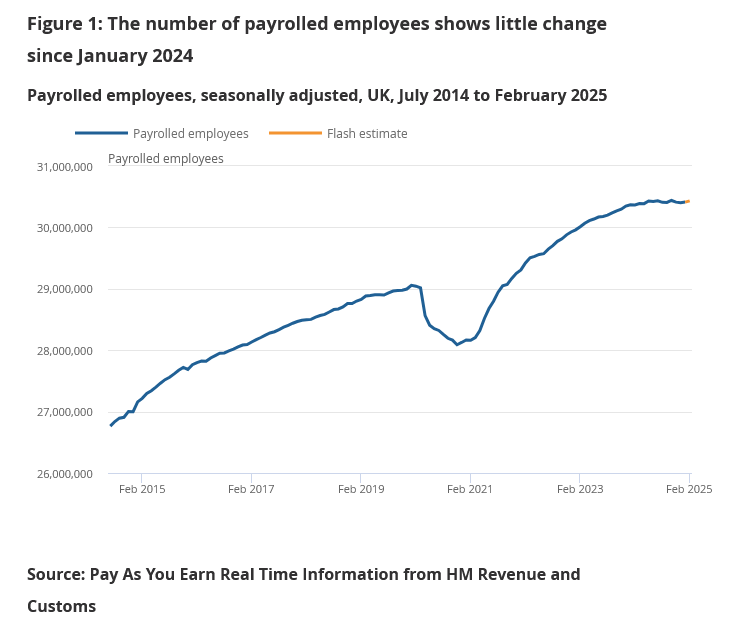
UK payrolled employment rises 21k in Feb, unemployment rate unchanged at 4.4% in Jan
In February, UK payrolled employment rose by 21k (0.1% mom). However, median monthly pay growth slowed to 5.0% yoy from 6.0%, reinforcing signs that wage pressures are gradually easing. However claimant count, surged 44.2k, far exceeding expectations of 7.9k.
In the three months to January, unemployment rate remained unchanged at 4.4%, slightly better than the expected 4.5%. Average earnings including bonuses rose by 5.8% yoy, just below expectations of 5.9%. Excluding bonuses, wages rose 5.9% yoy, in line with forecasts.

EUR/USD Kept the 1.09, But Barely
Markets
The Fed’s policy rate was left unchanged at the March meeting yesterday (4.25-4.5%). The decision was a unanimous one. It was accompanied with a slower pace in QT with the cap on the UST roll-off lowered from $25bn to $5bn. Fed Waller opposed against the latter, favouring to hold the pace steady. The possibility of a slower pace was first discussed in January, amongst others in anticipation of the debt ceiling getting raised at some point in time. After that Treasury is likely to refill their coffers in a frontloading move (thus heavily tapping market liquidity). This could happen as soon as June. The Fed’s updated forecast scream stagflation risks: growth was revised lower to 1.7% this year (from 2.1%) and the economy will no longer expand above potential (1.8%) in the years after. Inflation got a bump mainly for this year (2.7% headline PCE, 2.8% core) amid import tariffs. Chair Powell said these cost push factors were probably “transitory”. In a higher-inflation environment (compared to Trump’s first term), we’re not so sure. Uncertainty on GDP, the unemployment rate and PCE forecasts is very high and risks are heavily skewed to the downside for the first and to the upside for the latter two. Governor’s policy rate forecasts underwent a broad shift higher across the horizon, but median forecasts remain unchanged for now: two cuts in 2025 and 2026 and one more in 2027. That triggered a relief rally in US Treasuries. Powell still held an optimistic view during the presser, which we think doesn’t really capture the forecast narrative. He noted weakness in soft indicators but these are not yet filtering through in the hard data. It’s not until they do that the Fed’s willing to reprioritize growth over inflation. US yields fell between 6.7 and 3.5 bps lower in a bull flattener. Money market expectations stayed broadly unchanged with a first, full cut priced in for July at the earliest. Stocks jumped up to 1.4% (Nasdaq). The dollar retreated from the intraday highs. EUR/USD kept the 1.09, but barely. It’s still struggling this morning ahead of an important EU summit the next two days during which EU leaders are to agree on specific defense spending measures. The EC further detailed its ReArm Europe proposal yesterday. It allows 1.5% of GDP in defense spending to be exempted from the 3% deficit rule for the next four years, starting in 2025. A flurry of ECB speeches are a wildcard for trading. The UK’s labour market report on balance came in close to expectations. But with the Bank of England meeting scheduled later today (status quo expected), sterling’s initial reaction is muted. EUR/GBP trades unchanged around 0.838.
News & Views
The Brazilian central bank hiked its key policy rate as flagged by another 100 bps (third time straight), to 14.25% and bringing the Selic Rate now above the post-Covid peak of 13.75%. Brazilian growth and the labor market remained strong, though there are some early signs of growth moderation. Headline inflation and measures of underlying inflation remain above the inflation target (3% +-1.5%) and have again increased recently. Risks remain tilted to the upside. Inflation expectations moved up further to 5.7% and 4.5% respectively for this year and next and are at risk of deanchoring for longer. Persistent services inflation and a weaker currency (mix from domestic loose fiscal agenda and external trade policies) are threats as well. The BCB commits to another rate hike at its next meeting (May 7) but of a lower magnitude following a small (and premature?!) downward revision to its Q4 2026 inflation forecast from 4% to 3.9%.
The Aussie dollar manages to limit losses this morning (AUD/USD 0.6336) despite a big miss in February labour market figures. Employment fell by 52.8k with consensus expecting 30k growth. January numbers were downwardly revised from 44k to 30.5k as well. Details showed both lower full time occupations (-35.7k) and less part time jobs (-17k). The unemployment rate stabilized at 4.1%, but that was mainly because of a big setback in participation rate, from 67.2% to 66.8%. The Bureau of Statistics specifically referred to fewer older workers (>= 55 years) returning to work in February. We don’t expect this weak figure to derail February RBA plans from gradual rather than consecutive rate cuts. Money markets still bank on a status quo at the next, April 1st , meeting. The kiwi dollar failed to profit from stronger Q4 GDP numbers (+0.7% Q/Q vs 0.4% expected & -1.1% Y/Y) which were mainly boosted by tourism. Domestic demand remained rather soft.