
Sample Category Title
EURUSD Wave Analysis
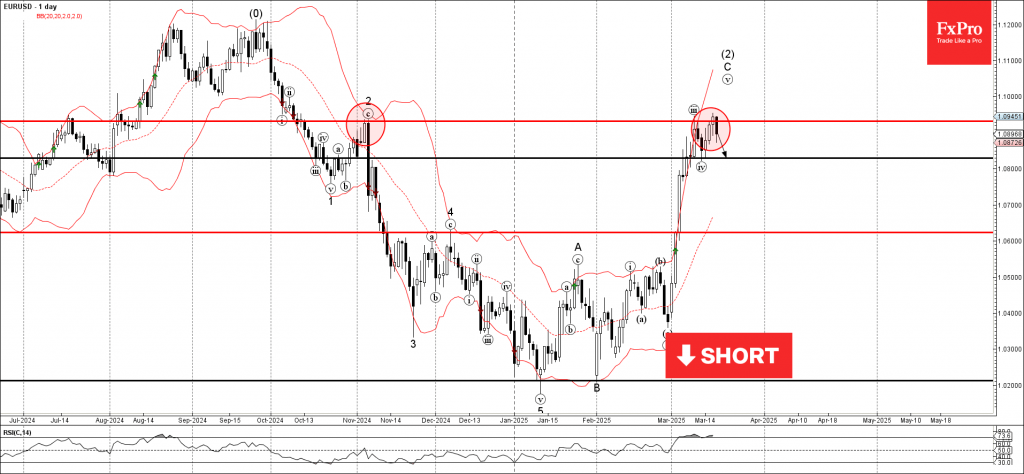
EURUSD: ⬇️ Sell
- EURUSD reversed from resistance level 1.0930
- Likely to fall to support level 1.0830
EURUSD currency pair recently reversed down from the key resistance level 1.0930 (a former monthly high from November, which also stopped the earlier minor impulse wave iii).
The downward reversal from resistance level 1.0930 is likely to form the daily Japanese candlesticks reversal pattern Evening Star – a strong sell signal for EURUSD.
Given the overbought daily RSI and strongly bullish US dollar sentiment, EURUSD currency pair can be expected to fall to the next support level 1.0830 (low of the previous correction iv).
Sunset Market Commentary
Markets
Markets were caught off-guard this morning by a steep sell-off in Turkish assets which triggered broad risk aversion at the onset of European trading. The meltdown started after news broke that Turkish police arrested Istanbul major and main Erdogan rival Ekran Imamoglu on corruption charges and on alleged terrorism links. Earlier this week, the state Istanbul University already cancelled Imamoglu’s higher education degree which bars him from entering presidential elections (scheduled for 2028). The opposition crackdown comes at a time where autocrats around the world feel empowered by the current makeover in Washington. The Turkish lira lost more than 10% against the euro and the dollar with EUR/TRY and USD/TRY, setting new all-time highs at respectively 43 and 41.30, before recovering some ground after Turkish lenders were rumoured to have sold around $8bn in FX to prop up the ailing currency. Turkish bonds and stocks (-8%) sold off as well. German bond yields gapped around 6 bps lower, before starting an intraday comeback. At the time of writing, daily changed are almost unchanged on a daily basis. The Eurostoxx50 started with a 0.5% deficit, but currently trades near flat as well. EUR/USD corrects from the 1.0940 area towards 1.09 on genuine USD strength. USD/JPY outperforms with a first 150+ quotation since end February after the BoJ kept its policy rate unchanged at 0.5% this morning. Governor Ueda did suggest a rate hike could come as soon as at the next meeting (May 1) with domestic inflation risks (eg shunto wage negotiations) outweighing external growth risks (tariffs). Eco calendars were empty in the US and EMU. ECB vice governor de Guindos and ECB Villeroy both stressed that there isn’t a predetermined path for policy rates, keeping a data dependent approach.
Attention turns to the Fed tonight. Data recently have added to a growing market narrative of stagflation, mostly in soft indicators (e.g. consumer confidence, NY manufacturing index). But hard economic data wasn’t so bad (services ISM, solid payrolls growth, IP, housing). That should prevent the Fed (and therefore the new projections) from getting carried away by the recent bearish (stock) sentiment, especially with uncertainty on the tariff narrative still this big. It’s not until April 2, when Trump’s reciprocal tariffs are to be announced, it’s worth making an analysis. In theory there’s little to push the Fed off the January track (extended pause; dots suggesting two rate cuts in 2025).
News & Views
A quarterly survey of the Origo Group commissioned by the Swedish Riksbank showed that inflation expectations have increased substantially since December. Respondents see CPIF inflation (with fixed interest rates, the preferred inflation measure of the Swedish Riksbank) at 2.3% one year from now, at 2.2% in two years’ time and 2.2% in a five year horizon, to be compared with 1.7%, 1.9% and 2% respectively in the December survey. Respondents also turned more positive on economic growth for the first (2% from 1.6%) and the second year (2.4% from 2.1%). This also resulted in expectations for the Riksbank polity rate at 2.2% over the next two years, compared to 2% in December. Respondents thus de facto expect the Riksbank to have reached the bottom of its easing cycle at the current level of 2.25%. The Riksbank concludes a regular policy meeting tomorrow at 9.30 CET and is largely expected to stay on hold. The krone since end January was a marked outperformer against a strong euro with EUR/SEK easing from the 11.50 area to currently 11.01, even as the move lost some momentum over the previous days.
News agency Reuters reported that the European Union will tighten steel import quotas to reduce the inflows of steel by a further 15% from April 1. Reuters obtained the information from European Commission Executive Vice President Stephane Sejourne. Sejourne indicated that he expects that after the US raises import tariffs by 25%, producers from Canada, India and China would look to sell increasing volumes in the EU. The European Commission will also propose other trade-related measures to support the metals industry. The first measure to reduce quota’s (safeguards) will reduce the imports that come in the EU free of tariffs. Imports outside the quota will be hit by a 25 % levy. The Commission is also preparing new measures to replace the safeguards in Q3 which cannot be extend under WTO beyond June 2026. In a broader perspective, Sejourne also said that the EU did not want to depend on imports for steel, which will be crucial in the EU's rebuilding of its military industrial complex after the Ukraine war. "We want to keep our steel in Europe and be able to recycle in Europe. It's a strategic issue. There is no defense industry without steel, there is no automobile without steel and we want to keep our industries."
EUR/USD Mid-Day Outlook
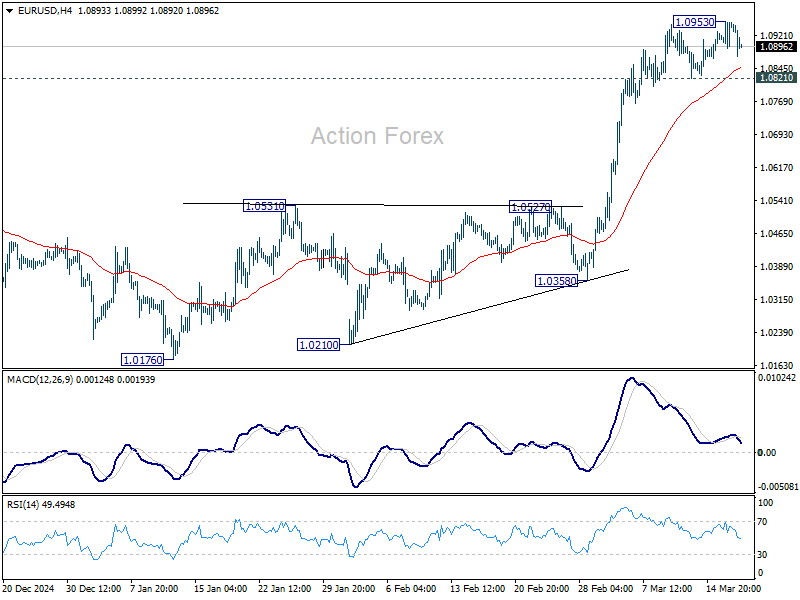
Daily Pivots: (S1) 1.0907; (P) 1.0931; (R1) 1.0969; More...
Intraday bias in EUR/USD is turned neutral first with current retreat. But further rally is expected as long as 1.0821 support holds. On the upside, break of 1.0953 will resume the rise from 1.1076 to retest 1.1274 key resistance. On the downside, though, break of 1.0821 support will indicate short term topping, likely with bearish divergence condition in 4H MACD. That will turn bias back to the downside for deeper pullback.
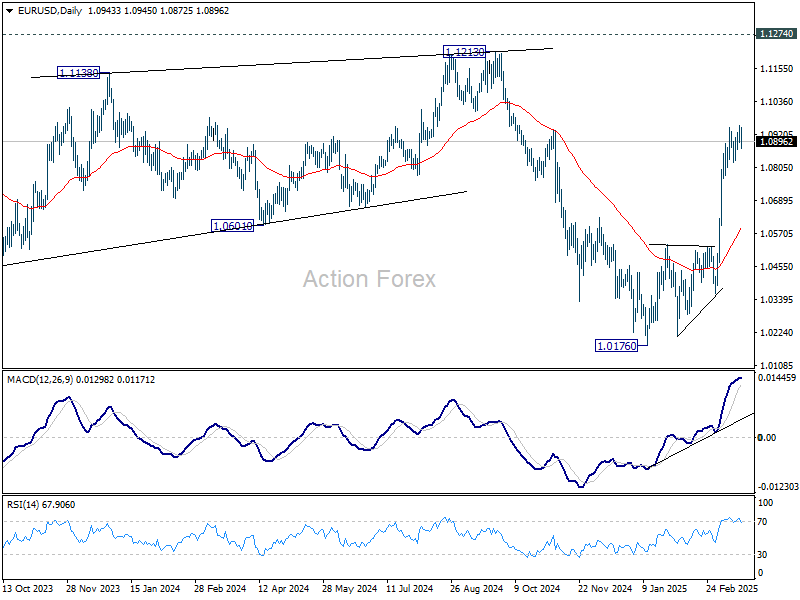
In the bigger picture, prior strong break of 55 W EMA (now at 1.0675) suggests that fall from 1.1274 (2024 high) has completed as a three wave correction to 1.0176. Rise from 0.9534 is still intact, and might be ready to resume. Decisive break of 1.1274 will target 100% projection of 0.9534 to 1.1274 from 1.0176 at 1.1916. Also, that will send EUR/USD through a multi-decade channel resistance will carries larger bullish implication. This will now be the favored case as long as 1.0531 resistance turned support holds.
USD/CHF Mid-Day Outlook
Daily Pivots: (S1) 0.8744; (P) 0.8782; (R1) 0.8805; More…
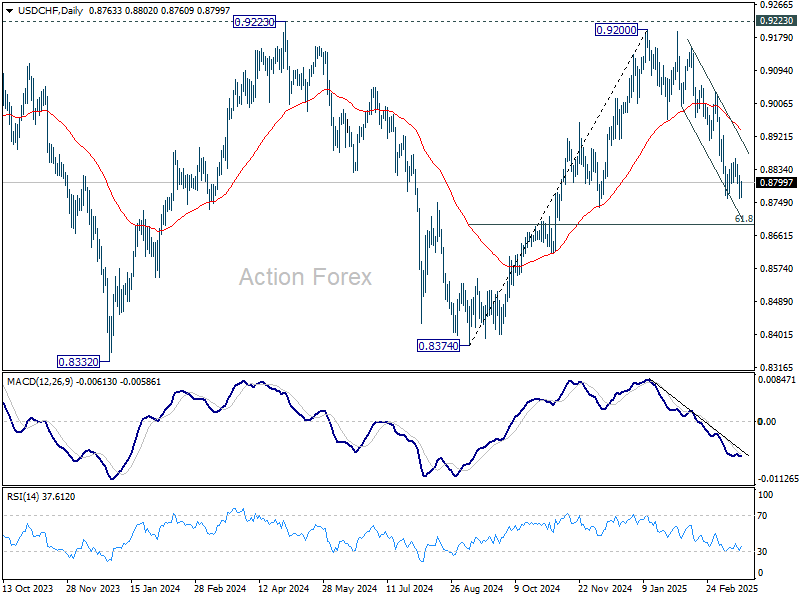
Intraday bias in USD/CHF remains neutral as range trading continues. In case of another recovery, upside should be limited by 0.8911 support turned resistance. On the downside, break of 0.8757 will resume the fall from 0.9200 to 61.8% retracement of 0.8374 to 0.9200 at 0.8690. Sustained break there will pave the way back to 0.8374 support.
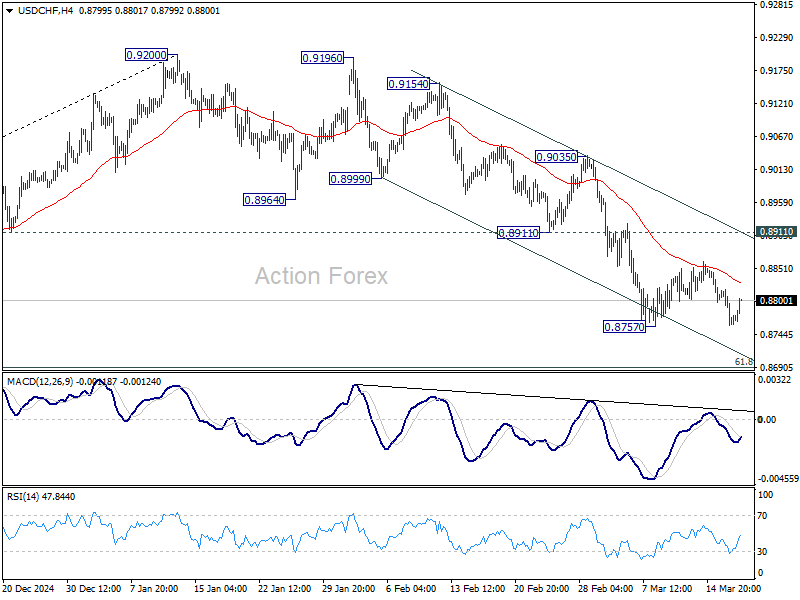
In the bigger picture, rejection by 0.9223 key resistance keep medium term outlook bearish. That is, larger fall from 1.0342 (2017 high) is not completed yet. Firm break of 0.8332 (2023 low) will confirm down trend resumption.
USD/JPY Mid-Day Outlook
Daily Pivots: (S1) 148.89; (P) 149.42; (R1) 149.81; More...
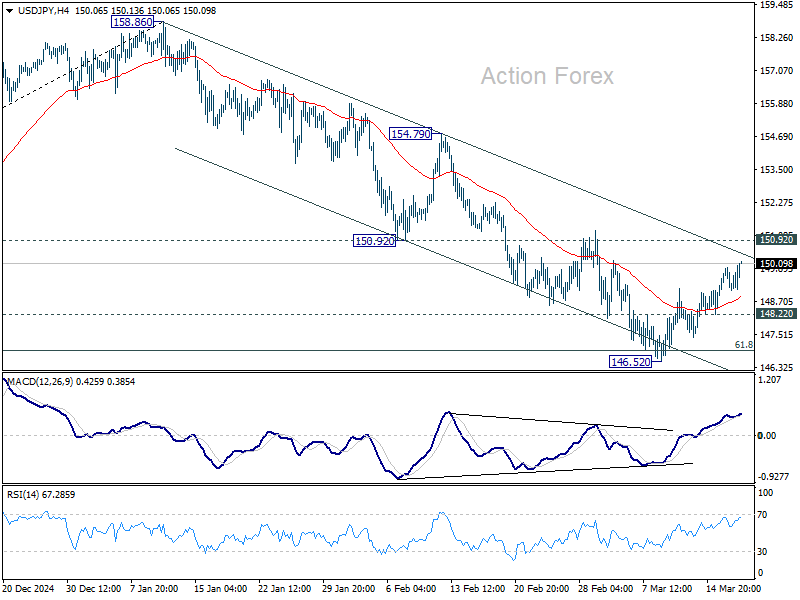
No change in USD/JPY's outlook for now. Recovery from 146.52 is seen as a corrective move. Upside should be limited by 150.92 support turned resistance. On the downside, below 148.22 minor support will bring retest of 146.52 low first. Sustained trading below 61.8% retracement of 139.57 to 158.86 at 146.32 will pave the way to 139.57 support. However, decisive break of 150.92 will dampen this bearish view and turn bias to the upside for 154.79 resistance instead.
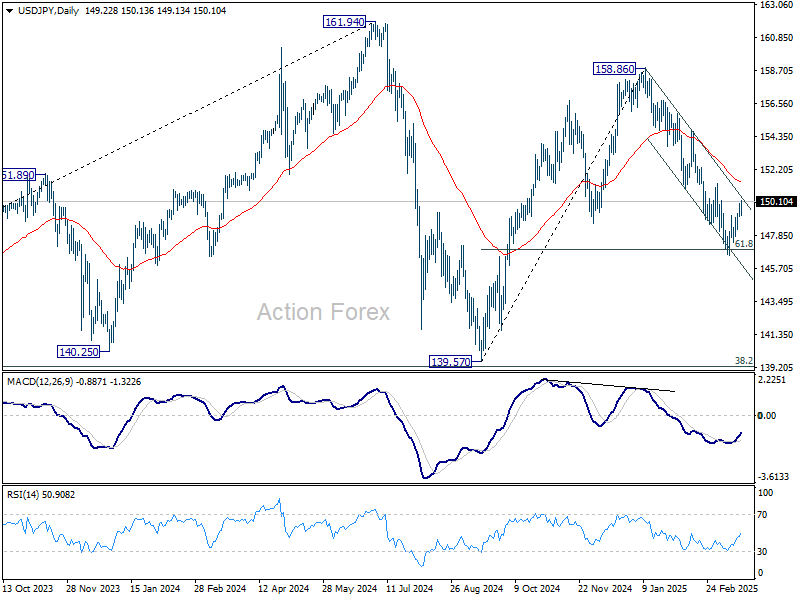
In the bigger picture, price actions from 161.94 are seen as a corrective pattern to rise from 102.58 (2021 low), with fall from 158.86 as the third leg. Strong support should be seen from 38.2% retracement of 102.58 to 161.94 at 139.26 to bring rebound. However, sustained break of 139.26 would open up deeper medium term decline to 61.8% retracement at 125.25.
GBP/USD Mid-Day Outlook
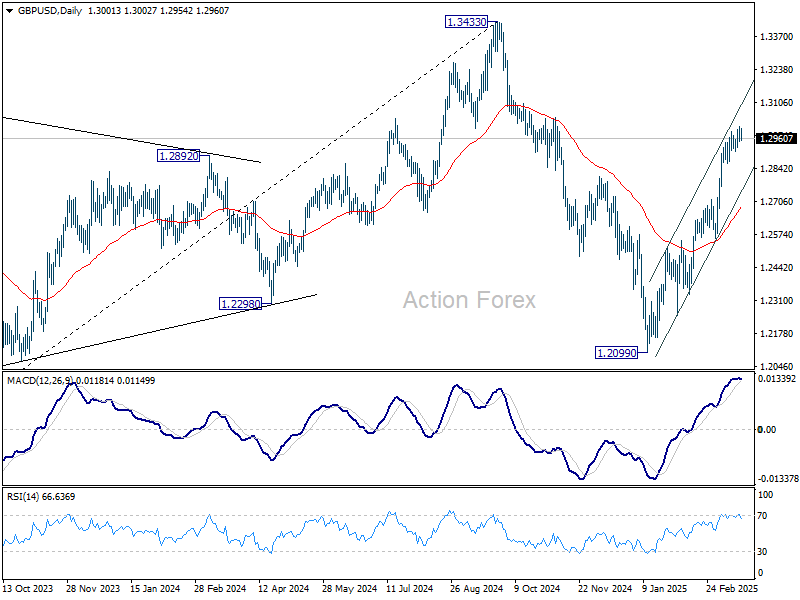
Daily Pivots: (S1) 1.2967; (P) 1.2988; (R1) 1.3025; More...
Intraday bias in GBP/USD is turned neutral first with current retreat. Another rise is expected as long as 1.2910 support holds. Above 1.3009 will resume the rally from 1.2099 to retest 1.3433 high. However, firm break of 1.2910 will indicate short term topping, likely with bearish divergence condition in 4H MACD. That would turn intraday bias back to the downside for deeper pullback.
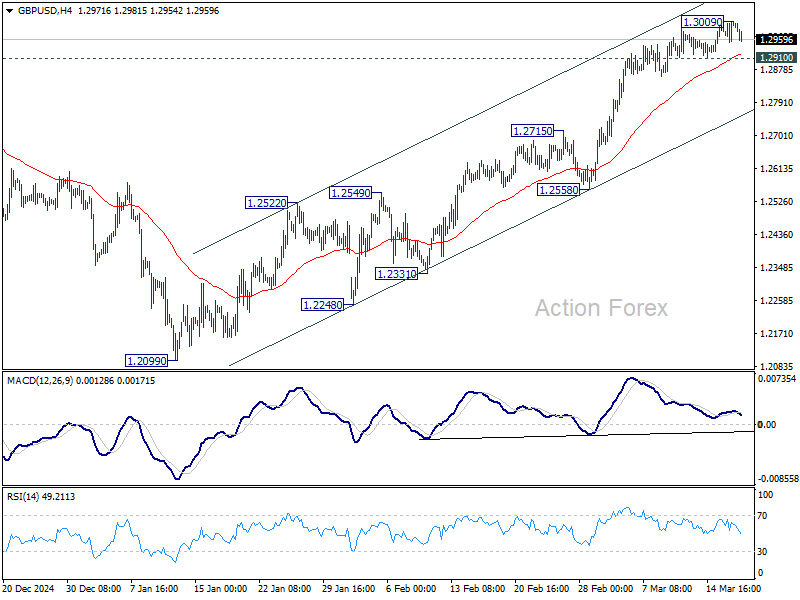
In the bigger picture, up trend from 1.3051 (2022 low) is not completed. Resumption is expected after corrective pattern from 1.3433 completes. Next target will be 1.4248 key resistance. This will now remain the favored case as long as 1.2099 support holds.
Dollar Recovers as Markets Await Fed Projections, Gold Loses Some Momentum
Dollar is recovering across the board as markets enter the US session, though the move appears to be more caution-driven than a shift in sentiment. With FOMC rate decision looming, traders are taking a more neutral stance rather than doubling down on Dollar’s recent weakness. Fed is widely expected to keep rates steady at 4.25-4.50%, so the real focus will be on the updated economic projections. Given the uncertainty surrounding US trade policy, these forecasts could offer the first glimpse of how policymakers are factoring in US President Donald Trump’s tariffs into their outlook.
Since the last FOMC meeting in December, the U.S. has implemented its first set of tariffs under the Trump administration. Now, the markets are preparing for the ambitious reciprocal tariffs set to take effect in early April. While tariff impacts may not be fully reflected in Fed’s projections yet, traders will be looking for any revisions to growth and inflation forecasts that could indicate whether policymakers are growing more concerned about trade war risks. If the Fed acknowledges increased downside risks to growth or upward pressures on inflation, markets could adjust their rate cut expectations accordingly.
Meanwhile, Euro is on the weaker side as Eurozone CPI for February was finalized slightly lower than initial estimates. Comments from ECB officials today are typically cautious. French ECB Governing Council member François Villeroy de Galhau reiterated that the timing and size of rate cuts will depend on data. Meanwhile, ECB Vice President Luis de Guindos emphasized that defense spending remains Europe’s top priority, but warned that budget stability must be maintained within the bloc’s fiscal rules.
For the day so far, Dollar is the strongest performer, followed by the Loonie and Sterling. On the weaker side, Kiwi is the worst performer, followed by Aussie and Euro. Yen and Swiss Franc are positioning in the middle.
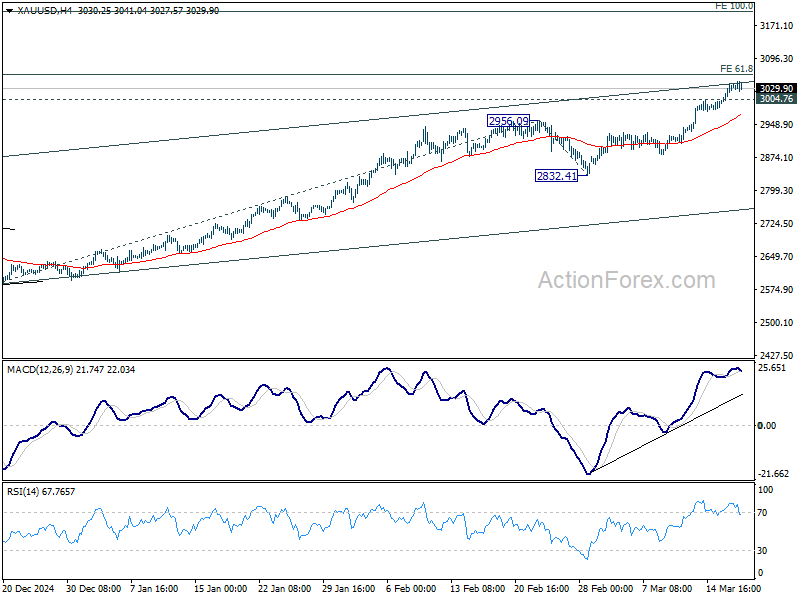
Technically, Gold is losing momentum as it approaches 61.8% projection of 2584.24 to 2956.09 from 2832.41 at 3062.21. This level is close to a key medium-term rising channel resistance, making it a critical test for gold bulls. A break below 3004.76 resistance-turned-support would signal the first rejection at the resistance zone, and leads to a near term pullback.
However, if Dollar resumes its selloff after Fed’s announcement, Gold could break through 3062.21, probably triggering upside acceleration towards 100% projection at 3204.26.
In Europe, at the time of writing, FTSE is down -0.07%. DAX is down -0.81%. CAC is up 0.36%. UK 10-year yield is up 0.003 at 4.65. Germany 10-year yield is down -0.007 at 2.806. Earlier in Asia, Nikkei fell -0.25%. Hong Kong HSI rose 0.12%. China Shanghai SSE fell -0.10%. Singapore Strait Times rose 0.34%. Japan 10-year JGB yield rose 0.026 to 1.531.
Eurozone CPI finalized at 2.3% in Feb, core CPI at 2.6%
Eurozone headline CPI was finalized at 2.3% yoy in February, down from 2.5% yoy in January. Core CPI , which excludes energy, food, alcohol, and tobacco, eased slightly to 2.6% yoy from 2.7% yoy.
The largest driver of Eurozone inflation was services, contributing +1.66 percentage points, followed by food, alcohol, and tobacco (+0.52 pp). Non-energy industrial goods and energy made smaller contributions, with energy adding just +0.01 pps.
In the broader EU, inflation was finalized at 2.7% yoy, down from 2.8% yoy in January. Inflation disparities across member states remain stark, with France (0.9%), Ireland (1.4%), and Finland (1.5%) registering the lowest rates, while Hungary (5.7%), Romania (5.2%), and Estonia (5.1%) recorded the highest. Compared to January, inflation declined in 14 member states, remained unchanged in six, and increased in seven.
BoJ holds rates, flags exchange rate as key inflation factor
BoJ kept its uncollateralized overnight call rate unchanged at around 0.50%, as widely expected.
In its statement, BoJ noted that growth is expected to remain above potential, while inflation progress remains on track toward its 2% target. However, policymakers flagged high levels of uncertainty, particularly citing global trade tensions and policy shifts in major economies as key risks.
A notable shift in BoJ’s tone was its heightened focus on exchange rate movements as a key factor influencing inflation. The central bank acknowledged that with firms increasingly raising wages and prices, exchange rate developments are, compared to the past, "more likely to affect prices".
This suggests that further depreciation in Yen could accelerate price increases, and influence future monetary policy decisions.
Japan’s export rises 11.4% yoy in Feb, up for fifth straight month
Japan’s exports surged 11.4% yoy to JPY 9,191B in February, marking the fifth consecutive month of growth, driven by strong demand from both the US and China. Exports to the US rose 10.5% yoy, while shipments to China saw an even stronger 14.1% yoy increase.
Meanwhile, imports declined by -0.7% yoy, marking their first drop in three months, as demand for crude oil and coal weakened. This shift in trade dynamics helped Japan return to a trade surplus of JPY 584.5B, the first positive balance in two months.
On a seasonally adjusted basis, exports rose 4.0% mom to JPY 9,688B, while imports fell -4.1% mom to JPY 9,505B, leading to a JPY 182B surplus.
GBP/USD Mid-Day Outlook
Daily Pivots: (S1) 1.2967; (P) 1.2988; (R1) 1.3025; More...
Intraday bias in GBP/USD is turned neutral first with current retreat. Another rise is expected as long as 1.2910 support holds. Above 1.3009 will resume the rally from 1.2099 to retest 1.3433 high. However, firm break of 1.2910 will indicate short term topping, likely with bearish divergence condition in 4H MACD. That would turn intraday bias back to the downside for deeper pullback.
In the bigger picture, up trend from 1.3051 (2022 low) is not completed. Resumption is expected after corrective pattern from 1.3433 completes. Next target will be 1.4248 key resistance. This will now remain the favored case as long as 1.2099 support holds.
Ethereum Gives Way
Market picture
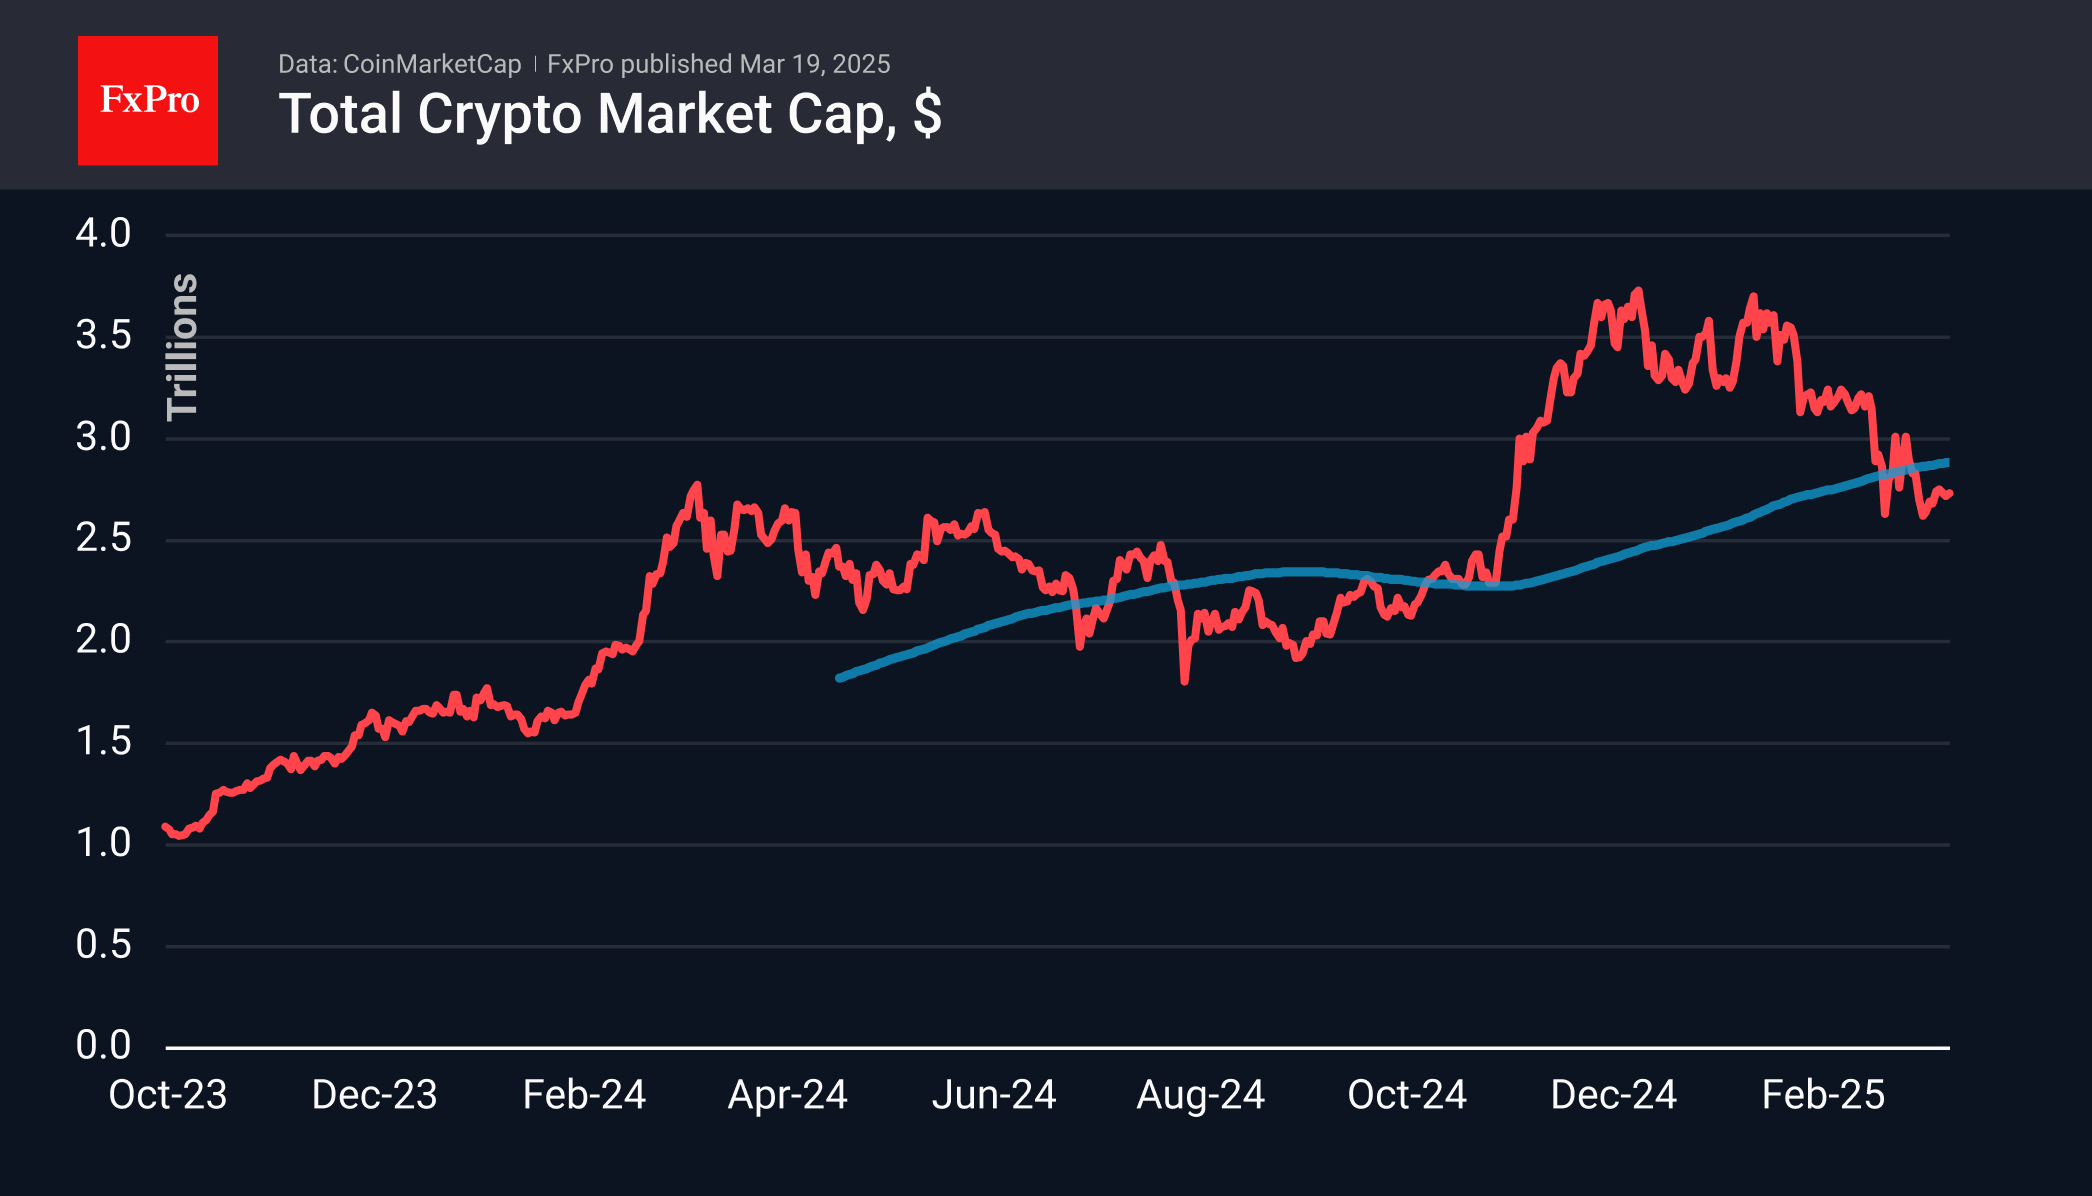
The crypto market remains in a downtrend. Its cap rose 0.2% over the past 24 hours to $2.72 trillion and generally remains in a very tight range with a short-term ceiling of $2.75 trillion. Just over a month ago, similar local resistance was half a trillion higher.
The crypto market remains in a downtrend, with resistance lowered to $2.75 trln from $3.25 trln
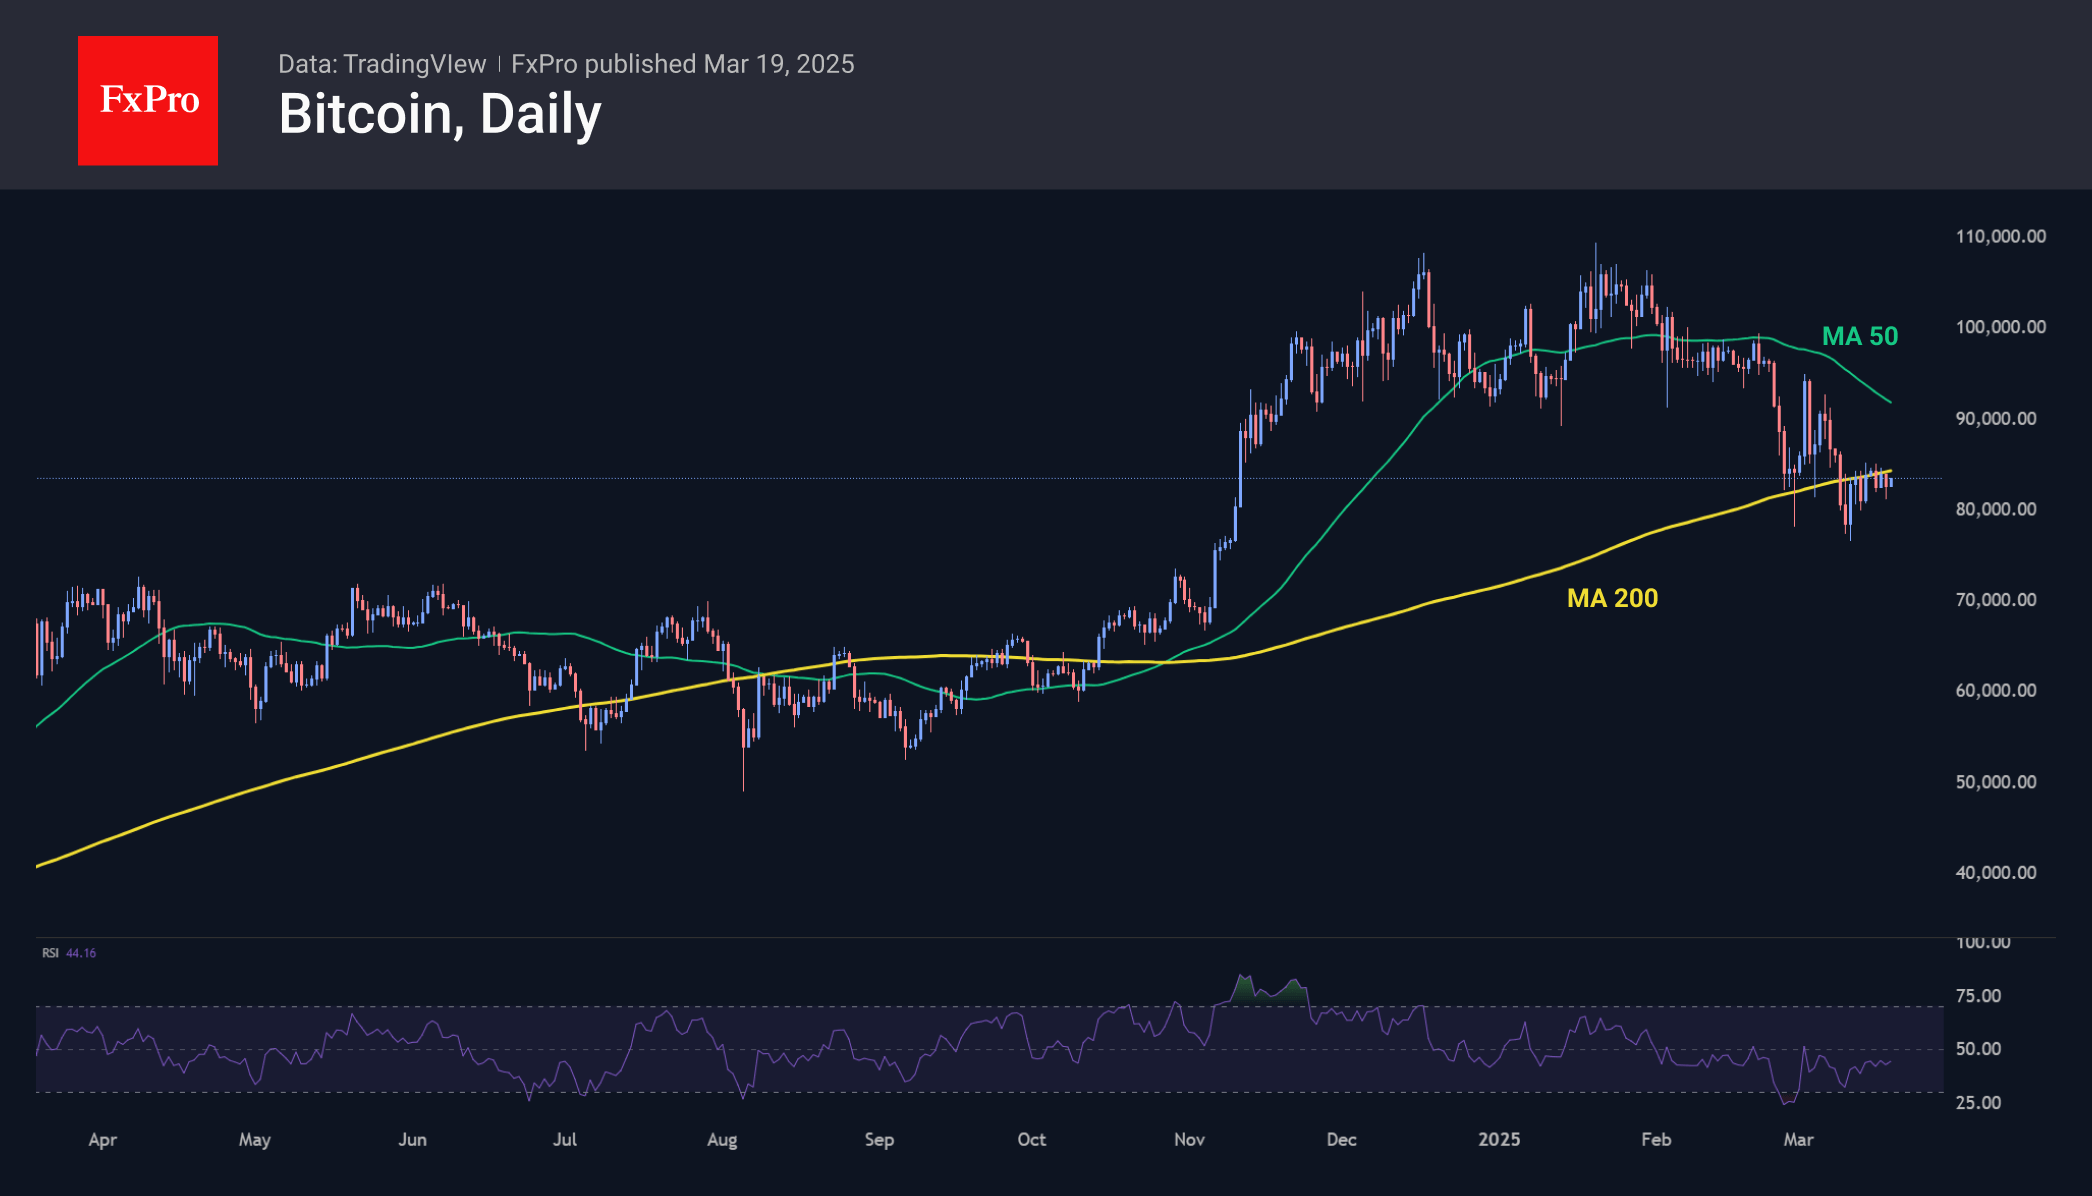
While almost all altcoins combined have been broadly stable at 30% market share since July 2023, Ethereum has been giving away its share since July 2024, falling to 8%, a five-year low. BTC’s share has been growing for more than two years, reaching 60.7%. Interest from institutional traders and governments has so far not extended beyond the first cryptocurrency, which they see as a strategic reserve asset rather than the practicality offered by altcoins, including ETH.
Bitcoin reversed to the downside again on Tuesday, touching its 200-day average. Nevertheless, it gained around 2% from the start of the day to $83.3K on Wednesday. Ultimately, it is worth paying closer attention to the dynamics of the crypto market after the Fed’s comments, as this could be the start of a longer trend.
News Background
Standard Chartered downgraded its 2025 Ethereum forecast from $10,000 to $4,000. One of the reasons is the growing influence of L2 solutions, especially the Base platform. The changes made to Ethereum in recent years, “while perhaps necessary, have damaged its value”.
The US Securities and Exchange Commission is set to relax storage requirements for crypto assets. Current SEC commissioner Mark Uyeda has ordered a review of a proposal to tighten storage rules for cryptocurrencies.
The GMCI Meme Coin Index, tracked by The Block, is down 90% from its peak in December, indicating a cooling of interest in this type of risky asset.
USD/JPY Outlook: Near-Term Recovery Faces Headwinds from Pivotal 150.00 Resistance
USDJPY attacked again pivotal 150 barrier (psychological / bear-channel upper boundary / 30 DMA) in early Wednesday, offsetting initial negative signal from Tuesday’ bearish inverted hammer that was formed after strong upside rejection just under 150 zone.
Yen was deflated by BoJ’s decision to keep interest rates unchanged at 0.5%, as policymakers responded to growing uncertainty over negative impacts from tariffs but also highlighted increased risk that trade war escalation may fuel inflation.
Mixed daily studies add to warning signals about possible stall of recovery leg from 148.53 (Mar 11 low) which was sparked by a double bear trap under 146.95 Fibo support.
Another failure at 150 pivot would increase downside risk, though near-term bias would remain with bulls as long as the price holds above 20DMA (148.86).
Firm break of 150 barrier to spark stronger acceleration higher and expose targets at 151.30/88 (Mar 3 lower top /200DMA).
Conversely, loss of 20DMA handle would weaken near term structure and generate initial signal that corrective phase might be over.
Res: 150.00; 150.73; 151.00; 151.30.
Sup: 149.14; 148.86; 148.35; 147.73.

Bank of Japan Maintains Rate, Yen Hits 150
The Japanese yen continues to lose ground against the US dollar. In the European session, USD/JPY is trading at 149.74, up 0.32% on the day. Earlier, the yen reached the symbolic 150 level for the first time in two weeks.
BoJ notes concern about US trade policy
There were no surprises from the Bank of Japan, which maintained rates at 0.50%. The decision was widely expected and the yen has posted modest losses today. The Bank's rate statement noted that "inflation expectations have risen moderately ", an acknowledgement of upwards pressure on inflation.
Governor Kazuo Ueda said at his press conference that "wage and price conditions are on track, possibly stronger than expected". However, Ueda added that the US and global outlook were "uncertain" and the Bank would determine its rate path based on upcoming data.
The BoJ has stressed that it will continue to hike rates if it sees that inflation is kept sustainable by rising wages. The BoJ wanted to see strong wage gains at the recent wage negotiations and should be pleased that large employers are offering wage hikes of around 5%.
Governor Ueda also expressed concern about US trade policy, saying "it is hard to qualify the risk" of US tariffs on Japan economic and inflation outlook. The US hasn't slapped tariffs on Japan but the country relies heavily on its export sector and Japanese manufacturers reported a decrease in confidence in March.
Fed expected to hold rates
The Federal Reserve meets later today and is virtually certain to maintain the benchmark rates at 4.25%-4.5%. The economic outlook has darkened recently, with the stock market selloff and an escalating trade war. The markets have priced in another hold at the May meeting at 83%, up from 56% in early March, according to CME FedWatch.