
Sample Category Title
ECB’s Lagarde stresses commitment to price stability amid exceptional high uncertainty
ECB President Christine Lagarde highlighted the "exceptionally high" level of global uncertainty in her speech today, highlighting the challenges posed by trade policy shifts and geopolitical tensions.
She noted that an index measuring trade policy uncertainty is now close to 350—more than six times its average value since 2021. Geopolitical risk indicators are at levels unseen since the Cold War, aside from periods of war and major terrorist attacks.
Against this backdrop, Lagarde emphasized that ECB’s primary focus remains on maintaining price stability over the medium term, stressing that this commitment is "more important than ever" in an unpredictable economic environment.
To achieve this, Lagarde stressed the need for "agility to respond to new shocks" while maintaining a structured policy framework that prevents "short-sighted reactions and unbridled discretion".
She also noted the importance of combining agility with clarity, stating that while the ECB may not always be able to provide certainty about the exact path of interest rates, it can ensure "clarity about our reaction function".
GBP/USD Rallies While EUR/GBP Gains Strength
GBP/USD is showing bullish signs above the 1.2870 zone. EUR/GBP is gaining pace and might extend its upward move above the 0.8445 zone.
Important Takeaways for GBP/USD and EUR/GBP Analysis Today
- The British Pound is gaining pace above the 1.2870 zone against the US Dollar.
- There is a connecting bullish trend line forming with support at 1.2925 on the hourly chart of GBP/USD at FXOpen.
- EUR/GBP started a fresh increase above the 0.8360 resistance zone.
- There is a major bullish trend line forming with support at 0.8402 on the hourly chart at FXOpen.
GBP/USD Technical Analysis
On the hourly chart of GBP/USD at FXOpen, the remained in a positive zone above the 1.2560 level. The British Pound formed a base and started a fresh increase against the US Dollar, as mentioned in the previous analysis.
The pair gained pace for a move above the 1.2715 and 1.2760 resistance levels. The pair even settled above the 1.2900 level and the 50-hour simple moving average.
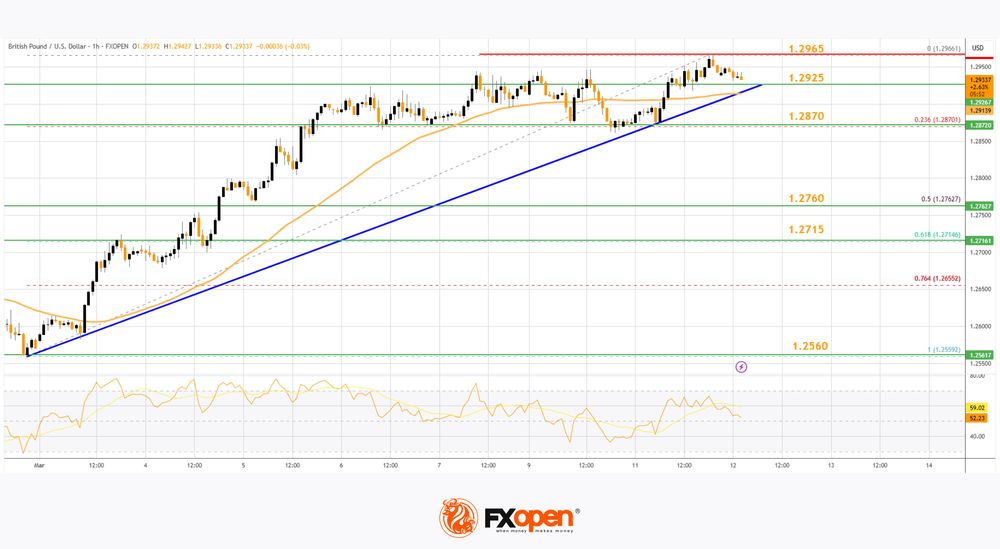
On the upside, the GBP/USD chart indicates that the pair is facing resistance near 1.2965. The next major resistance is near the 1.2980 level. If the RSI moves above 60 and the pair climbs above 1.2980, there could be another rally. In the stated case, the pair could rise toward the 1.3050 level or even 1.3120.
On the downside, there is a major support forming near 1.2925. There is also a connecting bullish trend line forming with support at 1.2925. If there is a downside break below the 1.2925 support, the pair could accelerate lower.
The next major support is near the 1.2870 zone or the 23.6% Fib retracement level of the upward move from the 1.2559 swing low to the 1.2966 high, below which the pair could test 1.2800.
Any more losses could lead the pair toward the 1.2760 support. It is close to the 50% Fib retracement level of the upward move from the 1.2559 swing low to the 1.2966 high.
EUR/GBP Technical Analysis
On the hourly chart of EUR/GBP at FXOpen, the pair started a fresh increase from the 0.8240 zone. The Euro traded above the 0.8360 level to move into a positive zone against the British Pound.
The EUR/GBP chart suggests that the pair settled above the 50-hour simple moving average and 0.8400. Immediate resistance is near 0.8445. The next major resistance for the bulls is near the 0.8460 zone.
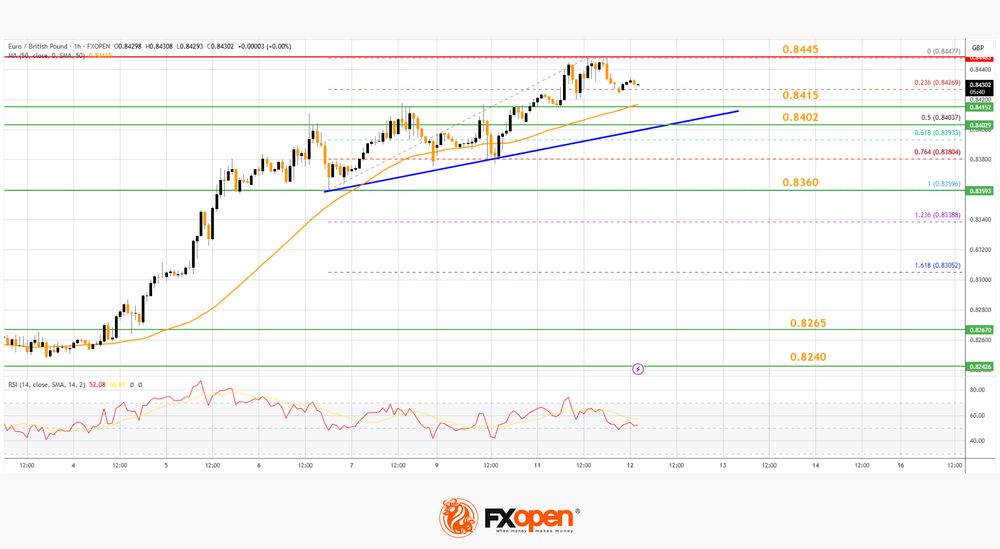
A close above the 0.8460 level might accelerate gains. In the stated case, the bulls may perhaps aim for a test of 0.8500. Any more gains might send the pair toward the 0.8550 level in the coming days.
Immediate support sits near the 23.6% Fib retracement level of the upward move from the 0.8359 swing low to the 0.8447 high. The next major support is near a major bullish trend line at 0.8402.
The 61.8% Fib retracement level of the upward move from the 0.8359 swing low to the 0.8447 high is also at 0.8402. A downside break below the 0.8402 support might call for more downsides.
In the stated case, the pair could drop toward the 0.8360 support level. Any more losses might send the pair toward the 0.8265 level in the near term.
Trade over 50 forex markets 24 hours a day with FXOpen. Take advantage of low commissions, deep liquidity, and spreads from 0.0 pips. Open your FXOpen account now or learn more about trading forex with FXOpen.
This article represents the opinion of the Companies operating under the FXOpen brand only. It is not to be construed as an offer, solicitation, or recommendation with respect to products and services provided by the Companies operating under the FXOpen brand, nor is it to be considered financial advice.
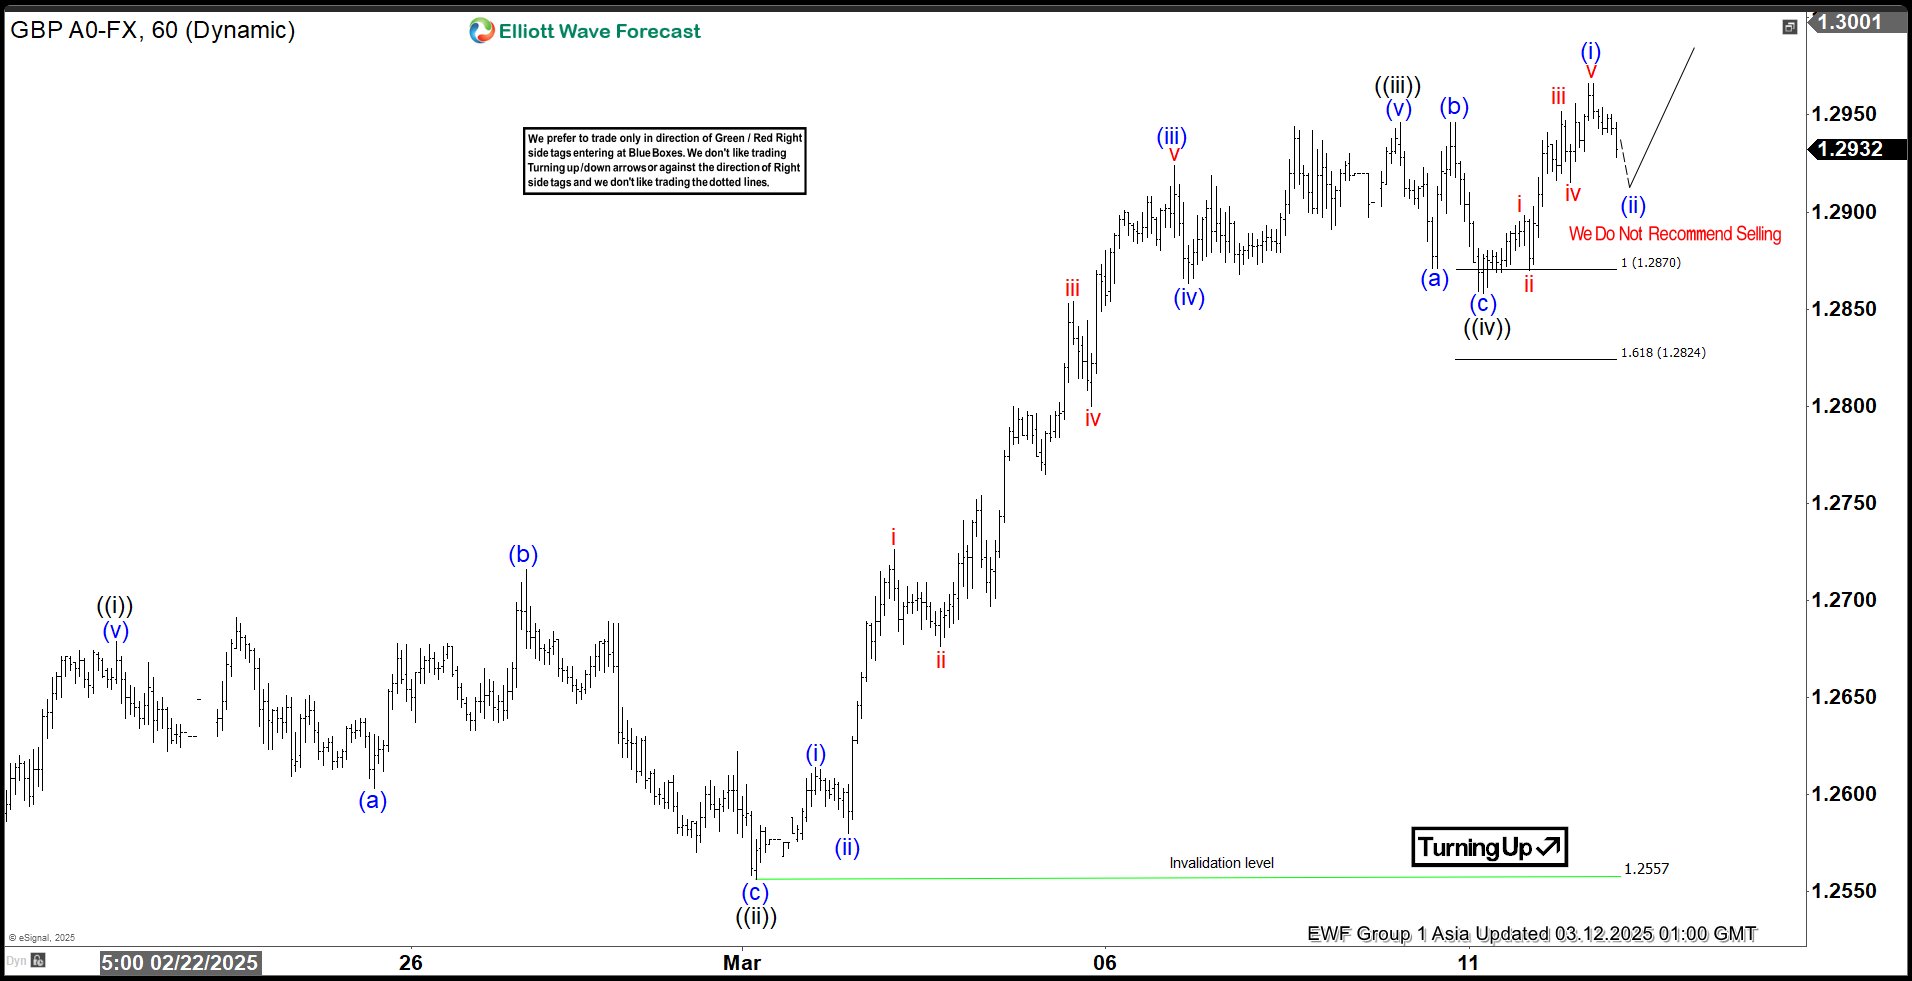
Elliott Wave View: GBPUSD Extending Higher in Wave 5 Impulse
Short Term Elliott Wave View in GBPUSD suggests cycle from 2.3.2025 low is in progress as an impulse. Up from 2.3.2025 low, wave ((i)) ended at 1.2679 s the 1 hour chart below shows. Wave ((ii)) pullback unfolded as an expanded Flat Elliott Wave structure. Down from wave ((i)), wave (a) ended at 1.2603 and wave (b) ended at 1.2716. Wave (c) lower ended at 1.2557 which completed wave ((ii)) in higher degree. Up from there, wave (i) ended at 1.2614 and wave (ii) ended at 1.258. Wave (iii ) higher ended at 1.292 and wave (iv) ended at 1.286. Wave (v) ended at 1.294 which completed wave ((iii)).
Pullback in wave ((iv)) ended at 1.2858 with internal subdivision as a zigzag. Down from wave ((iii)), wave (a) ended at 1.287 and wave (b) ended at 1.294. Wave (c) lower ended at 1.2858 which completed wave ((iv)). Pair has resumed higher in wave ((v)). Up from wave ((iv)), wave (i) ended at 1.2966. Expect wave (ii) pullback to hold above 1.2858, and more importantly above 1.2557 for further upside. As far as pivot at 1.2557 low stays intact, expect dips to find support in 3, 7, or 11 swing for more upside.
GBPUSD 60 Minutes Elliott Wave Chart
GBPUSD Video
https://www.youtube.com/watch?v=aEVkLcSi6HI
Markets Haunted by Multiple, Often Contradictory Story Llines
Markets
Markets recently were haunted by multiple, often contradictory story lines ranging from the potential impact of US tariffs on growth and inflation inside and outside the US, the impact of a fiscal U-turn in Europe, the potential consequences of a cease-fire in Ukraine and the presumed reaction function of central bankers (in particular the Fed and the ECB) on incoming regular inflation and activity data. This complex mix was and remains a perfect prescript of heightened volatility. Yesterday, the storylines of tariffs and Ukraine prevailed. After a ‘calm’ start in Europe, President Trump again rocked the boat. While the US as planned held to raising tariffs on all steel and aluminum to 25% from today on, Trump said Canada would be hit by and additional levy of (total 50 %) as Ontario had announced a retaliatory levy on electricity exported the to the US. This outright escalation of the trade war triggered a new risk-off wave. In the end, Trump’s 50% tariff was scaled back to 25% (Ontario also backtracked). It caused some intraday relief for US equities, but US indices still closed well in negative territory (S&P 500 -0.76%). Despite intraday uncertainty, US yields intraday showed a bottoming out process after recent steep declines. US yields added between 5.5 bps (30-y) and 6.8 bps (5-y). Risk premia outweighing growth fears? In Europe, the established steepening trend of the yield curve unabatedly continued. The 2-y German yield eased marginally (-1.7 bps) but longer maturities again jumped higher (30-y, +6.6 bps). Headlines filtering through on a potential ceasefire in Ukraine (agreement between the US and Ukraine now being forwarded to Russia) only supported the revive Europe trade, with both inflation expectations and real yields rising further. The announcement of the ‘Ukraine’ agreement, also briefly propelled EUR/USD to a new correction top near 1.0945 (close 1.092). The dollar global remained in the defensive with the DXY testing the lowest levels since end October (103.42).
Asian markets are trading mixed this morning. Uncertainty in US (tariff and other) policies remains elevated. The proposal on a ceasefire for the war in Ukraine might be supportive for European (equity) markets. At the same time, the EU this morning already announcement counter-measures planning to impose tariffs on €26 bln of US imports, potentially escalating the trade war. Later today, the ‘data story-line’ might also again come into play with the US February CPI inflation data. Markets expect a 0.3% M/M rising for headline and core inflation resulting in respectively 2.9% and 3.3% Y/Y inflation. Overall noise complicates the reaction function. Even so, a figure in line/higher than expected might supported a tentative bottoming in yields after recent setback. Despite Powell’s balanced wait-and-see guidance, a soft figure might trigger a retest of recent lows. In Europe, the ‘ECB and Its Watchers conference’ in Frankfurt might yield interesting headlines, too. How close is the ECB to a pause or even to the bottom of its easing cycle? First indications this morning suggest EMU yields to stabilize near recent peak levels in the wake of the proposal in a cease-fire in Ukraine. EUR/USD eases slightly. In any both cases, we expect any corrections to stay limited.
News & Views
The US House approves (217-213 vote) a proposal to keep the government funded into fall (September 30) and avoid a government shutdown from kicking in this weekend. The proposal extends funding at fiscal 2024 spending levels, but includes a $6bn increase in military spending and more money for border enforcement. Cuts are made in nondefense spending and Washington DC’s budget. The continuing resolution now heads to Senate where the 60-vote threshold means that Democratic support will be needed. Republicans have a 53-47 majority in Senate. There’s no option included to revise it and return it to the House so it’s either approving or blocking.
Portugal is heading for a third election in less than four years after PM Montenegro lost a confidence vote last night. Opposition socialists, other left-wingers and the extreme right combined forces to shoot down the minority government triggered by a corruption scandal around the PM. Latest election polls show Socialists leading with 30.8% of the vote ahead of 25.8% for the ruling Democratic Alliance coalition. New elections are expected to take place in May.
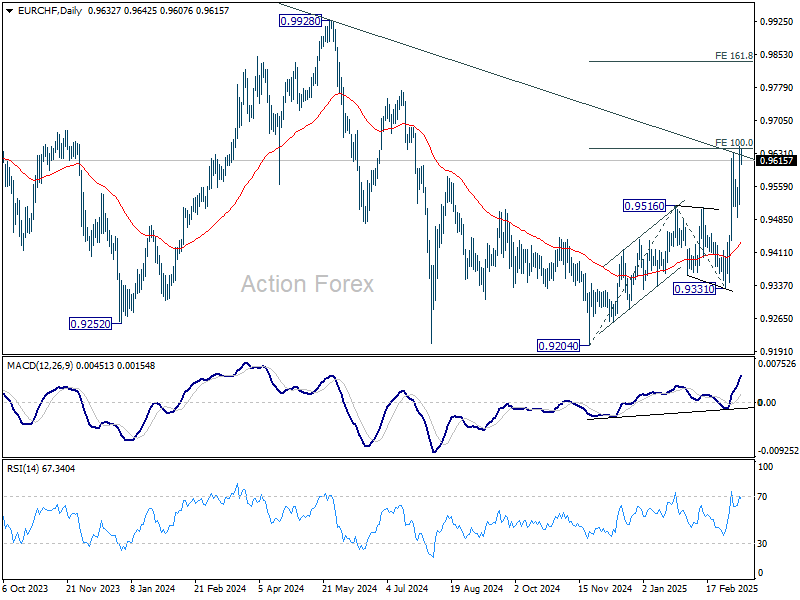
EUR/CHF Daily Outlook
Daily Pivots: (S1) 0.9555; (P) 0.9602; (R1) 0.9686; More....
EUR/CHF's rally resumed by breaching 0.9634 and intraday bias is back on the upside. Sustained break of 100% projection of 0.9204 to 0.9516 from 0.9331 at 0.9643 will pave the way to 161.8% projection at 0.9836 next. For now, further rise is expected as long as 0.9489 support holds, in case of retreat.
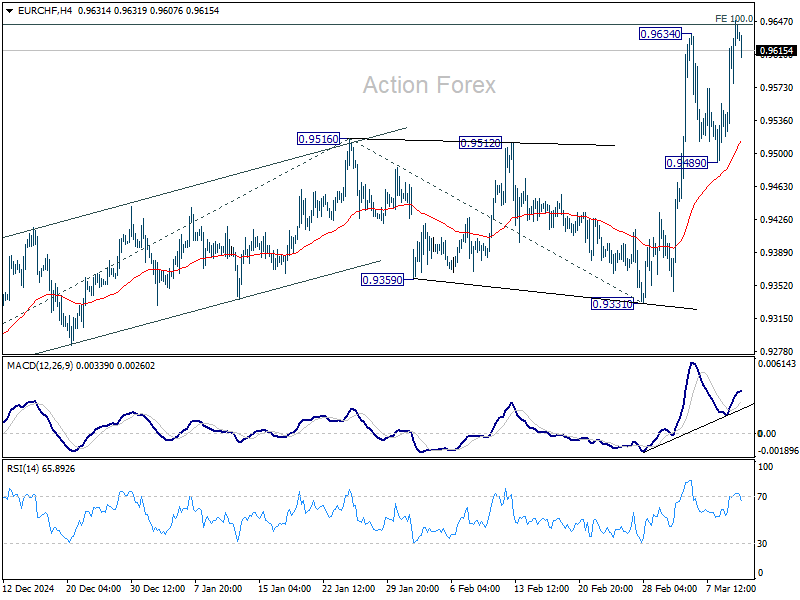
In the bigger picture, the strong break of 55 W EMA (now at 0.9482) is a medium term bullish sign. Sustained break trading above long-term falling channel resistance (at around 0.9620) would suggest that the downtrend from 1.2004 (2018 high) has bottomed at 0.9204. Stronger rally should then be see to 0.9928 key resistance at least.
EUR/AUD Daily Outlook
Daily Pivots: (S1) 1.7250; (P) 1.7334; (R1) 1.7422; More...
Intraday bias in EUR/AUD stays on the upside for the moment. Rise from 1.6335 is in progress for 161.8% projection of 1.5963 to 1.6800 from 1.6355 at 1.7709 next. On the downside, below 1.7102 minor support will turn intraday bias neutral again and bring consolidations, before staging another rally.
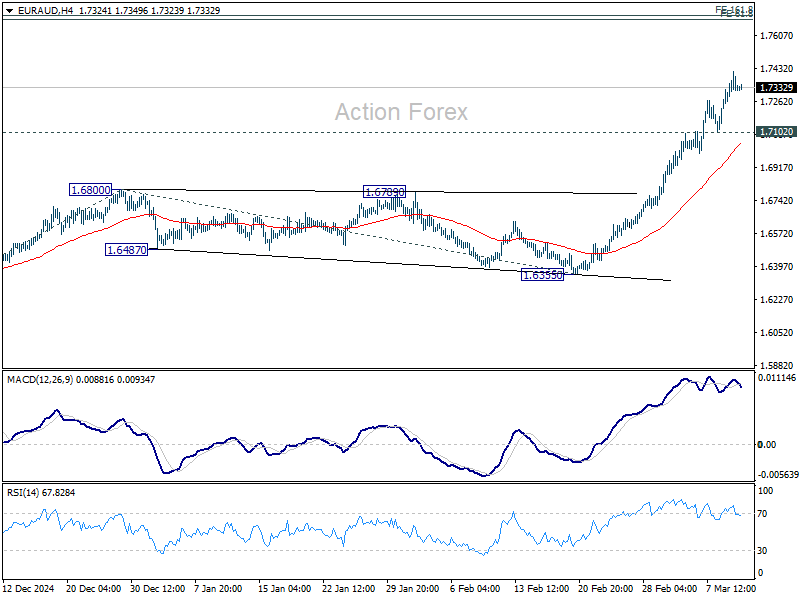
In the bigger picture, up trend from 1.4281 (2022 low) is resuming. Sustained trading above 1.7180 key resistance will pave the way to 61.8% projection of 1.4281 to 1.7062 from 1.5963 at 1.7682, which is also close to 61.8% retracement of 1.9799 (2020 high) to 1.4281 at 1.7691. For now, this will remain the favored case as long as 1.6355 support holds, even in case of deep pullback.
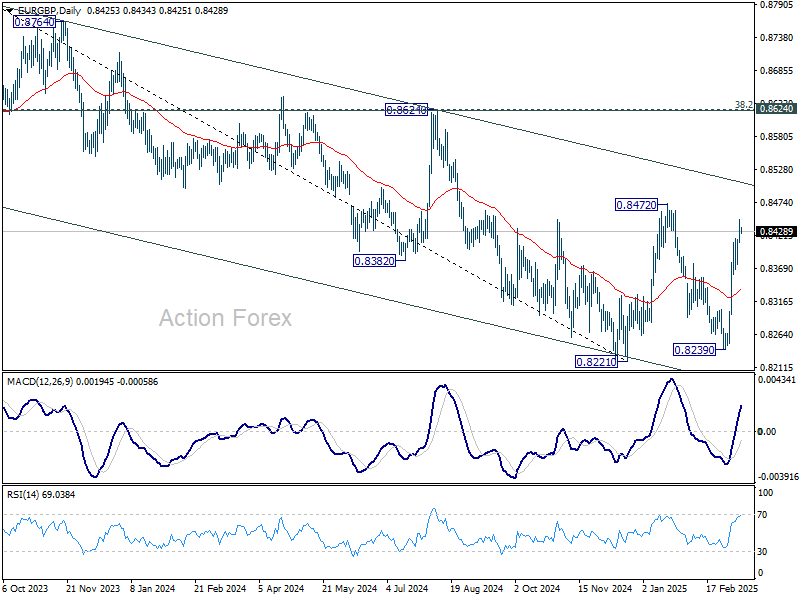
EUR/GBP Daily Outlook
Daily Pivots: (S1) 0.8409; (P) 0.8429; (R1) 0.8453; More...
Intraday in EUR/GBP remains on the upside as rise from 0.8239 is still in progress for 0.8472 resistance. Firm break there will remain whole rebound from 0.8221 to medium term falling channel resistance. On the downside, below 0.8376 will turn bias neutral and bring consolidations again.
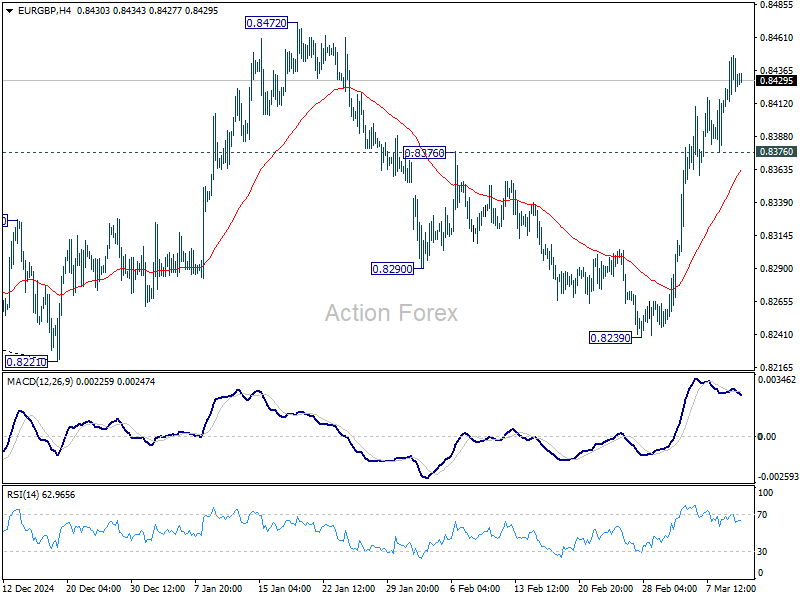
In the bigger picture, EUR/GBP is still bounded inside medium term falling channel. While rebound from 0.8221 might extend higher, it could still develop into a corrective pattern. Overall outlook will be neutral at best and down trend from 0.9267 (2022 high) could extend, at least until decisive break of channel resistance (now at 0.8506).
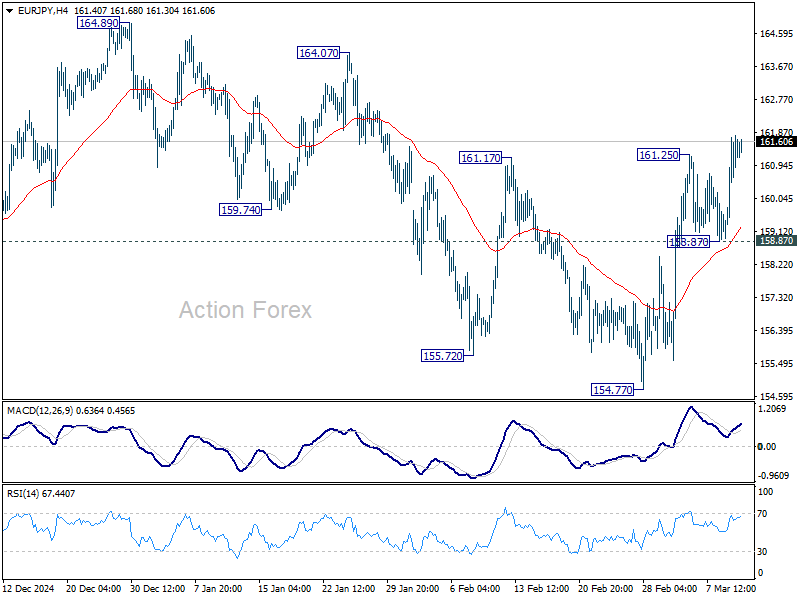
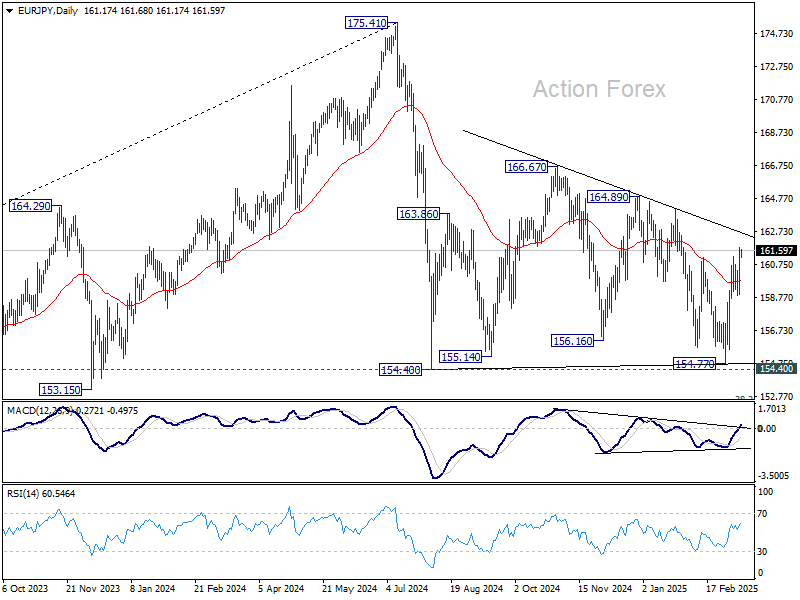
EUR/JPY Daily Outlook
Daily Pivots: (S1) 159.62; (P) 160.71; (R1) 162.44; More...
Intraday bias in EUR/JPY stays on the upside for the moment. Rise from 154.77 is seen as another rising leg in the consolidation pattern from 154.40. Next target is 164.89 resistance. For now, further rally is expected as long as 158.87 support holds, in case of retreat.
In the bigger picture, price actions from 175.41 are seen as correction to rally from 114.42 (2020 low). Strong support should be seen from 38.2% retracement of 114.42 to 175.41 at 152.11 to contain downside. However, sustained break of 152.11 will bring deeper fall even still as a correction.
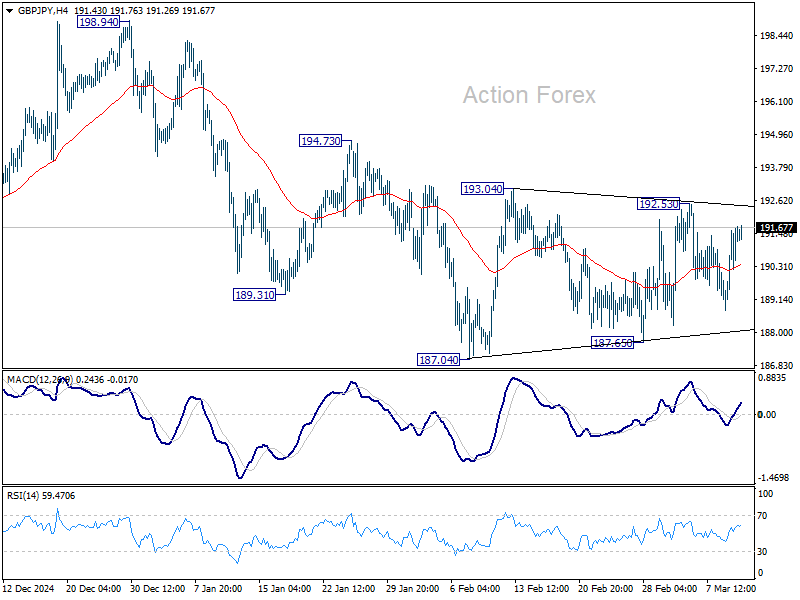
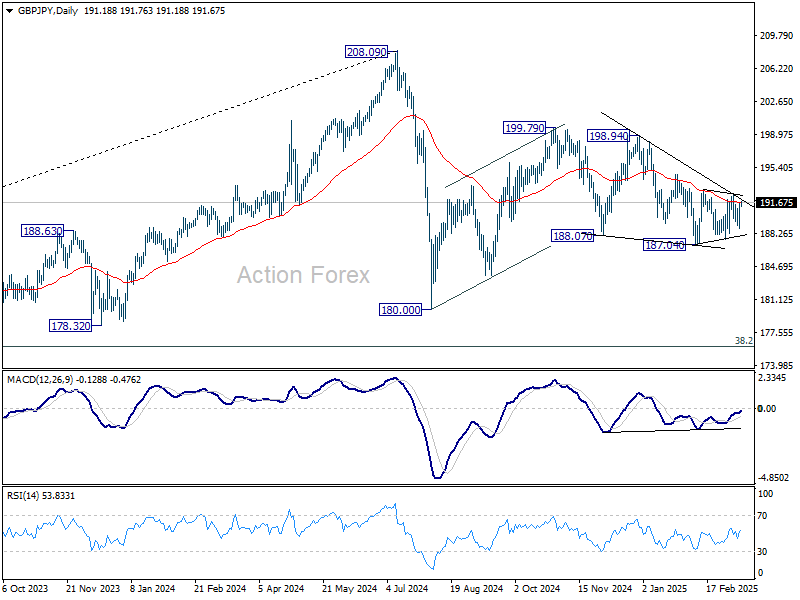
GBP/JPY Daily Outlook
Daily Pivots: (S1) 189.56; (P) 190.62; (R1) 192.44; More...
Intraday bias in GBP/JPY stays neutral as range trading continues. On the upside, firm break of 192.53 will resume the rebound from 187.04 to 194.73 resistance, and then 198.94. On the downside, firm break of 187.04 will extend the fall from 199.79 towards 180.00 support. Overall, corrective pattern from 180.00 might still be extending.
In the bigger picture, price actions from 208.09 are seen as a correction to rally from 123.94 (2020 low). Strong support should be seen from 38.2% retracement of 123.94 to 208.09 at 175.94 to contain downside. However, sustained break of 152.11 will bring deeper fall even still as a correction.
Talk Is Not Cheap
American and Canadian officials have spent the last few hours imposing tariffs on each other—only to roll them back —adding to the absurdity of the tariff situation. The problem is that this tariff charade has real-time consequences and that’s weighing on investor sentiment and pressuring market valuations.
American manufacturers are already paying significantly more for aluminum, steel, and copper than their overseas rivals as they rush to accumulate stocks before tariffs go live – which could happen overnight. The widening gap between the raw material prices paid by Americans versus their European and Asian peers is making the American manufacturers less cost-efficient compared to rivals, weighs on business confidence and fuels inflation even before the tariffs are imposed. And the expectation for squeezed profit margins due to actually rising raw material prices is weighing on market valuations.
As a consequence, the market volatility is rising as visibility becomes cloudier by the day, any market rebound may not be viable unless there is a form of stability in the White House – but that doesn’t seem to be on the menu du jour. The higher volatility will likely convince more investors to step out of their bullish positions. Given the high long positioning in the US assets, we could see the selloff extend.
All eyes on US CPI
The US will update its inflation numbers today and tomorrow, and the data is important. It’s important because the tariff situation will probably start to show in producer prices, then impact consumer prices in the continuation. As such, today’s CPI data is expected to show a slight easing for both headline and core inflation in February, and for both monthly and yearly figures. On Thursday, the PPI data may also show slower inflationary pressures for February. Afterall, the energy prices have been tumbling since the start of the year and that could counter the rise in food prices, especially the egg crisis. But whether the disinflation could continue is yet to be seen.
A set of inflation numbers in line with expectations, or ideally softer-than-expected, won’t guarantee that inflation will remain under control but will give a bigger margin to the Federal Reserve (Fed) to act if necessary. A set of inflation numbers above expectations, on the other hand, would be the sour cherry on top of an already staling cake. The higher the inflation the less likely the Fed will cut the rates, unless the market selloff gets ugly to an extent to threaten the financial stability.
The US dollar continues to lose value across the board on the expectation of a sharp US economic slowdown that could even lead to a recession in the second half. Activity on Fed funds futures hints that the first rate cut from the Fed is seen in June, but acceleration of the market selloff could pull the timeline to May. For now, the probability of a May cut is given around 60% chance.
Across the Atlantic, yesterday saw the selloff in the Stoxx 600 index accelerate. The initial sugar high due to massive spending plans is now replaced by negotiations across the political spectrum as the parties involved are trying to get a bigger part of the cake for themselves... But in fine, security comes first. Therefore, the European stocks should continue to outperform their US peers on converging growth expectations between the two continents. The convergence trade between the S&P500 and the Stoxx 600 should remain in play. Inflation from European defence spending could – at least in the short run - remain limited for specific sectors, which could eventually allow the European Central Bank (ECB) to keep its rates at a sweet spot to growth across Europe.