
Sample Category Title
Loonie falls as Trump raises tariffs on Canadian metals to 50%, threatens auto industry next
Canadian Dollar tumbled broadly after US President Donald Trump announced a significant tariff escalation on Canadian steel and aluminum imports.
In a Truth Social post, Trump said he instructed the Commerce Secretary to impose an additional 25% tariff on these products, raising the total tariff to 50%.
The new measure, set to take effect Wednesday morning, is being framed as a response to Ontario’s 25% tariff on electricity exports to the US.
Trump also demanded that Canada immediately eliminate its long-standing tariffs of 250% to 390% on various US dairy products, calling them "outrageous."
The tariff threat didn't stop there. Trump warned that if Canada does not remove other tariffs he deems excessive, the US will "substantially increase" tariffs on Canadian automobile imports starting April 2nd.
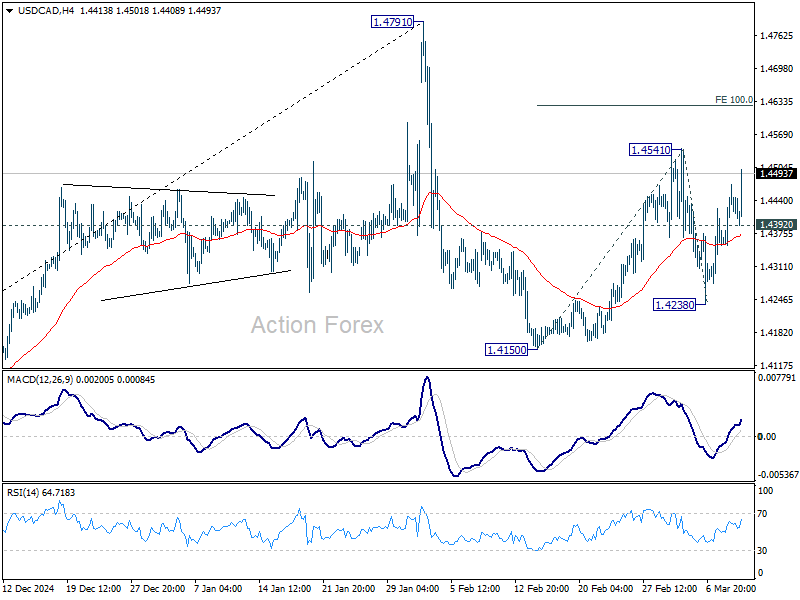
Overall outlook in USD/CAD is unchanged that it's still extending the corrective pattern from 1.4791 high. But current upside acceleration argues that rise from 1.4150 might be the second leg of the pattern. Break of 1.4541 will target 100% projection of 1.4150 to 1.4541 from 1.4238 at 1.4629 and above. Neverthless, break of 1.4392 minor support will bring deeper fall back to 1.4238 and below.
EUR/USD Mid-Day Outlook
Daily Pivots: (S1) 1.0802; (P) 1.0839; (R1) 1.0872; More...
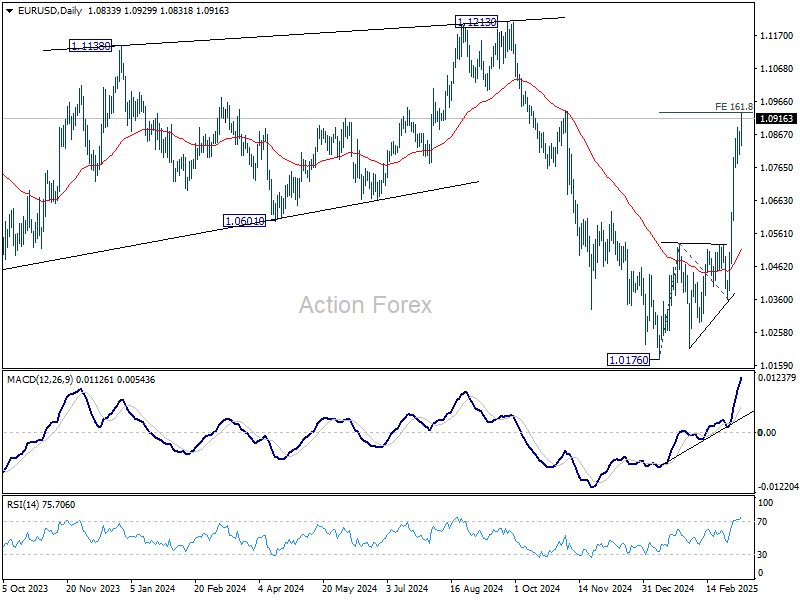
EUR/USD's rally resumed after brief consolidations and intraday bias is back on the upside. Firm break of 161.8% projection of 1.0176 to 1.0531 from 1.0358 at 1.0932 will pave the way back to 1.1274 key resistance next. On the downside, below 1.0804 support will turn intraday bias neutral again.
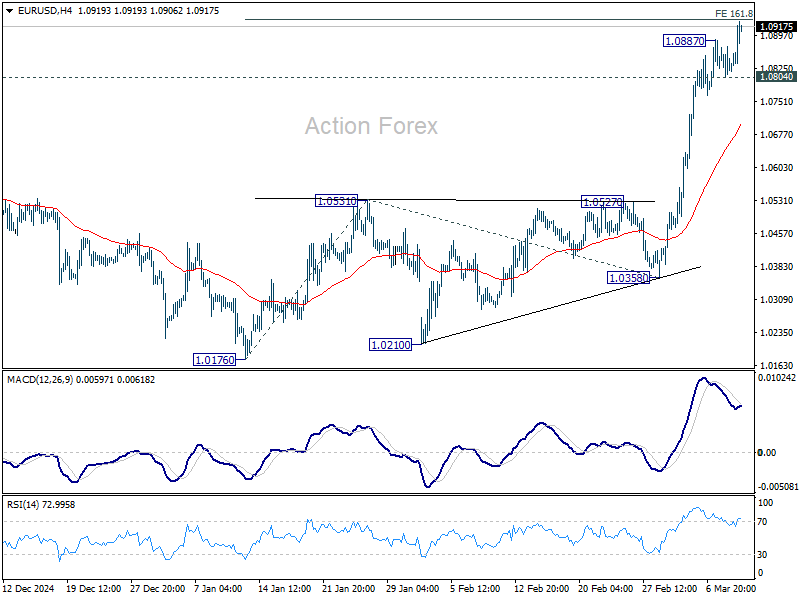
In the bigger picture, the strong break of 55 W EMA (now at 1.0675) suggests that fall from 1.1274 (2024 high) has completed as a three wave correction to 1.0176. Rise from 0.9534 is still intact, and might be ready to resume. Decisive break of 1.1274 will target 100% projection of 0.9534 to 1.1274 from 1.0176 at 1.1916. Also, that will send EUR/USD through a multi-decade channel resistance will carries larger bullish implication. This will now be the favored case as long as 1.0531 resistance turned support holds.
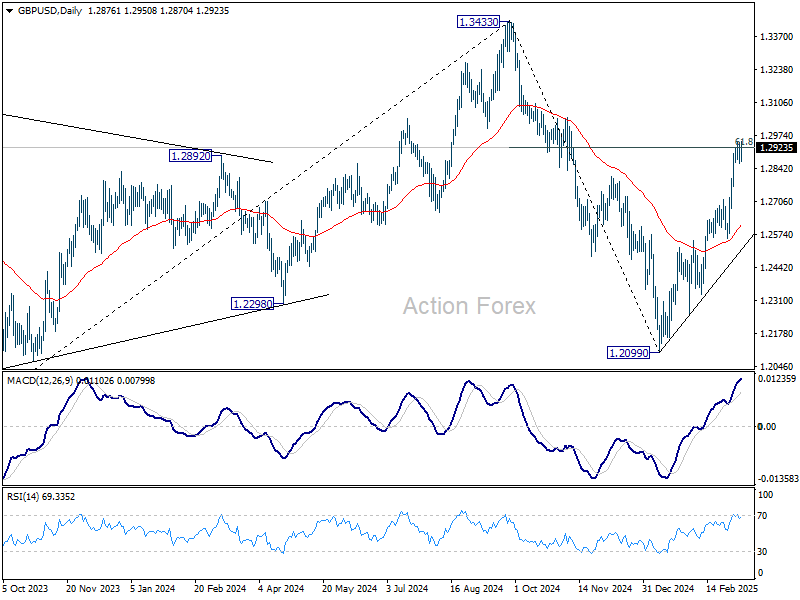
GBP/USD Mid-Day Outlook
Daily Pivots: (S1) 1.2843; (P) 1.2895; (R1) 1.2928; More...
Intraday bias in GBP/USD remains neutral first and some more consolidations might be seen. Downside of retreat should be contained by 1.2715 resistance turned support to bring another rally. On the upside, sustained break of 61.8% retracement of 1.3433 to 1.2099 at 1.2923 will pave the way back to 1.3433 high.
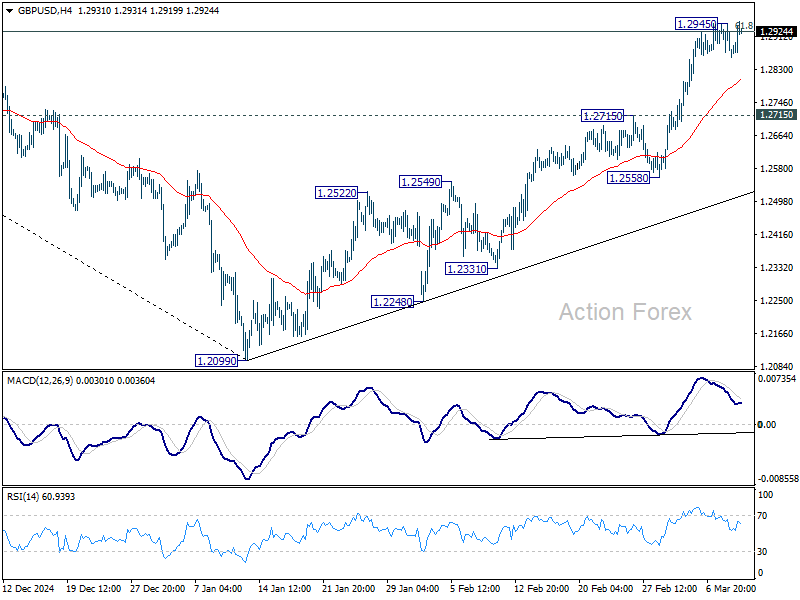
In the bigger picture, fall from 1.3433 (2024 high) should have completed at 1.2099 as a corrective move. Up trend from 1.3051 (2022 low) is still in progress but it's too early to say that it's resuming. Corrective pattern from 1.3433 could extend with one more down leg. But after all, eventual upside breakout is expected at a later stage.
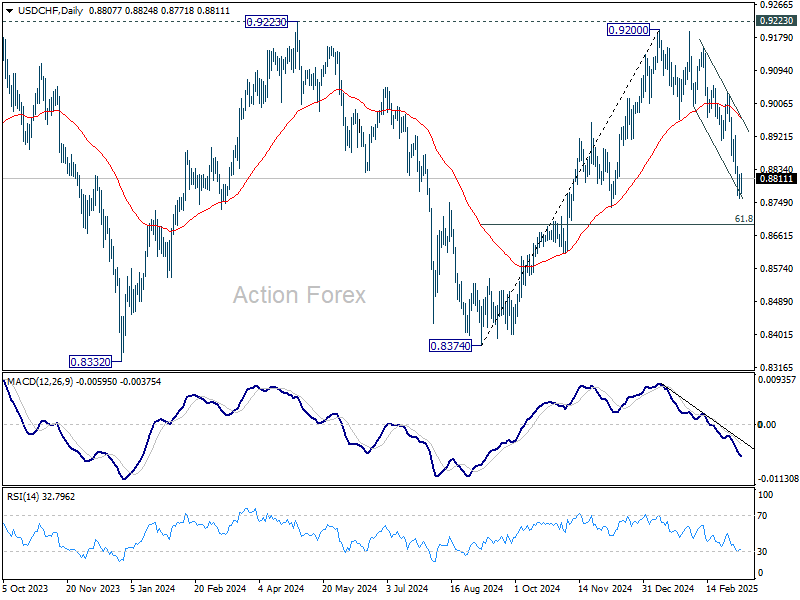
USD/CHF Mid-Day Outlook
Daily Pivots: (S1) 0.8770; (P) 0.8796; (R1) 0.8834; More…
Intraday bias in USD/CHF remains neutral for consolidations above 0.8757 temporary low. Upside should be limited by 0.8911 support turned resistance to bring another fall. On the downside, below 0.8757 will target 61.8% retracement of 0.8374 to 0.9200 at 0.8690. Sustained break there will pave the way back to 0.8374 support.
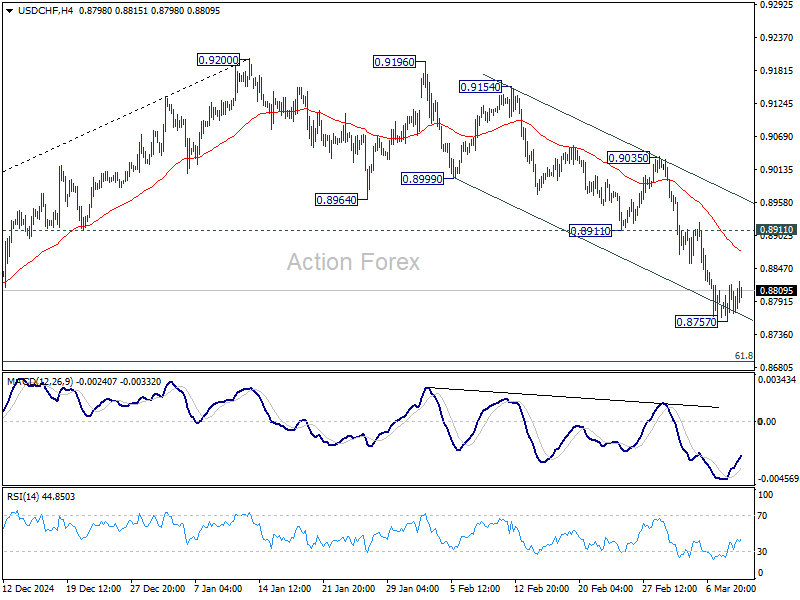
In the bigger picture, rejection by 0.9223 key resistance keep medium term outlook bearish. That is, larger fall from 1.0342 (2017 high) is not completed yet. Firm break of 0.8332 (2023 low) will confirm down trend resumption.
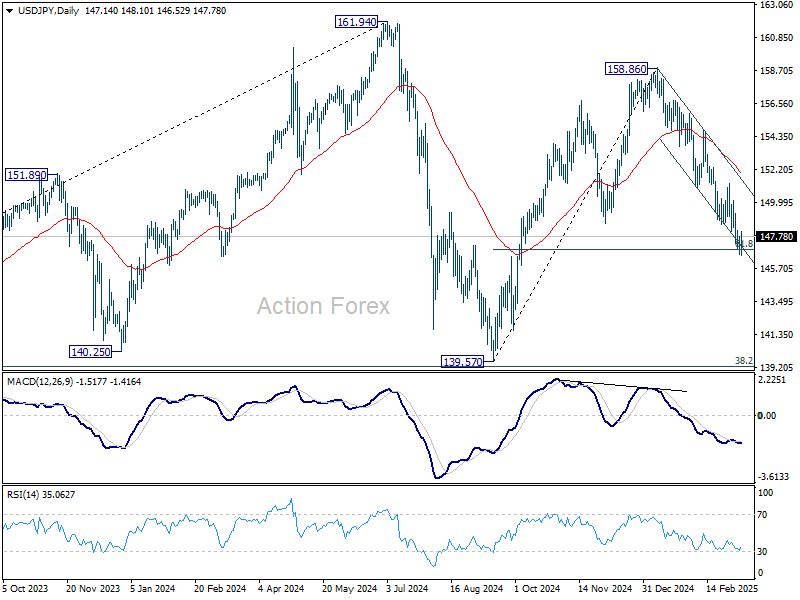
USD/JPY Mid-Day Outlook
Daily Pivots: (S1) 146.59; (P) 147.30; (R1) 147.97; More...
Intraday bias in USD/JPY is turned neutral with current recovery. Some consolidations would be seen above 146.52 temporary low first. But upside of recovery should be limited by 150.92 support turned resistance. On the downside, sustained trading below 61.8% retracement of 139.57 to 158.86 at 146.32 will pave the way to 139.57 support.
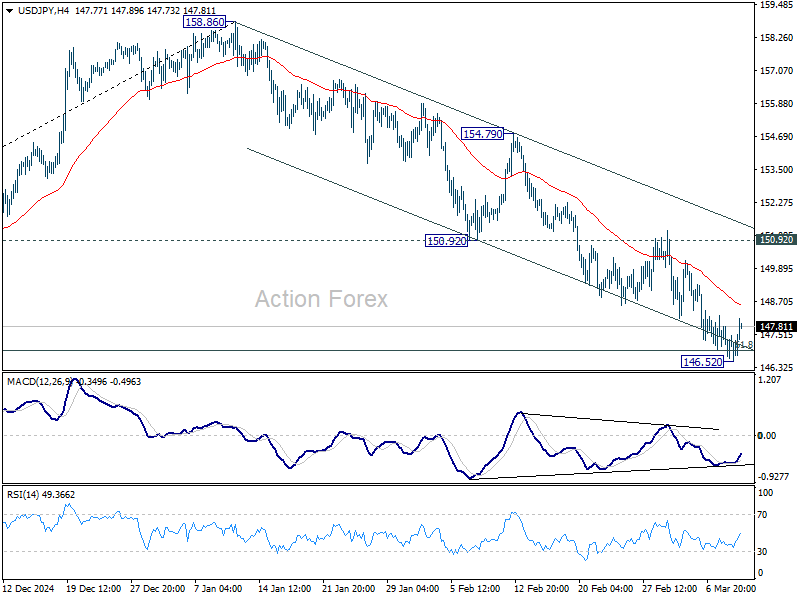
In the bigger picture, price actions from 161.94 are seen as a corrective pattern to rise from 102.58 (2021 low), with fall from 158.86 as the third leg. Strong support should be seen from 38.2% retracement of 102.58 to 161.94 at 139.26 to bring rebound. However, sustained break of 139.26 would open up deeper medium term decline to 61.8% retracement at 125.25.
US: Small Business Optimism Index fell for second consecutive month in February
The NFIB's Small Business Optimism Index fell 2.1 points to 100.7 in February, coming in slightly below market expectations.
Seven out of ten subcomponents deteriorated on the month. The largest declines came from expectations about an improvement in the economy (-10 points to 37%), the belief that now is a good time to expand (-5 points to 12%), and expectations regarding higher 'real' sales (-6 points to 14%).
The net share of businesses planning to increase employment fell 3 points to 15%. On the other hand, the share of firms with unfilled job openings rose 3 points to 38%. Quality of labor concerns rose one point in February, with 19% of business owners identifying this as their top business problem. In contrast to other surveys, inflation concerns fell 2 points to 16%.
The net share of firms currently increasing employee compensation held flat at 33%, while the net share 'planning' to do so over the next three months continued to trend lower falling 2 points to 18%. However, the share of businesses raising average selling prices surged 10 points to 32%, while the share of those 'planning' to raise average selling prices ahead rose 3 points to 29%. The uncertainty subindex also rose 4 points to 104 – the second highest reading on record.
Key Implications
Small business optimism continued to moderate in October, falling to a four-month low. This as elevated uncertainty weighed on the belief that 'now is a good time to expand' and took a toll on expectations about an improvement in sales and the economy. On a more positive note, the labor market indicators held up somewhat better. The fact that 'quality of labor' concerns remain top of mind, indicates that small businesses are still focused on growing their business as opposed to cutting expenses.
With trade conflicts reigniting in March, the level of uncertainty has the potential to rise even higher. This would weigh on overall small business confidence, and is likely to manifest itself in weaker investment and hiring decisions. Additionally, the rise of input costs from tariffs and counter-tariffs may impact pricing plans, with today's survey carrying some evidence of rising price pressures. The Fed will have to weigh these competing forces carefully as it considers adjusting monetary policy. For the time being, we expect the Fed to remain on hold, but come summer we could see chair Powell taking out the interest rate scissors.
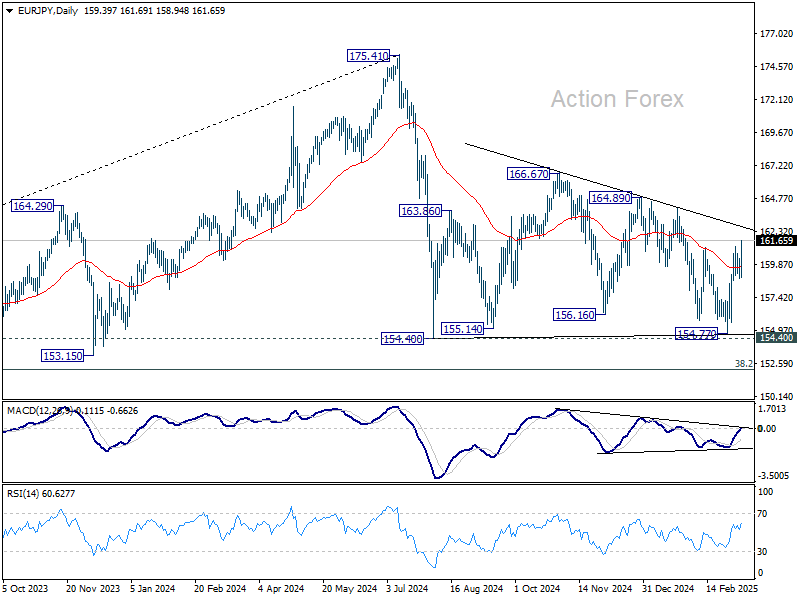
EUR/JPY Mid-Day Outlook
Daily Pivots: (S1) 158.86; (P) 159.62; (R1) 160.35; More...
EUR/JPY's rally resumed by breaking through 161.25 temporary top and intraday bias is back on the upside. Rise from 154.77 is seen as another rising leg in the consolidation pattern from 154.40. Next target is 164.89 resistance. For now, further rise is expected as long as 158.87 support holds, in case of retreat.
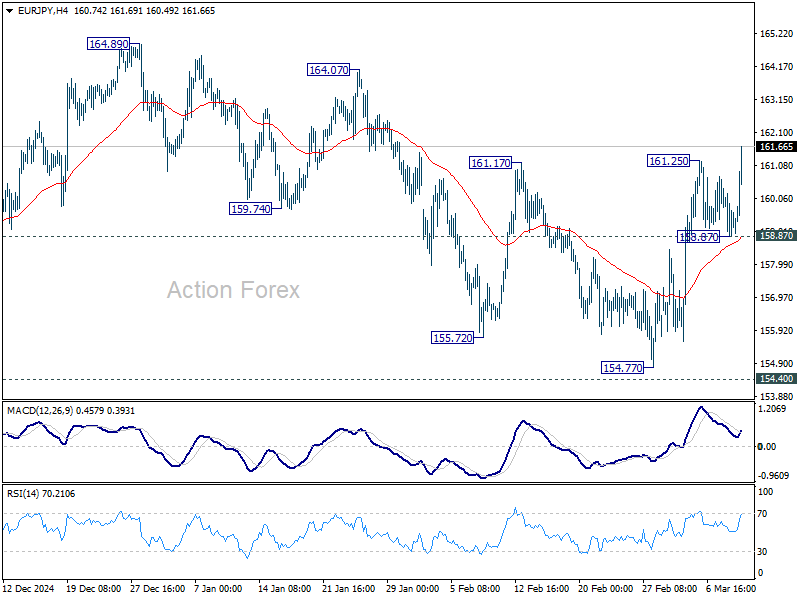
In the bigger picture, price actions from 175.41 are seen as correction to rally from 114.42 (2020 low). Strong support should be seen from 38.2% retracement of 114.42 to 175.41 at 152.11 to contain downside. However, sustained break of 152.11 will bring deeper fall even still as a correction.
Euro Rally Extends as German Greens Eye Defense Spending Deal This Week
Euro's rally continues after a brief pause, boosted by signs of political breakthrough in Germany over major defense and infrastructure spending. Consensus appears to be emerging around the large-scale funding deal, a game-changer toward bolstering Europe’s economic and defense resilience, especially amid ongoing geopolitical conflicts in Ukraine.
Germany’s Green party is reportedly prepared to reach an agreement as early as this week with prospective Chancellor Friedrich Merz of CDU/CSU. Greens co-leader Franziska Brantner indicated in a Bloomberg TV interview that negotiations could move quickly, citing the urgent need for Europe to "speed up" its defense capabilities given the "dire" situation in Ukraine. An influx of hundreds of billions of Euros in spending could act as a significant stimulus for the German economy, thereby supporting the broader Eurozone.
On the other hand, Dollar is generally weaker against European majors, reflecting a cautious mood. US futures are also sluggish, reversing earlier recovery and struggling to find direction in a narrow trading range. Many investors appear to be sidelined, waiting for tomorrow’s CPI release to guide the next market move.
Expectations point to core CPI remaining sticky, albeit with a modest decrease from 3.3% to 3.2%. The pace of disinflation has clearly lost momentum in recent months, suggesting that inflationary pressures are far from fully contained. Should the data confirm a slow decline in inflation, it would solidify Fed’s case to hold rates steady at the upcoming March 19 meeting.
Even so, market participants are increasingly betting that Fed will need to ease policy in Q2, as the economic impact of tariffs and weaker sentiment gradually translate into weaker hard data. The uncertainty surrounding trade policy, coupled with signs of slowing economic momentum, has kept Dollar on the back foot.
Looking at weekly performance, Euro remains the strongest currency so far. British Pound and Yen are also holding up well. On the other end of the spectrum, Canadian Dollar is the worst performer this week, followed by Australian and New Zealand Dollars, as risk sentiment remains weak and commodity-linked currencies struggle. Dollar and Yen are currently positioned in the middle of the pack.
In Europe, at the time of writing, FTSE is down -0.09%. DAX is up 0.21%. CAC is up 0.03%. UK 10-year yield is up 0.024 at 4.626. Germany 10-year yield is up 0.046 at 2.883. Earlier in Asia, Nikkei fell -0.64%. Hong Kong HSI fell -0.01%. China Shanghai SSE rose 0.41%. Singapore Strait Times fell -1.88%. Japan 10-year JGB yield fell -0.065 to 1.506.
ECB’s Rehn warns US tariffs could cut global output by 0.5% in both 2025 and 2026
In a speech today, Finnish ECB Governing Council member Olli Rehn highlighted the potential damage that US tariffs could inflict on global economic activity.
According to Bank of Finland estimates, import tariffs of 25% on US imports from the Eurozone and 20% on imports from China, along with reciprocal measures by those regions, would shave more than 0.5% off global output this year and next
Rehn stressed that this looming trade conflict would carry both deflationary and inflationary implications for Europe. "It's worth recalling that if growth were to slow down in the world economy and euro area economy compared to forecasts, that would weigh on inflation downwards," Rehn said.
Given this uncertainty, he noted that ECB will assess fresh economic data ahead of its April meeting before committing to additional rate cuts or a pause.
Australia Westpac consumer sentiment jumps to 95.9, soft landing achieved
Australian consumer sentiment saw a strong rebound in March, with Westpac Consumer Sentiment Index jumping 4.0% mom to 95.9, the highest level in three years and not far from neutral 100 mark.
Westpac attributed the improvement to slowing inflation and February’s RBA interest rate cut which have lifted confidence across households. positive views on job security suggest that "soft landing has been achieved". Nevertheless, "unsettling overseas news" continues to weigh on the broader economic outlook.
Looking ahead to RBA's upcoming meeting on March 31-April 1, Westpac expects the central bank to keep the cash rate unchanged. RBA was clear that the 25bps cut in February "did not mean further reductions could be expected at subsequent meetings."
Westpac added, "further slowing in inflation will give the RBA sufficient confidence to deliver more rate cuts this year with the next move coming at the May meeting".
Australia’s NAB business confidence slips back into negative as cost pressures persist
Australia’s NAB Business Confidence fell from 5 to -1 in February, erasing last month’s gain and returning to below-average levels. While business conditions improved slightly from 3 to 4, the decline in confidence suggests that businesses remain cautious despite RBA’s recent rate cut and positive Q4 GDP data.
NAB Chief Economist Alan Oster noted that the lift in sentiment seen in January was not sustained, signaling ongoing uncertainty in the business environment. Persistent cost pressures and subdued profitability appear to be key factors weighing on sentiment, keeping confidence below long-term norms.
Within business conditions, trading conditions ticked up from 7 to 8, and profitability conditions rose slightly from -2 to -1, though still remaining in negative territory. Employment conditions, however, weakened from 5 to 4.
Cost pressures remain a concern, with purchase cost growth accelerating from 1.1% to 1.5% in quarterly equivalent terms. On the positive side, labor cost growth eased from 1.7% to 1.5%, indicating that wage price pressures are gradually cooling. Meanwhile, final product price growth slowed from 0.8% to 0.5%, though retail price inflation held steady at 1.0%.
EUR/JPY Mid-Day Outlook
Daily Pivots: (S1) 158.86; (P) 159.62; (R1) 160.35; More...
EUR/JPY's rally resumed by breaking through 161.25 temporary top and intraday bias is back on the upside. Rise from 154.77 is seen as another rising leg in the consolidation pattern from 154.40. Next target is 164.89 resistance. For now, further rise is expected as long as 158.87 support holds, in case of retreat.
In the bigger picture, price actions from 175.41 are seen as correction to rally from 114.42 (2020 low). Strong support should be seen from 38.2% retracement of 114.42 to 175.41 at 152.11 to contain downside. However, sustained break of 152.11 will bring deeper fall even still as a correction.
ECB’s Rehn warns US tariffs could cut global output by 0.5% in both 2025 and 2026
In a speech today, Finnish ECB Governing Council member Olli Rehn highlighted the potential damage that US tariffs could inflict on global economic activity.
According to Bank of Finland estimates, import tariffs of 25% on US imports from the Eurozone and 20% on imports from China, along with reciprocal measures by those regions, would shave more than 0.5% off global output this year and next
Rehn stressed that this looming trade conflict would carry both deflationary and inflationary implications for Europe. "It's worth recalling that if growth were to slow down in the world economy and euro area economy compared to forecasts, that would weigh on inflation downwards," Rehn said.
Given this uncertainty, he noted that ECB will assess fresh economic data ahead of its April meeting before committing to additional rate cuts or a pause.
Gold Remains in Consolidation Amid Ongoing Market Uncertainty
On Tuesday, Gold prices hovered near 2,900 USD per troy ounce, holding steady as the US dollar weakened and demand for safe-haven assets rose. Concerns about the US economic outlook and escalating trade tensions continue to support Gold’s consolidation.
Key market drivers for Gold
Fears of an economic downturn intensified after President Donald Trump referred to the current situation as a "period of transition" in an interview with Fox News, implying that current policies may lead to a recession.
Meanwhile, trade tensions remain elevated. The US had recently delayed imposing a 25% tariff on select Canadian and Mexican goods for a month while Canada maintained its retaliatory measures. China imposed additional tariffs on some American agricultural products in response to the US tariff hikes.
Federal Reserve Chair Jerome Powell acknowledged increasing economic uncertainty but refrained from signalling an imminent interest rate cut.
This week, US inflation data will be in focus, as it may shape the Fed’s future policy outlook. The next Federal Reserve meeting is scheduled for 19 March.
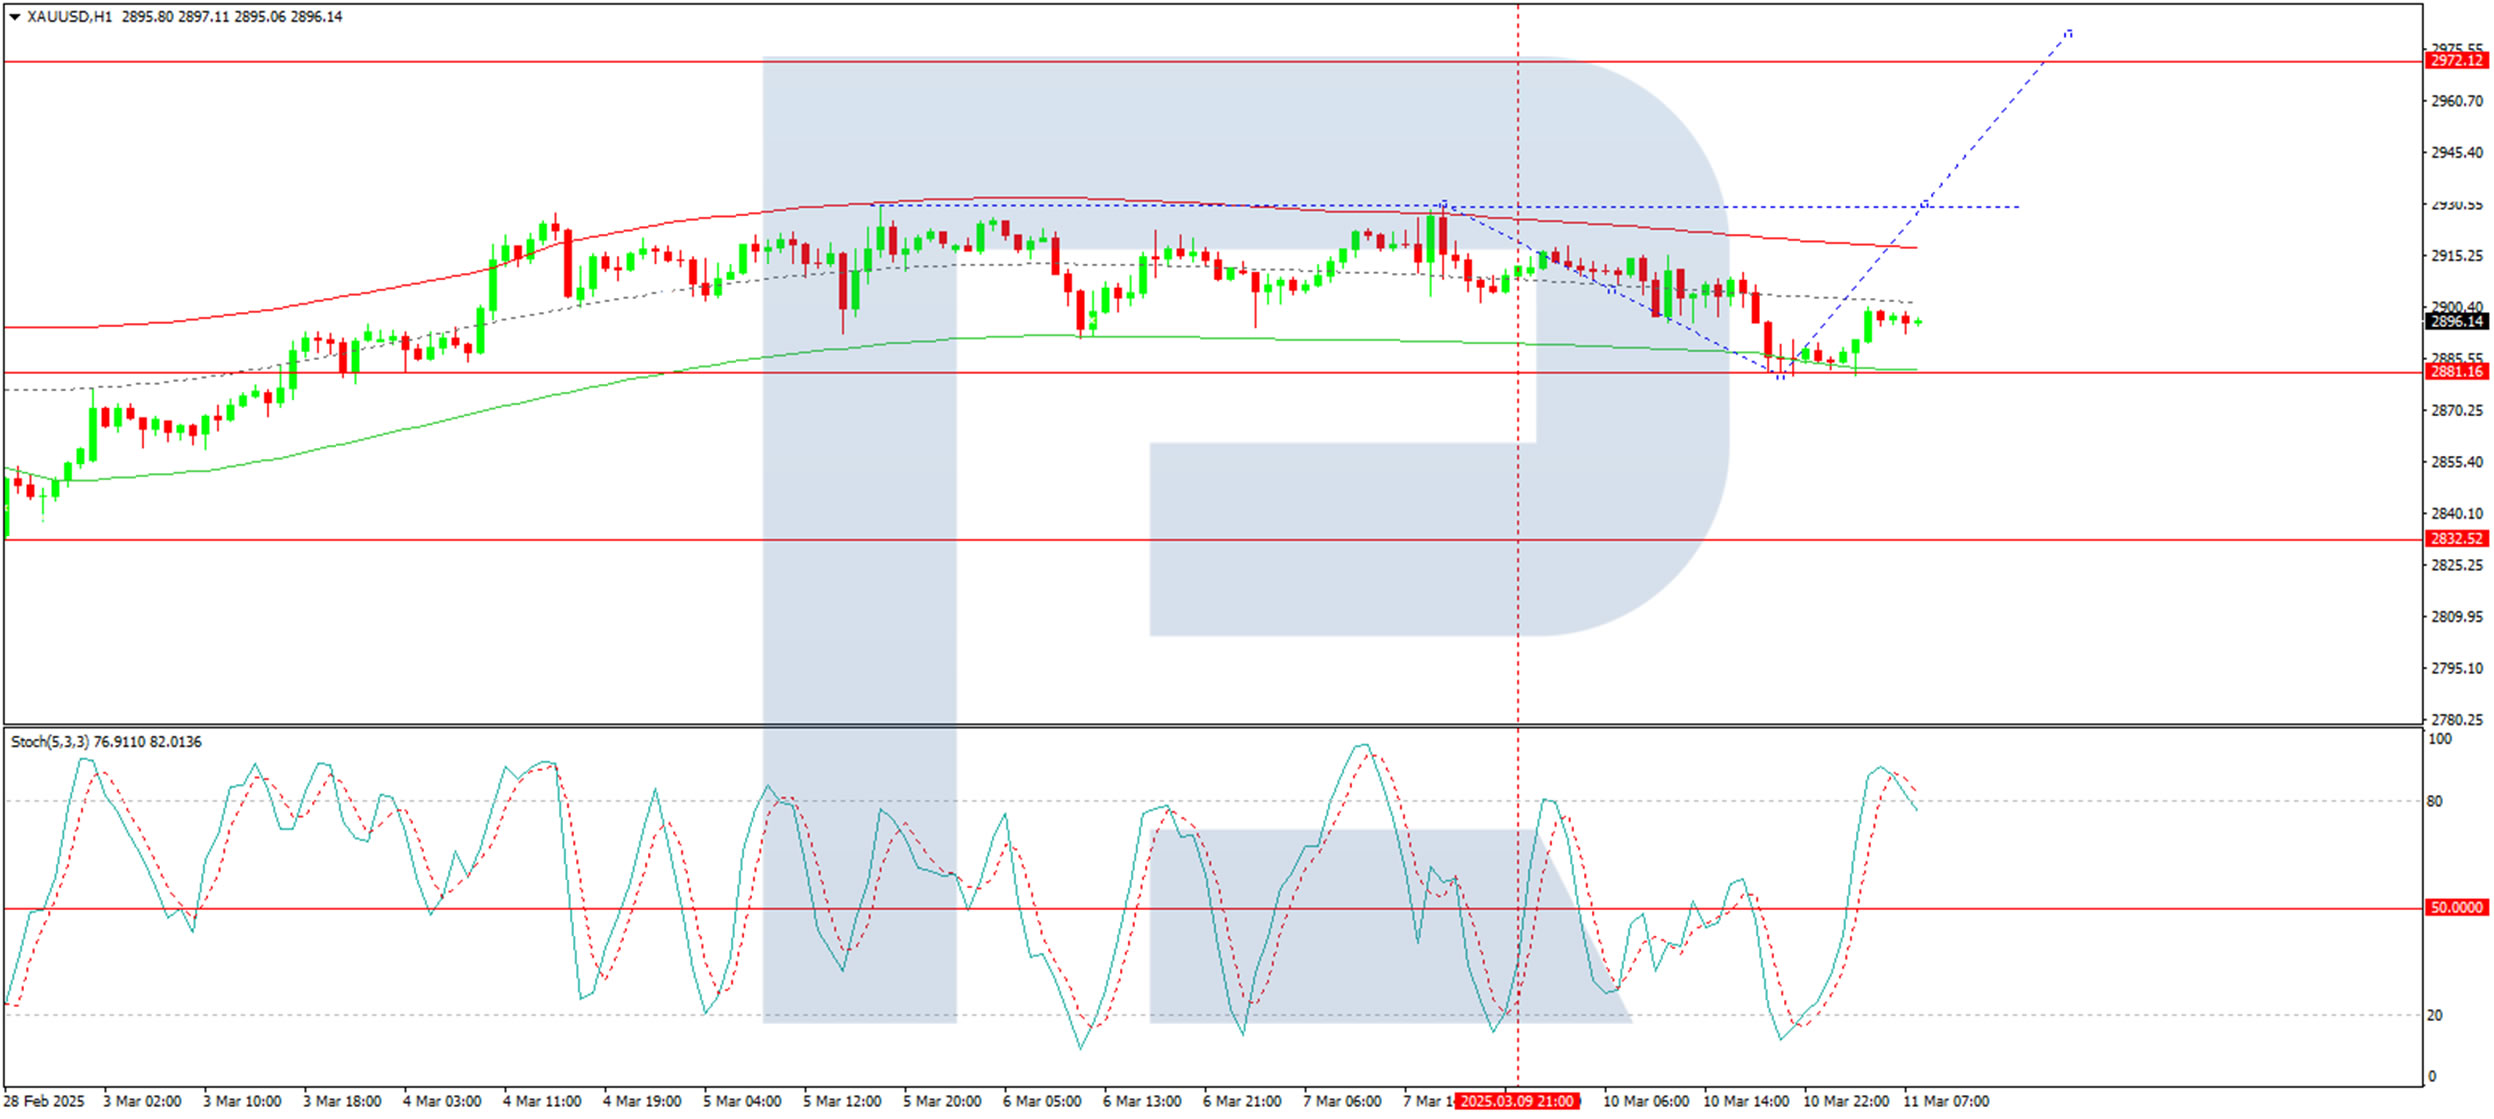
Technical analysis of XAU/USD
On the H4 chart, Gold recently formed a growth wave to 2,931 USD, followed by a correction to 2,880 USD. An upward move towards 2,906 USD is forming a consolidation range around this level. A breakout to the upside could trigger a further rise towards 2,980 USD, the local target. After reaching this level, a correction back to 2,900 USD is likely. If the price moves downward from the consolidation range, a correction to 2,860 USD is possible. This scenario is supported by the MACD indicator, with its signal line positioned above zero and pointing sharply upward.
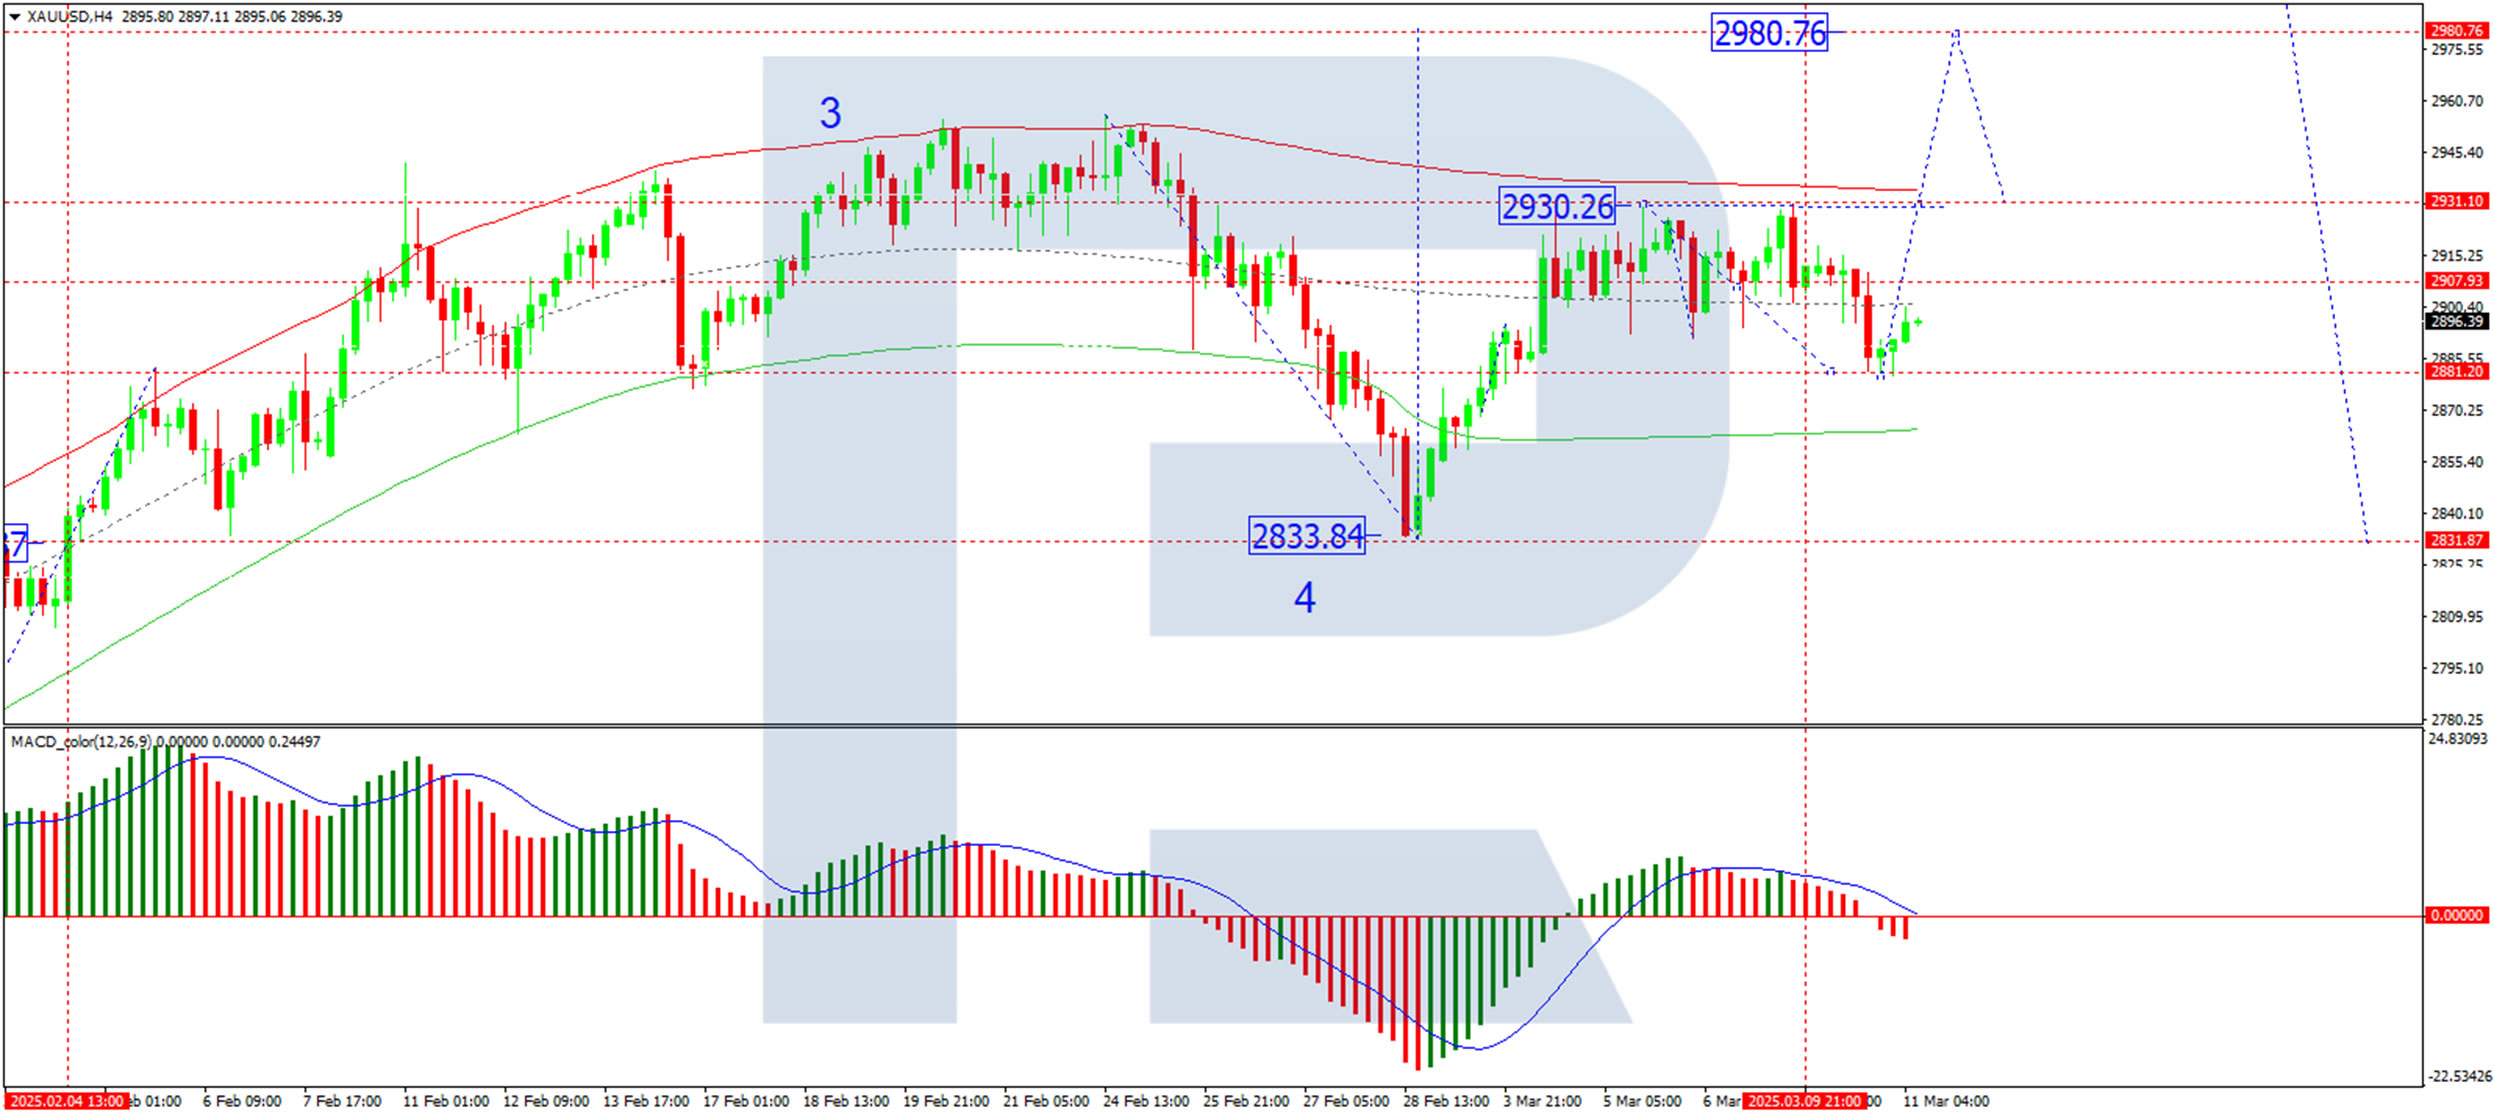
On the H1 chart, Gold completed a correction wave to 2,880 USD, and the market is now forming a new growth wave towards 2,906 USD, which is expected to be reached today. A subsequent potential pullback to 2,891 USD may occur, forming a consolidation range around this level. If Gold breaks downward from this range, a correction to 2,860 USD is possible before a renewed upward move. However, an upward breakout would open the path towards 2,980 USD. The Stochastic oscillator confirms this scenario, with its signal line above 80 and pointing firmly upward.
Conclusion
Gold remains in consolidation, balancing between a weakening US dollar and ongoing economic uncertainties. Technical indicators suggest a likely upward move towards 2,980 USD, though short-term corrections to 2,900 USD or 2,860 USD could occur before further gains. Market sentiment largely depends on upcoming US inflation data and its potential impact on Federal Reserve policy expectations.