Sample Category Title
AUD/USD Trying To Bounce
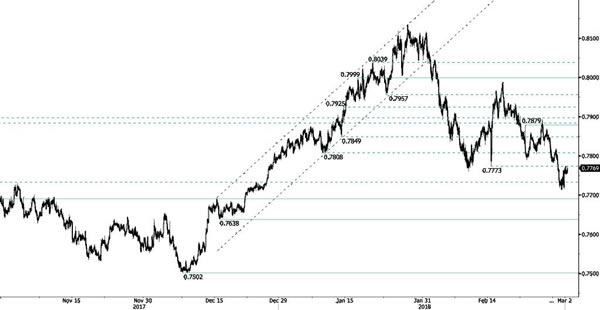
AUD/USD slightly increased back at the 0.777 range and currently trades sideways. The pair approaches hourly support at 0.7690 (25/10/2018 low) while hourly resistance at 0.7879 (21/02/2018 high) is distanced. The short-term technical structure suggests continued downward moves.
In the long-term, the upward trend slows down after failing to reach key resistance at 0.8164 (14/05/2015 low). Key support stands at 0.6009 (31/10/2008 low). A break of the key resistance at 0.8164 (14/05/2015 high) is needed to invalidate our long-term bearish view.
USD/CAD Approaching Hourly Resistance At 1.2917
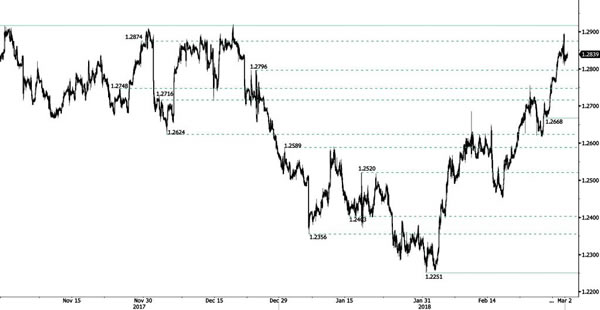
USD/CAD continues its rise and increases back after a slight decrease at 1.2822. The pair broke hourly resistance at 1.2874 (29/11/2017 high) and approaches new hourly resistance at 1.2917 (27/10/2018 high). Hourly support at 1.2668 (26/02/2018 low) is distanced. The technical structure indicates that continued rise is expected in the short-term.
In the longer term, the pair is trading between resistance point at 1.3805 (05/05/2017 high) and support at 1.2128 (18/06/2015 low). Strong resistance is given at 1.4690 (22/01/2016 high). The pair is likely to head lower. The pairs is trading above its 200 DMA.
USD/CHF Bearish Breakout
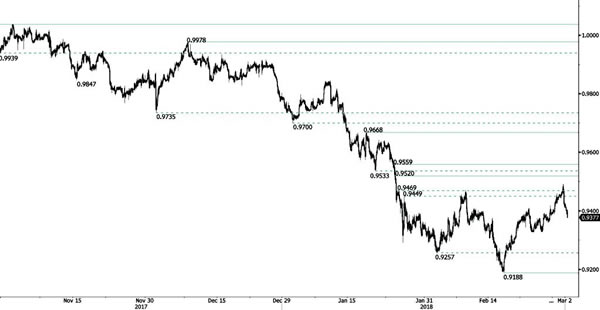
USD/CHF is turning negative after breaking hourly resistance at 0.9469 (24/01/2018 high) and currently trades in the 0.9350 range. Heading further down along the 0.93 range. Hourly support and resistance are now given at 0.9188 (16/02/2018 low) and 0.9520 (24/01/2018 high). The technical structure suggests short-term decrease.
In the long-term, the pair is still trading in range since 2011 despite some turmoil when the SNB unpegged the CHF. Key support lies at 0.9072 (07/05/2015 low) while resistance at 1.0344 (15/12/2016 high) is distanced. The technical structure favours a long term bullish bias since the unpeg in January 2015.
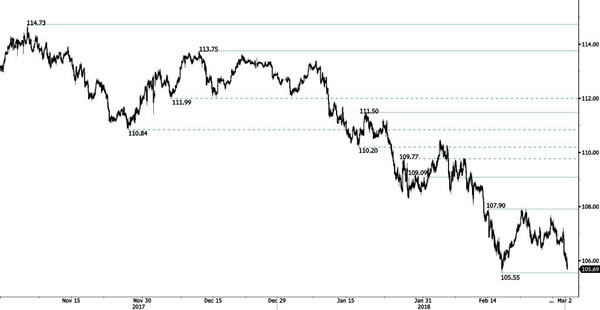
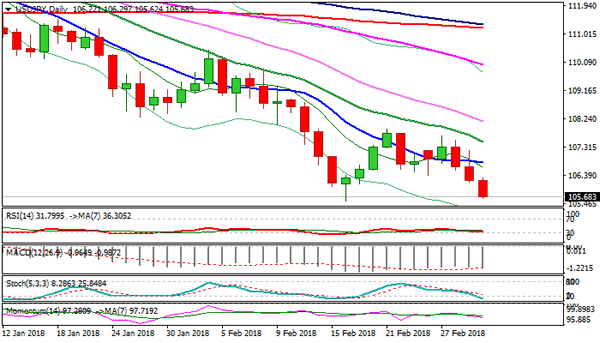
USD/JPY Testing Support At 105.55
USD/JPY decreases and approaches hourly support at 105.55 (16/02/2018 low). USD/JPY downward pattern is maintained. Hourly support and resistance are given at 105.55 (16/02/2018 low) and 107.90 (14/02/2018 high). Further support is given at 104.97 (11/10/2016 low). The short-term technical structure suggests further decline.
We favor a long-term bearish bias. Support at 105.55 (03/05/2016 low) is almost reached. A gradual rise toward the major resistance at 125.86 (05/06/2015 high) seems unlikely. Expected to decline further support at 101.20 (09/11/2016 low).
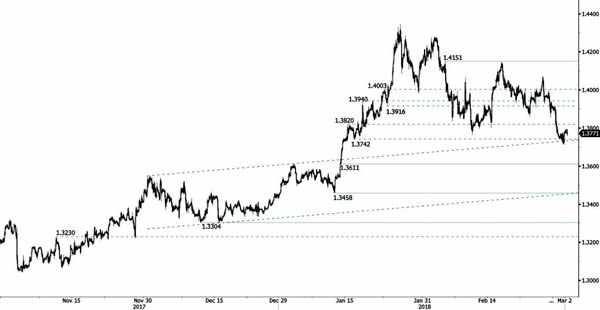
GBP/USD Trying To Recover
GBP/USD trades below 1.38 and broke hourly support at 1.3742 (16/01/2018). The upward trend of November 2017 remains intact. Hourly support and resistance are given at 1.3611 (12/01/2018 low) and 1.4151 (05/02/2018 high). The technical structure suggests further shortterm upside moves.
The long-term technical pattern is reversing. The Brexit vote had paved the way for further decline but the pair is moving to 2016 highs. Long-term support and resistance are given at 1.1841 (07/10/2017 low) and 1.5018 (24/06/2016 high).
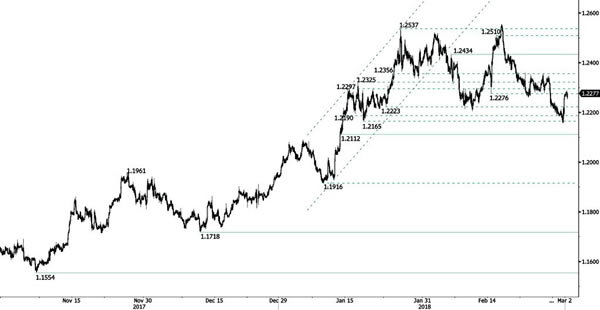
EUR/USD Bouncing Back
EUR/USD is recovering from 1.2155 low, approaching hourly resistance at 1.2434 (06/02/2018 high). Hourly support at 1.2165 (17/01/2018) is now broken, new hourly support is given at 1.2112 (12/01/2018 low). The technical structure suggests further upside moves.
In the longer term, the momentum is turning largely positive. We favor a continued bullish bias. Key resistance is holding at 1.2886 (15/10/2014 high) while strong support lies at 1.1554 (08/11/2017 low).
German Worries – Can Berlusconi Win?
Binary risk in Germany
This weekend is event risk heavy with German SPD vote and Italian general elections. The market, judging from short-term vol, has shrugged of any significant impact. Yet in the back of everyone mind is the “what if”. The last few year's investors have been plague by “white swans” and this weekend is not different. The SPD is currently holding a binding postal ballot of its 463,723 members on a coalition deal with Mrs Merkel. Currently the SPD and CDU (Merkel) are expected to form a central market, EU friendly coalition. Politically Merkel has been allow a final chance as her own party voted in favor of a grand coalition deal with the Social Democrats (SPD). But if Sunday SPD votes to reject, German politics become a mess with no center coalition and possibly no Merkel. If SPD members vote "no" the most likely, result will be new elections or possibly a minority government. A snap election open the door for further gains for the anti-immigrations AfD party. The current low polling suggest a tilt toward “yes” vote and grand coalitions. The binary aspect of this event make it more worrisome in our mind.
Italy voting distribution can lead to market stability
Overall, we don't see a major immediate effect from the Italian elections. The reason is divided vote. We see the probability that all of a sudden a single bloc gets a majority is unlikely (less than the binary result in Brexit or US election) We are in line with market and expect a hung parliament, resulting in an extended period of coalition negotiations. The primary reason is not the end of Europe populist insurgency or satisfaction with the status-quo but division of voting blocks. Most polls indicate a proportional three-party/coalition race (Democratic Party, Forza Italia and Five Star), making wining a majority highly challenging. The most radical result were the Five Star-led (anti-establishment) government is only a tail risk. In this scenario, we do not expect any major policy changes (due to a lack of political or fiscal capacity or due to a lack of appetite) and lower anti-EU rhetoric that would spook the markets. Due to official blackout the most recent polls suggest M5S 26%, Center-right bloc 37%, PD 25% with 30-35% of vote are undecided. However, Italian voter polls have tended historically to be misleading. We believe there is a realistic probably that Berlusconi's center right block reaches the 40% threshold. Yet, a Berlusconi upset will have limited real impact being dismissed as Italian politics a surreal.
A realistic tail risk this weekend is a “no” vote in Germans and Berlusconi party win in Italy. Walking in to the Monday paper yelling “Chaos in European politics”, significantly negative result for European assets.
South Korean Trade Balance approaching average capacity
South Korea's decreasing export growth slowed in February to 4% (average: 8.70%), its weakest rate since November 2016 due to decreasing overseas demand and New year holidays that reduced the amount of working days and shipment for the automotive industry. As strong global demand remains, we are expecting South Korean March exports data to approach the 6% range but strong tariff headwinds on steel from second commercial partner (US) and estimated at 53% will be impacting South Korean export industry growth in the coming periods. South Korea remains US third steel supplier with a total amount of 3.6 million tons of steel, after Canada and Brazil.
South Korean February Trade Balance is given at USD 3.31 billion (average: USD 2.88 billion) and will be heading higher, supported by higher exports, stable inflation (4Q: 1.50%), improving private consumption (e.g. expansionary fiscal stimulus) and Bank of Korea's cautious normalization measures (Repo Rate maintained at 1.50% since November 2017).
Technical Outlook: WTI OIL – Bears Look For Fresh Signals On Break Below Daily Cloud
WTI oil holds in red for the fourth straight day and moved lower on Friday after bouncing from new two-week low at $60.17 on Thursday.
Recovery attempts proved to be short-lived as oil price remains under pressure on continuing concerns about US oil production, strong build of US crude stocks and fresh fears about US protectionist policies which could result in trade war after President Trump announced impose of tariffs on imported metals.
Daily techs show MA's (10/20/30/55) in bearish setup, with momentum studies turning south, which supports for further easing.
Fresh weakness probes again through daily cloud base (60.72) for renewed attempts below cracked pivotal support at $60.49 (Fibo 61.8% of $58.19/$64.22 bull-leg), close below which will be strong bearish signal.
In addition, WTI contract is on track for bearish weekly close and forming weekly bearish engulfing, which would add on existing negative outlook.
Firm break below daily cloud / Fibo support would look for retest of Thursday's low at $60.17 and attack at psychological $60.00 support.
Falling 20SMA ($61.61) is expected to cap upticks and keep bears intact.
Res: 61.39, 61.61, 61.98, 62.18
Sup: 60.49, 60.17, 60.00, 59.61
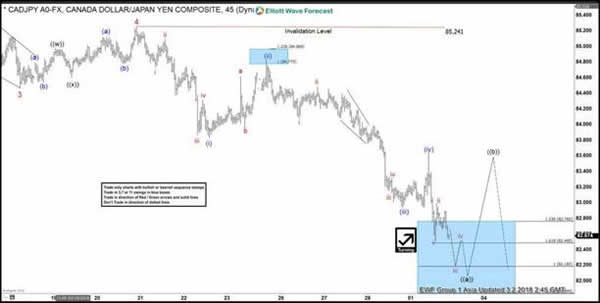
CAD/JPY 4H Chart: Possible Retracement
After reaching the weekly pivot point at 91.62, the Canadian Dollar began to decline against the Japanese Yen.
The currency exchange rate had breached the lower boundary of a dominant channel where the monthly S3 is located and is slowly moving downwards to test the weekly support at 80.98.
Regarding the near future, the CAD/JPY pair is likely to continue trading in the junior pattern. However, a reverse north could occur at the aforementioned weekly support.
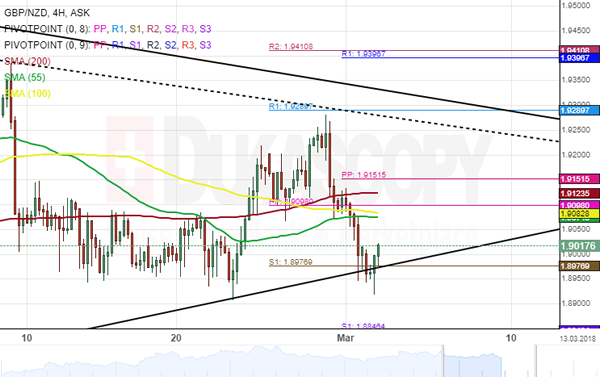
GBP/NZD 4H Chart: Breached Large-Scale Triangle
The Pound Sterling has been guided by a three-month descending channel against the New Zealand Dollar.
The combination of the 55-, 100-, and 200-hour SMAs was restricting the currency pair from making any upward movement. At the time of the analysis, the GBP/NZD pair had breached the monthly S1 at 1.8976.
As for near future, the exchange rate is likely to continue its bearish movement until it finds the next support set by the weekly S1 at 1.8846. In addition, technical indicators confirmed that bears could grow stronger during the following trading sessions.