Sample Category Title
Fed’s Door Ajar For Four Fed Hikes
U.S interest rates and the dollar have moved higher after the new Fed Chair, Jerome Powell, noted in his first public outing on the 'hill' that his outlook for the U.S economy has moved up since the December FOMC meeting.
Powell's 'hawkish' comments yesterday have left the door ajar for a possible four-fed hikes for this year.
Note: Futures contracts are pricing in a +33% probability it would move at least four times, in +25 bps steps.
Global equities remain under pressure as investors shift their focus to this morning's U.S GDP data at 08:30 am EST.
1. Stocks see 'red'
In Japan, the Nikkei share average fell overnight, snapping a three-day winning streak; pressured by losses stateside yesterday and a larger-than-expected fall in Japanese industrial output. The BoJ's decision to trim purchases of long JGB's is also souring sentiment by boosting the yen (¥107). The Nikkei ended down -1.4%, while the broader Topix fell -1.2%.
Down-under, the Aussie ASX 200 declined -0.7%, while in S. Korea, the Kospi fell -1.2%.
In Hong Kong, stocks fell to a two-week low and have posted their biggest monthly fall in 24-months. The Hang Seng index fell -1.4%, while the China Enterprises Index lost -2.1%.
In China, stock indices extended their losses, with the benchmark Shanghai index recording its worst month since early 2016, as weak factory data rekindled worries about the country's economic health amid fears of faster rate hikes in the U.S. For the month, the Shanghai Composite Index dropped -6.4%, while the CSI300 lost -5.9%.
In Europe, regional indices trade lower across the board, mirroring Asia and U.S losses. The U.K's FTSE 100 Index and Germany's DAX have fallen -0.3%.
U.S stocks are set to open a tad higher (+0.2%).
Indices: Stoxx600 -0.1% at 381.8, FTSE -0.2% at 7266, DAX -0.2% at 12472, CAC-40 -0.2% at 5334, IBEX-35 -0.5% at 9855, FTSE MIB +0.1% at 22755, SMI -0.4% at 8952, S&P 500 Futures +0.2%.
2. Oil struggles on China demand concerns, gold unchanged
Oil prices are struggling to stay in positive territory after Asia data overnight showed that industrial activity has softened.
Three out of the world's top consumers of crude – China, India and Japan – reported a slowdown in monthly factory activity.
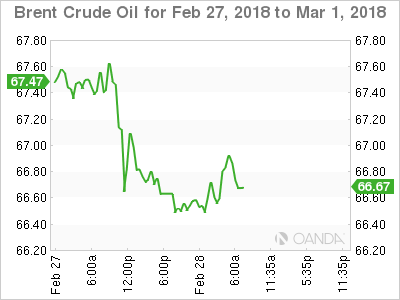
May Brent crude futures are up +5c at +$66.57 a barrel, while the front-month April contract (which expires today) is also up +5c at +$66.68 a barrel. U.S West Texas Intermediate crude is down -5c at +$62.96 a barrel.
In the U.S, the world's biggest oil consumer, rising crude stockpiles and a drop in refinery runs continues to cap crude prices. Expect dealers to take their cues from today's U.S EIA inventory report (10:30 am EST).
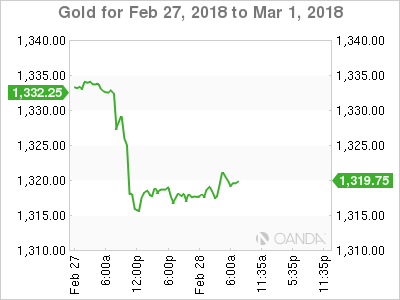
Ahead of the U.S open, gold prices trade flat after a more than -1% drop yesterday on a 'hawkish' Fed Chair Powell. Spot gold is at +$1,317.90 an ounce. It closed -1.1% lower on Tuesday after hitting the lowest since Feb. 9 at +$1,313.26.
3. Sovereign yields edge higher
G7 central bank yields are now moving in the same direction, but they are doing so at very different speeds – Fed, BoE, BoC, ECB and BoJ.
According to the latest positioning data from the Chicago futures exchanges, speculators are making their biggest ever short-term bet on higher U.S interest rates. The amount of speculative 'net-short' positions in Eurodollar futures rose to record -3.65m contracts in the week ended Feb. 20.
Note: Money markets are pricing in a rate hike at the conclusion of the Fed's March 20-21 policy meeting – this will be the sixth hike in the current cycle, with another two/three this year factored into market pricing.
After Fed Chair Powell's testimony yesterday, U.S yields continue to grind their way towards their four-year highs. The yield on U.S 10-years has backed up +1 bps to +2.90%. In Germany, the 10-year Bund yield dipped -1 bps to +0.68%. In the U.K, the 10-year Gilt yield fell -1 bps to +1.561%, while in Japan, 10-year JGB yield rallied +1 bps to +0.05%.
4. Loonie in trouble as the Pound waits its fate
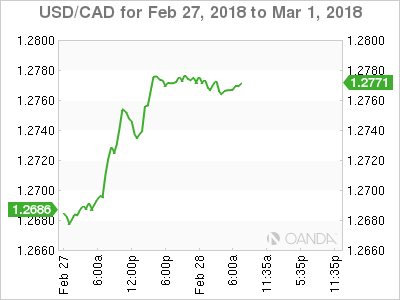
The CAD fell to a new three-month low overnight – C$1.2777 – amid a strengthening USD and the release of Canada's fiscal budget yesterday that signaled several more years of deficits. The loonie weakened for the second-straight day as investors boosted the greenback amid growing signs the Fed could hike rates as many as four times this year.
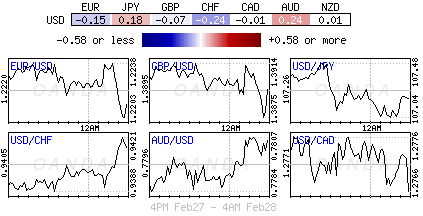
Elsewhere, the USD is holding onto gains in the aftermath of Fed Powell's inaugural Humphrey Hawkins testimony. Overall the market take of the testimony was interpreted as hawkish. The EUR/USD (€1.2210) is a tad lower by -0.1% as Euro inflation data this morning continued to highlight that regional CPI had yet to show more convincing signs of a sustained upward adjustment.
GBP/USD is holding below the psychological £1.39 handle as markets waits for the E.U publication of its first draft of Brexit treaty. The draft is expected to ignore some of the U.K most important demands – PM's May's proposals for how the transitional phase would work. The draft may say that Northern Ireland might have to follow E.U single market rules to avoid a hard border.
Note: Northern Ireland's DUP party (part of May's coalition) has already stated that if the Irish Sea became a trade border it would withdraw its support for the U.K government.
5. Switzerland's KOF economic barometer climbs
Data this morning showed that the Swiss KOF Economic Barometer climbed from 107.6 in January (revised up from 106.9) by +0.4 pt. to a level of 108.0.
Digging deeper, the strongest positive contributions to this morning's print came from the construction sector, followed by the hospitality industry and the indicators relating to domestic private consumption.
The indicators from the financial sector and the exporting industry have remained somewhat unchanged, while an overall slight negative signal came from manufacturing.
The net result, the data suggest that the Swiss economy is expected to grow at rates above average.
EURJPY Strongly Bearish, Looking Oversold In Short-Term
EURJPY has been plunging since February 21 and recorded the fifth consecutive negative trading day on Wednesday. During today’s European session the pair created a new 5-month low of 130.73 and holds below the 131.15 key level, which was acting as a strong obstacle for the bulls. This penetration suggests an aggressive bearish roller coaster.
From the technical point of view, in the 4-hour chart, the MACD oscillator endorses the negative structure and is falling below the trigger and zero lines. Moreover, the RSI indicator dropped sharply following the bounce off the 50 level and is approaching the 30 area. The 20 and 40 simple moving averages in the near-term are following the downward movement of the price action.
In case of further losses, the pair could hit the 129.30 support barrier taken from the low on September 5. The bearish correction of the ascending move in the medium-term is still in progress.
On the flip side, a jump above the 131.15 resistance level it could take the price action above the 20 and 40 SMAs at 131.40 and 131.80 respectively towards the 132.20 barrier, which holds near the 23.6% Fibonacci retracement level of the downleg from 137.50 to 130.83.
Technical Outlook: WTI OIL – Daily Cloud Top Contained Pullback For Now But Deeper Dips Not Ruled Out, EIA...
WTI oil hit new low at $62.82 on Wednesday, in extension of previous day’s strong fall, when oil price accelerated lower on downbeat supply data.
API report, released late Tuesday showed build in crude inventories of 0.93 million barrels last week, which put oil price under increased pressure despite the release was well below forecasted build of 2.7 million barrels.
Pullback from new three-week high at $64.22 was signaled by reversal of daily slow stochastic from overbought territory, which also formed bearish divergence, reinforcing negative signal.
Pullback may extend further as indicator shows a plenty of room at the downside and forecast for EIA crude stocks report, due later today, shows expectations for 2.4 million barrels build of crude inventories, compared to 1.61 million barrels draw previous week, which could further deflate oil price.
Daily techs show strong momentum, with near-term action being underpinned by 10/20SMA bull-cross and top of rising daily cloud, but contradicted by overbought conditions.
Brief recovery today was so far capped by 30SMA, keeping the downside at risk, with stronger downside action requiring penetration of daily cloud (cloud top lies at $62.48), to expose next pivotal support at $61.92 (Fibo 38.2% of $58.19/$64.22 rally, reinforced by rising 55SMA), with break here to generate strong bearish signal.
Conversely, stronger recovery above 30SMA and repeated close above daily cloud would sideline immediate downside risk, however, return above $63.36 (cracked Fibo 61.8% of $66.64/$58.06 fall) is needed to neutralize and generate stronger bullish signal.
Res: 63.09, 63.36, 64.07, 64.22
Sup: 62.48, 62.35, 62.13, 61.92
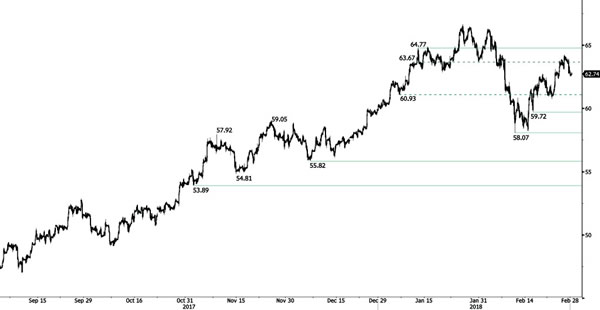
CRUDE OIL Slight Weakness
Crude oil upward trend is interrupted, currently trading below 63. Crude oil is maintained between hourly support and resistance given at 59.72 (15/02/2018 low) and 64.77 (11/02/2018 high). The technical structure suggests shortterm downward moves.
In the long-term, crude oil has recovered after its sharp decline last year. However, we consider that further weakness is very likely. For the time being, the pair lies in an upside trend since June 2017. Support lies at 42.20 (16/11/2016) while resistance is located at 77.83 (20/11/2014). Crude oil is trading largely above its 200 DMA.
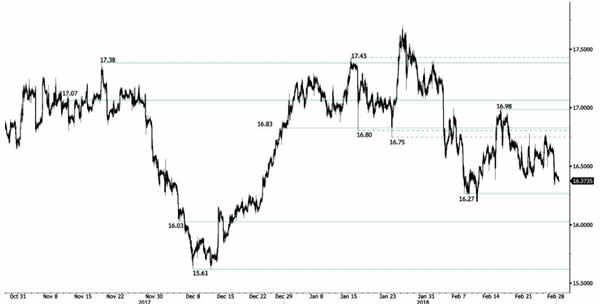
SILVER Declining Further
Silver is trading lower following a hike at 16.77 (26/02/2018), suggesting further short-term decline. Hourly support and resistance are given at 16.27 (07/02/2018 low) and 16.98 (15/02/2018).
In the long-term, the trend remains negative/ sideways. Further downside is very likely. The pair is trading below its 200 DMA. Resistance is located at 21.58 (10/07/2014 high). Strong support can be found at 11.75 (20/04/2009).
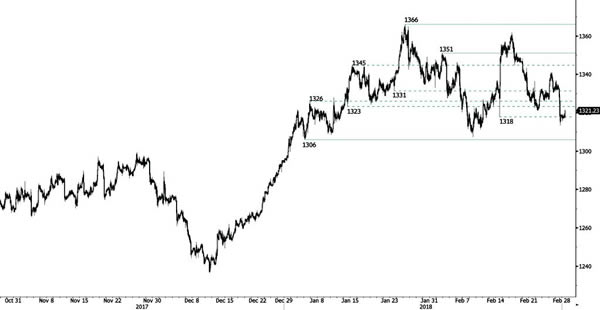
GOLD Weakening
Gold is trading at the 1320 range following recent selling pressures, declining from 1341 high (26/02/2018) and breaking hourly support at 1318 (14/02/2018 low). New hourly support is now at 1306 (04/01/2018 low) while hourly resistance remains at 1351 (01/02/2018 high). The technical structure suggests further downward moves.
In the long-term, the technical structure suggests that there is a growing upside momentum. A break of 1'392 (17/03/2014) is required to confirm it. A major support can be found at 1'045 (05/02/2010 low).
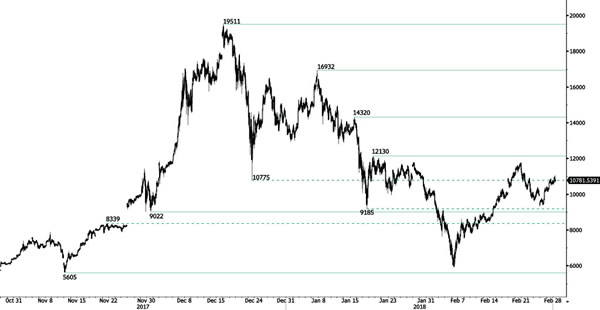
BITCOIN Edging Higher
Bitcoin recovers from recent decline below 9390, heading higher along 11000. Hourly support and resistance remain at 9022 (30/11/2018 low) and 12130 (18/01/2018 high).
In the long-term, the digital currency has had an exponential growth but also presented important downturns. There is decent likelihood that the currency could stabilize between 7'000 - 12'000 in 2018. Bitcoin is trading above its 200 DMA (6'500 range).
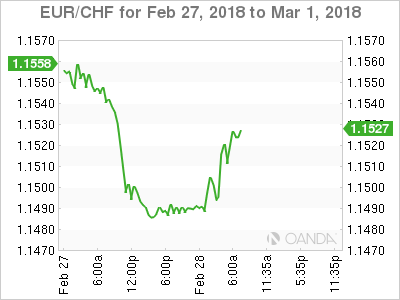
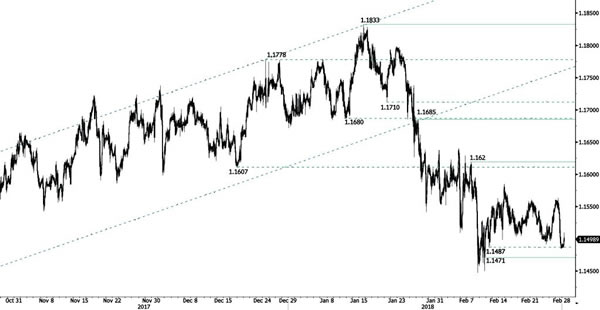
EUR/CHF Recovery Ggains Strength
EUR/CHF is attempting a recovery phase at the 1.155 range after breaking hourly support given at 1.1487 (12/02/2018). New hourly support is given at 1.1471 (09/02/2018 low) while hourly resistance remains at 1.162 (07/02/2018 high). The technical structure suggests short-term upside moves.
In the longer term, the technical structure has reversed. Strong resistance is given at 1.20 (level before the unpeg). Yet, the ECB's slowing QE program is likely to cause buying pressures on the euro, which should weigh in favour of the EUR/CHF. Support can be found at 1.0234 (20/04/2015 low).
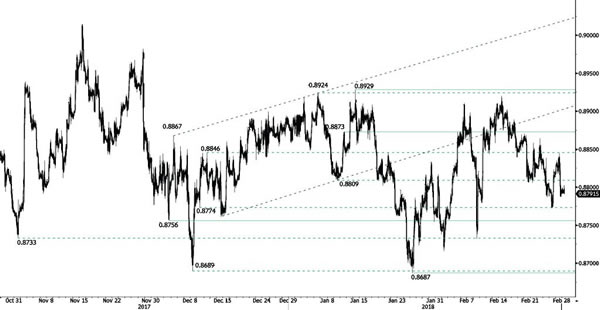
EUR/GBP Trying To Bounce Back
EUR/GBP slipped below the 0.88 range and is recovering back. Heading for the 0.882 range. Hourly support and resistance are given at 0.8756 (04/12/2017 low) and 0.8873 (10/01/2018 high). The technical structure suggests shortterm upside moves.
In the long-term, the pair has largely recovered from 2015 lows. The technical structure suggests further upside pressure. Strong resistance can be found at 0.9500 (psychological level) while support remains at 0.8304 (05/12/2016 low). The pair is trading below its 200 DMA.
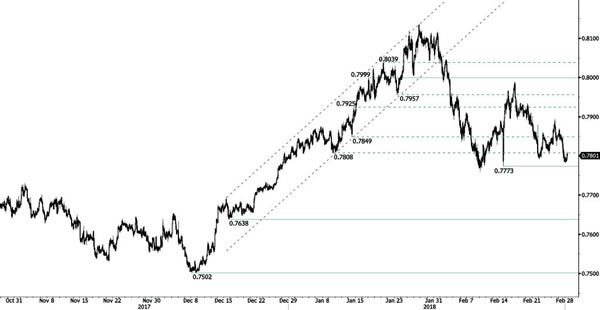
AUD/USD Fails To Break Support At 0.7773
AUD/USD recovery resumes, the pair is trading at the 0.78 range and distances hourly support given at 0.7773 (14/02/2018 low). Hourly resistance remains at 0.7999 (17/01/2018 high). The short-term technical structure suggests further upside moves.
In the long-term, the upward trend slows down after failing to reach key resistance at 0.8164 (14/05/2015 low). Key support stands at 0.6009 (31/10/2008 low). A break of the key resistance at 0.8164 (14/05/2015 high) is needed to invalidate our long-term bearish view.