Sample Category Title
Dollar Showing Sign of Reversal, But Yen Even Stronger on Risk Aversion
Yen overtakes Dollar as the strongest major currency for the week so far as helped by risk aversion. DOW dropped -380.83 or -1.5% overnight to close at 25022.42. That also marked the first monthly decline after a 10 month winning streak. All markets will turn their focus to round two of Fed Chair Jerome Powell's Congressional testimony. But seen as being a straight forward person, he's not expected to alter his messages that rocked the markets two days ago.
More on Powell in Hawkish Powell Raises Hopes For Four Rate Hikes This Year
Elsewhere in the currency markets, Commodity currencies and Sterling trading as the weakest ones. Fresh selling is seen in Australian Dollar after data show business investments unexpectedly shrank in Q4. Sterling was pressured by renewed Brexit uncertainties.
Technically, Dollar is finally showing sign of trend reversal. 1.22 handle in EUR/USD was already breached and focus will now be on whether it can be sustained. USD/CHF will likely have a take on equivalent resistance at 0.9469 too.
UK PM May to meet EC President Tusk today
UK Prime Minister Theresa May will be meeting European Council President Donald Tusk today, ahead of her high profile speech on post-Brexit UK-EU relationship tomorrow. May has already expressed her objection to EU's draft Brexit treaty published yesterday. In particular, the treaty proposed a "common regulatory area" to keep Northern Ireland in a customs union, as a fall back solution. May said that "no UK prime minister" will accept that and that she would make that "crystal clear" to EU officials.
On the other hand, EU chief negotiator Michel Barnier warned that UK must honor what it committed back in December, that is, avoiding any sort of hard border in the island of Ireland. He told reports that "I don't bluff anybody ... I am taking note of what was written by the UK itself in that joint report." The taoiseach of Ireland, Leo Varadkar, also said that It's "not OK" for UK to "just say no now". Varadkar said if UK politicians don't want the EU solution, they must come up with another plan.
Germany: Narrow majority of SPD voters supporting grand coalition
In Germany, all eyes are on the result of votes of 464,000 SPD members on the grand coalition with Chancellor Angela Merkel's CDU/CSU. Accord to a poll released yesterday, there is only a narrow majority of 56% of SPD voters favoring the grand coalition. Results should be published this Sunday. CSU leader Horst Seehofer said that if the formation of the grand coalition fails, he's prefer new elections. Senior officials from the CDU, CSU and SPD are meeting today to iron out outstanding issues on the formation of a coalition
BoJ Kataoka warned on premature stimulus exit
BoJ board member Goushi Kataoka urged that "to influence inflation expectations, it is essential that policy coordination between the government and the BOJ ... is firmly ensured through action by both entities." And he noted that " there is still a long way to go before considering a change in monetary policy stance." He warned against premature stimulus exit as that could drag Japan back into deflation. Kataoka is the persistent sole dissenter in BoJ since joining last year, pushing for more aggressive easing.
Released from Japan, capital spending rose 4.3% in Q4, above expectation of 3.0%. PMI manufacturing was revised up by 0.1 to 54.1 in February.
Caixin China PMI manufacturing hit six-month high
The Caixin China PMI manufacturing rose 0.1 to 51.6 in February, above expectation of 51.3. The index focuses on small to mid-size manufacturers hit a six-month high. Zhengsheng Zhong, director of macroeconomic analysis at CEBM Group, a subsidiary of Caixin noted that "for now, the durability of the Chinese economy will persist. Looking ahead, whether demand generated from the beginning of work in March will gain strength will be key in determining China's economic direction for 2018."
Australia private capital expenditure unexpectedly dropped -0.2% in Q4, comparing to expectation of 1.0% rise. However, that's probably due to the large upward revision in the prior quarter, from 1.0% to 1.9%. New Zealand terms of trade dropped -0.2% qoq in Q4, below expectation of 0.5% qoq.
Looking ahead
The economic calendar is very busy today. Swiss GDP, retail sales and PMI manufacturing will be released in Europeans session. Eurozone will release PMI manufacturing revision and unemployment rate. UK will release PMI manufacturing, M4 and mortgage approvals.
Later in the day, US will release personal income and spending, jobless claims, construction spending and ISM manufacturing. Canada will release current account and PMI manufacturing.
EUR/USD Daily Outlook
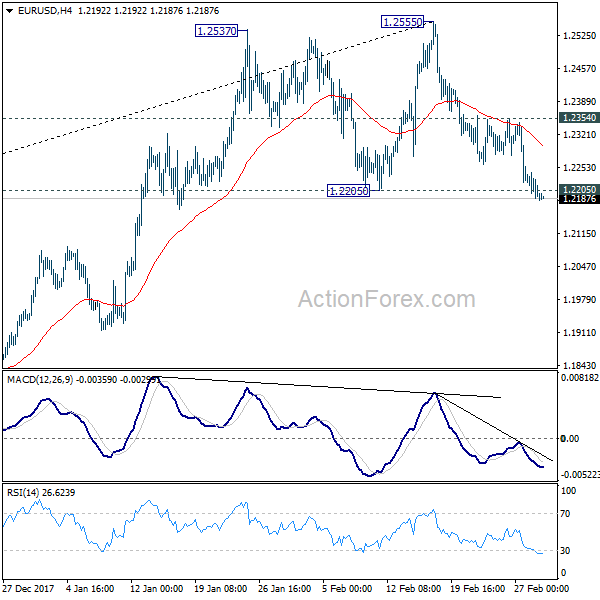
Daily Pivots: (S1) 1.2173; (P) 1.2207 (R1) 1.2227; More....
EUR/USD's break of 1.2205 key support is taken as a tentative sign of trend reversal, after being rejected by 1.2516 key fibonacci level. Intraday bias is now on the downside. Sustained trading below 1.2205 will confirm and target 38.2% retracement of 1.0339 to 1.2555 at 1.1708. On the upside, above 1.2354 minor resistance will dampen this bearish case and bring retest of 1.2555 high instead.
In the bigger picture, key fibonacci level at 38.2% retracement of 1.6039 (2008 high) to 1.0339 (2017 low) at 1.2516 remains intact despite attempts to break. Hence, rise from 1.0339 medium term bottom is still seen as a corrective move for the moment. Rejection from 1.2516 will maintain long term bearish outlook and keep the case for retesting 1.0039 alive. Firm break of 1.5553 support will add more medium term bearishness. However, sustained break of 1.2516 will carry larger bullish implication and target 61.8% retracement of 1.6039 to 1.0339 at 1.3862.

Economic Indicators Update
| GMT | Ccy | Events | Actual | Forecast | Previous | Revised |
|---|---|---|---|---|---|---|
| 21:45 | NZD | Terms of Trade Index Q/Q Q4 | -0.20% | 0.50% | 0.70% | 1.30% |
| 23:50 | JPY | Capital Spending Q4 | 4.30% | 3.00% | 4.20% | |
| 0:30 | AUD | Private Capital Expenditure Q4 | -0.20% | 1.00% | 1.00% | 1.90% |
| 1:30 | JPY | PMI Manufacturing Feb F | 54.1 | 54 | 54 | |
| 1:45 | CNY | Caixin PMI Manufacturing Feb | 51.6 | 51.3 | 51.5 | |
| 5:00 | JPY | Consumer Confidence Index Feb | 44.3 | 44.8 | 44.7 | |
| 6:45 | CHF | GDP Q/Q Q4 | 0.50% | 0.60% | ||
| 6:45 | CHF | GDP Y/Y Q4 | 1.70% | 1.20% | ||
| 8:15 | CHF | Retail Sales Y/Y Jan | 1.10% | 0.60% | ||
| 8:30 | CHF | PMI Manufacturing Feb | 64.1 | 65.3 | ||
| 8:45 | EUR | Italy Manufacturing PMI Feb | 58 | 59 | ||
| 8:50 | EUR | France Manufacturing PMI Feb F | 56.1 | 56.1 | ||
| 8:55 | EUR | Germany Manufacturing PMI Feb F | 60.3 | 60.3 | ||
| 9:00 | EUR | Eurozone Manufacturing PMI Feb F | 58.5 | 58.5 | ||
| 9:30 | GBP | Mortgage Approvals Jan | 62K | 61K | ||
| 9:30 | GBP | M4 Money Supply M/M Jan | 0.40% | -0.60% | ||
| 9:30 | GBP | PMI Manufacturing Feb | 55 | 55.3 | ||
| 10:00 | EUR | Eurozone Unemployment Rate Jan | 8.60% | 8.70% | ||
| 13:30 | CAD | Current Account Balance (CAD) Q4 | -19.3B | |||
| 13:30 | USD | Personal Income Jan | 0.30% | 0.40% | ||
| 13:30 | USD | Personal Spending Jan | 0.20% | 0.40% | ||
| 13:30 | USD | Real Personal Spending Jan | -0.10% | 0.30% | ||
| 13:30 | USD | PCE Deflator M/M Jan | 0.40% | 0.10% | ||
| 13:30 | USD | PCE Deflator Y/Y Jan | 1.70% | 1.70% | ||
| 13:30 | USD | PCE Core M/M Jan | 0.30% | 0.20% | ||
| 13:30 | USD | PCE Core Y/Y Jan | 1.50% | 1.50% | ||
| 13:30 | USD | Initial Jobless Claims (24 FEB) | 226K | 222K | ||
| 14:30 | CAD | RBC Canadian Manufacturing PMI Feb | 55.9 | |||
| 14:45 | USD | US Manufacturing PMI Feb F | 55.8 | 55.9 | ||
| 15:00 | USD | Construction Spending M/M Jan | 0.20% | 0.70% | ||
| 15:00 | USD | ISM Manufacturing Feb | 58.7 | 59.1 | ||
| 15:00 | USD | ISM Prices Paid Feb | 70 | 72.7 | ||
| 15:30 | USD | Natural Gas Storage | -124B |
EUR/USD Daily Outlook
Daily Pivots: (S1) 1.2173; (P) 1.2207 (R1) 1.2227; More....
EUR/USD's break of 1.2205 key support is taken as a tentative sign of trend reversal, after being rejected by 1.2516 key fibonacci level. Intraday bias is now on the downside. Sustained trading below 1.2205 will confirm and target 38.2% retracement of 1.0339 to 1.2555 at 1.1708. On the upside, above 1.2354 minor resistance will dampen this bearish case and bring retest of 1.2555 high instead.
In the bigger picture, key fibonacci level at 38.2% retracement of 1.6039 (2008 high) to 1.0339 (2017 low) at 1.2516 remains intact despite attempts to break. Hence, rise from 1.0339 medium term bottom is still seen as a corrective move for the moment. Rejection from 1.2516 will maintain long term bearish outlook and keep the case for retesting 1.0039 alive. Firm break of 1.5553 support will add more medium term bearishness. However, sustained break of 1.2516 will carry larger bullish implication and target 61.8% retracement of 1.6039 to 1.0339 at 1.3862.
Elliott Wave View: CADJPY Within Wave 5
Short Term CADJPY Elliott Wave view suggests that the decline from 1/5/2018 high (91.58) is unfolding as an impulse Elliott Wave Structure where Minor wave 1 ended at 88.48, Minor wave 2 ended at 89.63, Minor wave 3 ended at 83.824, and Minor wave 4 ended at 84.82. Minor wave 5 is currently in progress and the subdivision also unfolds as an impulse Elliott Wave structure.
Down from 84.82, Minutte wave (i) ended at 84.08, Minutte wave (ii) ended at 84.484, and Minutte wave (iii) ended at 82.94. Expect a bounce in Minutte wave (iv) which can end at 23.6 – 38.2% retracement of Minutte wave (iii) at 83.3 – 83.5 area before another leg lower in Minutte wave (v) of ((i)). Afterwards, pair should end cycle from 2/26 high (84.82) and bounce in Minute wave ((ii)) in 3, 7, or 11 swing before the decline resumes.
CADJPY 1 Hour Elliott Wave Chart
Gold Price To Remain In Downtrend Below $1,335
Key Highlights
- Gold price declined recently and traded below the $1,335 support against the US Dollar.
- There was a break below a major bullish trend line with support at $1,330 on the 4-hours chart of XAU/USD.
- The US Gross Domestic Product Annualized reading came in at 2.5% in Q4 2017.
- The ISM Manufacturing Index for Feb 2018 will be released today, which is forecasted to decline from 59.1 to 58.7.
Gold Price Technical Analysis
There was a fresh downside wave initiated in gold price from well above $1,340 against the US Dollar. The price declined and broke a couple of important support levels such as $1,336 and $1,335.
There could be a short-term correction from the $1,313 low, but upsides are likely to remain capped by the broken support at $1,335.
Looking at the 4-hours chart of XAU/USD, there was a break below a major bullish trend line with support at $1,330. The price even traded below the 100 simple moving average (red, 4-hour) and the 200 simple moving average (green, 4-hour).
The price traded as low as $1,313 and it is currently correcting higher. It tested the 23.6% Fib retracement level of the last decline from the $1,341 high to $1,313 low.
However, there are many resistances on the upside around the $1,335 level. The stated $1,335 level was a support earlier and now it could act as a resistance. An intermediate resistance is around the 50% Fib retracement level of the last decline from the $1,341 high to $1,313 low at $1,327.
On the downside, the recent low of $1,313 is a short term support. Below $1,313, the price may even test the $1,300 support.
US GDP
The US Gross Domestic Product Annualized preliminary reading for Q4 2017 was released by the US Bureau of Economic Analysis. The market was looking for a rise of 2.5% in the GDP in Q4 2017.
The actual result was similar as the GDP increased 2.5% according to the “second” estimate released by the Bureau of Economic Analysis. The US Dollar gained traction after the release versus the Euro, British Pound and other major currencies.
Economic Releases to Watch Today
- Germany’s Manufacturing PMI for Feb 2018 – Forecast 60.3, versus 60.3 previous.
- Euro Zone Manufacturing PMI for Feb 2018 – Forecast 58.5, versus 58.5 previous.
- US Manufacturing PMI for Feb 2018 – Forecast 55.9, versus 55.9 previous.
- US ISM Manufacturing Index for Feb 2018 – Forecast 58.7, versus 59.1 previous.
Market Morning Briefing: Dow Has Fallen Exactly As Expected And A Fall Below 25000
STOCKS
Dow (25029.20, -1.50%) has fallen exactly as expected and a fall below 25000 could open up further chances of testing lower levels of 24800-24500 in the medium term.
Dax (12435.85, -0.44%) is likely to trade within 12400-12600 for the week. Only a break on either side could give an indication of further directional movement for the medium term.
Nikkei (21714.97, -1.60%) has also fallen as expected. While the index trades below 22000, it may continue to move down towards 21500-21250 in the near term.
Shanghai (3268.64, +0.38%) has bounced up a little but is overall stable within the 3250-3350 region. It is likely to remain stable today also without any major movement.
Nifty (10492.85, -0.58%) and Sensex (34184.04, -0.47%) have dipped yesterday. There is lack of an upside momentum just now as the indices are unable to move up sharply. Nifty may re-test support near 10380 while Sensex could test 34000. If the indices are unable to move up immediately, they could be vulnerable to further downside soon.
COMMODITIES
Brent (66.3) and WTI (61.70) are both down sharply. 64 and 60 could hold just now for Brent and WTI pushing back the prices a bit in the coming sessions.
Gold (1317.43) is almost stable near current levels. A test of 1315-1310 is possible on the downside before the price again moves up towards 1340.
Copper (3.1385) has broken below our expected 3.15 and could now test lower levels of 3.10-3.07 in the near term. View is bearish.
FOREX
The Dollar Index (90.712), contrary to expectation has breached resistance near 90.5 on the weekly candles and might now attempt a test of 2 stronger resistances at 91 (3 day line chart and weekly line chart) and at 91.5 (weekly candle chart), which should subsequently produce a dip for the index.
The Euro (1.219) has dipped below 1.22 and is now headed towards crucial support near 1.215 (as seen on daily line chart, 3 day candles and also on 3 day line chart – the support on 3 day line chart had yesterday been mentioned as 1.22 which is revised to approx 1.215). We believe that this support could again lead to a bounce towards 1.25-1.26 in the coming week.
Dollar-Yen (106.74) is close to support near 106.5 on 3 day and weekly line charts. A break of these levels might confirm the possibility for long term bearishness in Dollar Yen.
The Euro-Yen (130.14), has broken support near 131 on the daily candles. If the Dollar Yen respects support near 106.5 while the Euro moves towards 1.25-1.26 next week, we could see a rise in the Euro Yen beyond 131. However, if either the Dollar Yen or the Euro breaks supports near 106.5 or 1.215 respectively, we might see Euro Yen move lower towards 128-129 next week.
Pound (1.375) as per expectation tested lower support near 1.38 on daily and 3 day candles but instead of bouncing has dropped below the support. In case of further bearishness, it could target 1.36 which is seen as crucial support on daily, 3 day and weekly line charts – which should henceforth produce a bounce for the Pound.
Dollar-Rupee (65.175): Upmove can extend up to 65.50-60-70 as well, while market remains above 65.00. Will become highly Overbought at those levels.
INTEREST RATES
US 10 Year Yield (2.86), US 30 year Yield (3.1275), US 5 year yield (2.64), US 2 year yield (2.258) : The 10 Yr yield has dipped below trend line support (near 2.88%) in the channel (formed on the short term chart). The 30 Yr yield has also dipped below support (near 3.13%-3.14%) as seen on short term chart. A further dip in both yields might imply that long term resistances will continue to hold for the coming week. This dip might have been a result of the data release yesterday showing a dip in US GDP growth as compared to the previous quarter.
(Long term resistance levels for the 4 yields have been as follows: 2.85-2.90, 3.20, 2.7 and 2.2 respectively – a decisive breach of these levels could happen sometime in March.)
Goldilocks And The Three Equity Bears
Goldilocks and the three equity bears.
The Goldilocks economy and global equity investors mojo are under threat from the emergence of three bearish narratives.
Federal Reserve Chairman Powell erred to the hawkish side and had speculation running rampant that the Feds will trigger quicker pace of interest rate increases as the economy accelerates. But with the staggering amount of fiscal stimulus entering the marketplace, the risk for the economy to overcook could lead to even higher interest rates. Notwithstanding the fact it opens another can of worms as the Fed starts to withdraw policy accommodation adding more policy constraint.
Libor-OIS spread is a favourite topic of conversation again this morning as renewed tightness is forming in the dollar funding markets. Ignoring unhatched signs of stress in the financial apparatus can be dangerous. But this too appears to be another fall out from tax amnesty as opposed to credit stress in the financial markets. Money markets are losing a massive chunk of short end funding due to US firms’ cash repatriations. Also, the staggering amounts of 3-month treasury paper coming to market is not helping matters either. But regardless of cause and effect, it’s still pressuring dollar funding rates, and therein lies the issue.
Yesterday’s sharp drop in China PMI was nothing short of horrific for commodity markets.China’s official manufacturing PMI fell by 1.0pts to 50.3, its lowest level since mid-2016 and. More to the point, the 2.1pt decline in the China PMI over the past five months is the most significant decline in 6 years. Predictably we’ve seen a sell-off in industrial metals which is negatively impacting commodity sentiment in general. However, given that much of the PMI drop can be explained away by seasonal factors and the Chinese New Year, it may present some tasty levels to re-enter copper and iron ore positions ahead of a likely PMI recovering in March and April.
Oil Markets
The fall in oil prices had their usual far-reaching consequence on a broader basket of assets as a sense of risk reduction grips markets
Dispirited signs the DoE inventory report sent oil prices plummeting as WTI prices dumped one large figure to trade deep in the $ 61.00’s per barrel handle on the inventories gusher.
Traders are hypersensitive to crucial inventories data especially top side builds given the markets refocusing on shale production output as the US remains on course to be the worlds largest oil producer has prices convincingly moving lower.
Also, yesterday’s economic data from Japan and China also weighed on sentiment as the massive misses on Japan’s industrial data and China have dented the global growth outlook.
Oil prices are staring at a very greasy poll higher today
Equity Markets
Waves of risk aversion are running through investors heads as they prepare for round two of Jay Powell’s testimony probably hoping that he dials back on some of those hawkish overtones he delivered to Congress on Tuesday.
But at the heart of the overnight equity sell-off is tumbling oil prices that have tanked the energy sector as investors are not only growing concerned about increasing shale production weighing on oil prices but also the tepid industrial data out of both Japan and China which could dent the rosy global growth narrative and weigh on oil demand.
Gold Markets
Not an overly exciting 24 hours in the gold markets as traders sit tight awaiting round two of Jay Powell testimony to the Senate which tends to more telling. Of course, there’s the chance he dials back his hawkish rhetoric, but if he stays the course, there’s always a chance we could see higher repricing of US interest rates and a slightly firmer DXY which could trigger another leg lower in Gold prices. The balance of risks suggest Gold prices will move lower on day 2 of Powell’s testimony
Currency Markets
The dollar rose to five-week highs on Wednesday, buttressed by a cheery assessment of the U.S. economy from the Federal Reserve’s new chairman, which has raised the spectre of a faster pace of interest rate normalisation through 2019. While the dollar continues to bask in the afterglow from Powell’s day one testimony, but it could get interesting if Powell gears back the hawkish retort as the dollar bears are trying to decide when and where to pick their spots.
The Japanese Yen
Traders don’t have to make sense out of currency markets; they just have to be right. While yield differential suggests a higher USDJPY, with month end exporter flow dominating the landscape while JPY crosses feeling the pressure from a halt in the equity market rebound we should expect downside pressure to remain. Also with the BoJ reducing purchases yesterday, it always creates an air of policy uncertainty warranted or otherwise.
The Euro
It was always going to be a stressful week for the Euro ahead of the Italian election, but a combination of month end USD demand and a general dollar bid has driven the EURUSD below the critical 1.2200 level. While the Italian polls weigh on sentiment, its been more of a dollar storyline than anything else the past 48 hours as it now becomes a USD trend follower as opposed to the leader. The break of 1.22000 could trigger a more profound move lower as the EURUSD market is still long and was not positioned correctly for a stronger USD and we could unleash some stops on the way down
The Australian Dollar
The weaker China PMI and the commodity knockdown effect is weighing on regional sentiment, but the Aussie is also feeling the brunt of a hawkish fed’s positive impact on USD sentiment. Adding to the Aussie woes today’s CAPEX came in soft 0.2% QoQ expected 1%. This should put further pressure on AUD which is already the go-to currency fro establish near-term USD longs.
Asia EM FX
The pace of play will likely remain directed by broader market USD sentiment through weeks end.
The Malaysian Ringgit
With the headline CPI coming in below market expectations at 2.7% YoY (Consensus: 2.8%, Dec: 3.5%), it means the BNM will stay on hold through March which will weigh on near-term MYR sentiment. However, it has not put to rest another rate hike in 2018. Although the stronger MYR likely impacted the CPI reading, we should expect the BNM to prefer a gradual pace of MYR appreciation to complement the OPR hikes while attempting to bring overall monetary conditions back into equilibrium.
But adding to the Ringgit negative tone, this morning’s manufacturing PMI fell below the expansionary level 50 coming in at 49.9 vs 50.5 prior, definitely a bearish Ringgit setup today.
Hong Kong Dollar
USDHKD is at the highest level since 2007 as the broader interest discount gap is causing some concern amongst investors who are looking to park funds under the relative safety of the USD.
Pound Slides As Tensions With EU Worsen
The British pound has posted sharp losses in the Wednesday session. In North American trade, GBP/USD is trading at 1.3784, down 0.90% on the day, after London reacted angrily to an EU draft Brexit agreement. In economic news, there are no British events on the schedule. In the US, Preliminary GDP for Q4 came in at 2.5%, matching the forecast. Housing data continues to be a concern, as Pending Home Sales declined 4.7%, well off the estimate of 0.4%.
Tensions between the May government and the EU ratcheted up on Wednesday, after the EU published a draft of a legal framework after Brexit. Two items in the EU draft have raised the ire of London. First, the proposal that EU would keep Northern Ireland in the bloc’s customs union, with a border between the north and the UK. Second, that the European Court of Justice (ECJ) would have the final say in any disputes over the Brexit agreement. May wasted no time responding to the EU proposal, saying a customs union between the UK and Northern Ireland would threaten the constitutional integrity of the United Kingdom. May is unlikely to accept a role for the ECJ after Brexit, as this would be seen as undermining British sovereignty. Meanwhile, the Europeans dismissed May’s proposal that a final trade deal would allow some divergence with EU regulations in certain industries, but the Europeans have dismissed this as ‘cherry picking’, which they say is a non-starter. May will lay out her post-Brexit vision of relations with the EU in a speech on Friday and if the Europeans pour cold water on her plan, the markets could react negatively.
Federal Reserve Chair Jerome Powell sounded hawkish in his testimony before a congressional committee on Tuesday. Powell was cautious, saying that the Fed planned to continue its current policy of gradual rate increases, despite the stimulus of government spending and recent tax reform. Powell sounded optimistic about economic conditions, noting that the US economy was benefiting from the global recovery as well as changes in fiscal policy. Importantly, Powell did not address the question of an acceleration of rate hikes. Currently, the Fed has projected three rate hikes in 2018, with increases widely expected at the March and May meetings. However, with inflation moving higher and the economy continuing to perform well, many analysts expect the Fed to raise rates four or more times this year. Any hints at an increased pace of rate hikes could send the US dollar broadly higher.
Yen Gains On Dollar, Shrugs Off Weak Japanese Data
The Japanese yen has posted considerable gains in the Wednesday session. In North American trade, USD/JPY is trading at 106.60, down 0.68% on the day. On the release front, Japanese indicators were soft. Preliminary Industrial Production dropped 6.6%, compared to the estimate of -4.1%. Retail Sales fell to 1.6%, shy of the estimate of 2.3%. This marked a 3-month low. There was more bad news, as Housing Starts plunged 13.2%, missing the estimate of 4.5%. This reading was the worst since December 2014. Later in the day, Japan releases Final Manufacturing PMI. In the US, Preliminary GDP for Q4 came in at 2.5%, matching the forecast. Housing data continues to be a concern, as Pending Home Sales declined 4.7%, well off the estimate of 0.4%.
The US dollar recorded slight gains against the yen after Federal Reserve Chair Jerome Powell’s testimony before a congressional committee on Tuesday. Powell was cautious, saying that the Fed planned to continue its current policy of gradual rate increases, despite the stimulus of government spending and recent tax reform. Powell sounded optimistic about economic conditions, noting that the US economy was benefiting from the global recovery as well as changes in fiscal policy. Importantly, Powell did not address the question of an acceleration of rate hikes. Currently, the Fed has projected three rate hikes in 2018, with increases widely expected at the March and May meetings. However, with inflation moving higher and the economy continuing to perform well, many analysts expect the Fed to raise rates four or more times this year. Any hints at an increased pace of rate hikes could send the US dollar broadly higher.
Yen Sends Warning Signal
The yen took a bite out of the rest of the foreign exchange market on Wednesday to cap off a strong month. JPY was the top performer while the pound sterling lagged. Aussie is the worst performer in early Thursday Asia after weaker than expected capex data. All eye turn to Thursday's release of the US Jan core PCE price index, expected unchanged at 1.5%. A new trade in CAD cross has been posted & sent to Premium subscribers moments ago.
A calm settled over markets in the past two weeks but if the moves in the US dollar and yen are any indication, more trouble could be brewing. A rally in the yen Wednesday preceded a 30 point drop in the S&P 500. The index finished on the lows for the second straight day.
Technically, there were breaks all over. GBP/JPY fell below the 200-day moving average and the February low. EUR/JPY also hit the lowest since September in a sharp fall.
Against the US dollar, the euro, GBP and Canadian dollar also broke the February lows as they erased the recent bounces. The pound was the biggest Wednesday loser amid snags in the Brexit deal flare up, particularly the Irish border.
Economic data wasn't a major factor as the estimate of Q4 GDP dipped to 2.5% from 2.6%, as expected. One concern was in pending home sales as they fell 4.7% compared to a 0.5% rise expected.
One refuge of the bulls is that Wednesday was month-end and that flows could skew the market moves. However, we remind them that they said the same thing at the end of January, only to be beaten up in the first month of February.
Looking ahead, the Asia-Pacific calendar is buys with several Japanese releases including capital spending, corporate profits, the PMI from Nikkei, consumer confidence and vehicle sales. Those will offer a solid look at the path of the economy.
Aussie is down across the board after private capital expenditure data showed firmes planned to spend AUD $84bn in 2018-19, vs AUD $86.5bn expected, while spending in Q4 fell 0.2% vs exp +1.0%.
Seasonality in 10-Year Treasury Yields?
When evaluating economic variables, it is essential to be aware if they exhibit seasonal behavior. Correcting for seasonal patterns often allows the underlying trend to surface more clearly.
Seasonal Trends in Credit Markets?
Most of the headline-grabbing economic indicators exhibit seasonal distortions and are thus seasonally-adjusted to cut through the noise of the calendar. It is no surprise, for example, that non-seasonally-adjusted retail sales jump around the winter holidays. A seasonally-adjusted series serves the important function of stripping out annual events/trends such as holidays and seasonal patterns to make analysis of the underlying trend more manageable. Other widely cited indicators, such as the 10-year Treasury yield, are quoted in non-seasonally adjusted terms, as is the standard for this type of security. However, in our analysis, we found that from the period of 2000-2017, the 1o-year Treasury yield exhibited visible seasonal behavior (top chart). One would perhaps expect slight variations in yields from month to month, with no clear pattern emerging. However, the rise in yields we see during the summer months and subsequent decline in the fall is hard to ignore. When this exercise was repeated for periods within this larger sample (2000-2007 and 2008-2017), the results yielded the same seasonal trends.
Summer Selloff?
As shown in the top chart, yields tend to peak in May and remain high through July before falling in August and September. This pattern holds constant through all the periods we tested. Likewise, the largest month-overmonth increase from 2000-2017 occurred in May, with an average gain of roughly 5 bps, while August and September typically experience the largest yield drop offs of 12 bps and 11 bps, respectively. Yields then tend to plateau to finish out the year. It is important to note that the perceived jump in yields from December to January (when looking at the top chart) is actually a little misleading because of a level gap for those months. Historically, yields tend to fall in January, month over month (middle chart).
Seasonality, So What?
To better test our seasonal hypothesis, we applied a seasonal filter to the series and then subtracted it from the original 10-year Treasury series (bottom chart). In general, if a series exhibits little to no seasonal behavior, the difference between the two series should be zero, or close to zero. However, as shown in the bottom chart, the summer months, particularly May, June and July, reveal seasonal behavior with an upward bias. Similarly, the months of September, October and November appear to exhibit seasonal distortions to the downside. While the difference between the two series is not enormous, it is large enough in certain months to ask questions regarding the potential causes for such seasonal patterns. We will explore the drivers behind the seasonality in the 10-year in a follow-up report next week.