Sample Category Title
Technical Outlook: WTI OIL Is Consolidating After Strong Rally, Rising Daily Cloud Continues To Underpin
WTI oil price is consolidating under fresh over two-week high at $63.07, posted on Thursday when oil prices surged on positive US crude inventories data.
EIA weekly report showed unexpected fall in US crude inventories against forecasted build which sparked strong rally.
Oil price accelerated above daily cloud and exceeded previous high at $62.63, on rally to $63.07 peak, generating strong bullish signal on close in long bullish daily candle.
Current consolidation is a result of profit-taking as well as traders digesting positive data which turned near-term bias bullish and sidelining fears of rising US output.
Structure of daily techs improved as oil price is gaining momentum, but daily MA’s are still in mixed mode.
WTI contract is on track for the second weekly bullish close which adds to positive near-term outlook.
Break above 30SMA which capped Thursday’s rally (currently at $63.05) and pivotal $63.36 barrier (Fibo 61.8% of $66.64/$58.06 downleg) is needed to generate stronger signal for bullish continuation.
Consolidation was so far contained by falling 20SMA ($62.30) with extended downticks expected to remain above the top of rising daily cloud ($61.90) to keep bullish bias intact.
Res: 63.05, 63.36, 64.27, 64.62
Sup: 62.30, 61.90, 61.52, 61.22
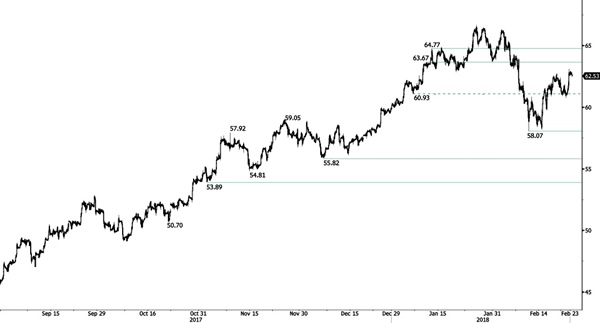
CRUDE OIL Buying Pressures Resume
Crude oil upward trend resumes, curerntly trading above 62.50 and approaching hourly resistance found at 63.67 (10/01/2018 high). Crude oil hourly support remains at 58.07 (09/02/2018 low). The technical structure suggests short-term upside moves.
In the long-term, crude oil has recovered after its sharp decline last year. However, we consider that further weakness is very likely. For the time being, the pair lies in an upside trend since June 2017. Support lies at 42.20 (16/11/2016) while resistance is located at 77.83 (20/11/2014). Crude oil is trading largely above its 200 DMA.
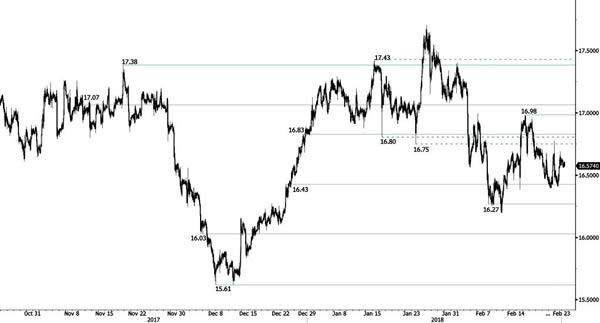
SILVER Upward Consolidation
Silver is maintained at the range of 16.55 and trades indistinctly. Silver is trading between hourly support and resistance given at 16.27 (07/02/2018 low) and 16.98 (15/02/2018 high). The technical structure suggests further shortterm sideway moves.
In the long-term, the trend remains negative/ sideways. Further downside is very likely. The pair is trading below its 200 DMA. Resistance is located at 21.58 (10/07/2014 high). Strong support can be found at 11.75 (20/04/2009).
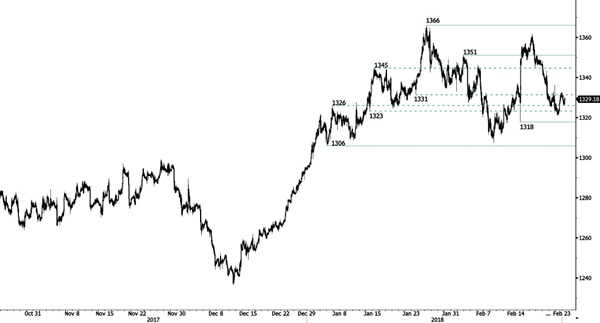
GOLD Testing 1330
Gold is trading higher, nearing the range of 1330, though a short-term bearish pattern dominates. Hourly support and resistance are given at 1306 (04/01/2018 low) and 1366 (25/01/2018 high). The technical structure suggests further downside moves.
In the long-term, the technical structure suggests that there is a growing upside momentum. A break of 1'392 (17/03/2014) is required to confirm it. A major support can be found at 1'045 (05/02/2010 low).
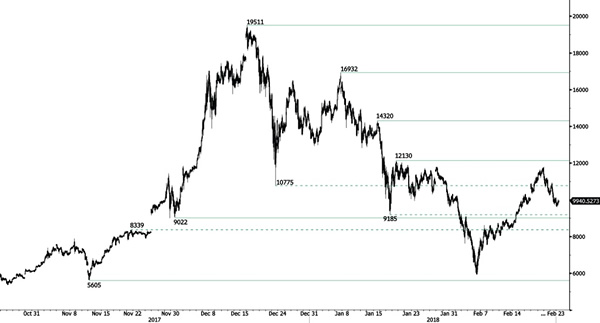
BITCOIN Sideways Price Action Maintained At 10000
Bitcoin upward trend stops following slight decrease above 10000. Expected to continue consolidation above the 10000 range. Hourly support remains at 9022 (30/11/2017 low) while resistance is given at 12130 (18/01/2018 high).
In the long-term, the digital currency has had an exponential growth but also presented important downturns. There is decent likelihood that the currency could stabilize between 7'000 - 12'000 in 2018. Bitcoin is trading above its 200 DMA (6'500 range).
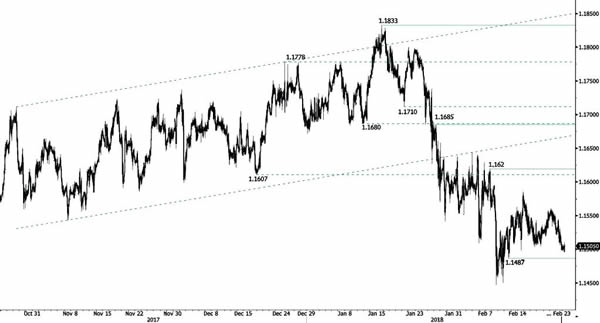
EUR/CHF Showing Signs Of Weakness
EUR/CHF declines following recovery slow down. The pair approaches hourly support given at 1.1487 (12/02/2018 low) while hourly resistance at 1.162 (07/02/2018 high) is maintained. The technical structure suggests further short-term downside moves.
In the longer term, the technical structure has reversed. Strong resistance is given at 1.20 (level before the unpeg). Yet, the ECB's slowing QE program is likely to cause buying pressures on the euro, which should weigh in favour of the EUR/CHF. Support can be found at 1.0234 (20/04/2015 low).
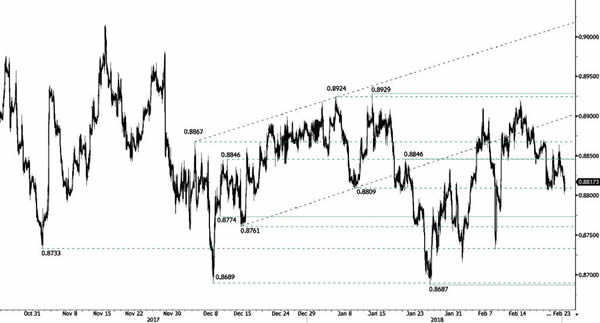
EUR/GBP Declining
EUR/GBP loses ground, and slowly approaches hourly support at 0.8774 (11/12/2017 low). Hourly resistance at 0.8846 (12/12/2017 high) is distanced. The technical structure suggests further short-term downward moves.
In the long-term, the pair has largely recovered from 2015 lows. The technical structure suggests further upside pressure. Strong resistance can be found at 0.9500 (psychological level) while support remains at 0.8304 (05/12/2016 low). The pair is trading below its 200 DMA.
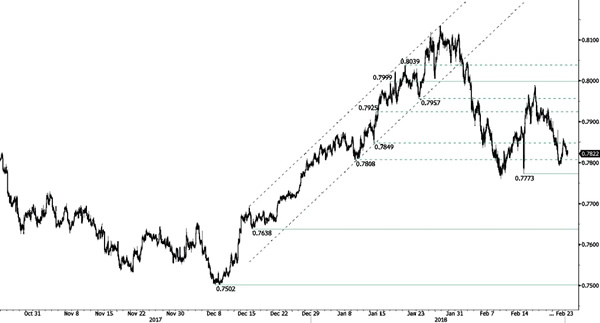
AUD/USD Downward Consolidation
AUD/USD recovery loses steam and approaches hourly support at 0.7773 (14/02/2018 low). Hourly resistance is maintained at 0.7999 (17/01/2018 high). The short-term technical structure suggests further downside moves.
In the long-term, the upward trend slows down after failing to reach key resistance at 0.8164 (14/05/2015 low). Key support stands at 0.6009 (31/10/2008 low). A break of the key resistance at 0.8164 (14/05/2015 high) is needed to invalidate our long-term bearish view.
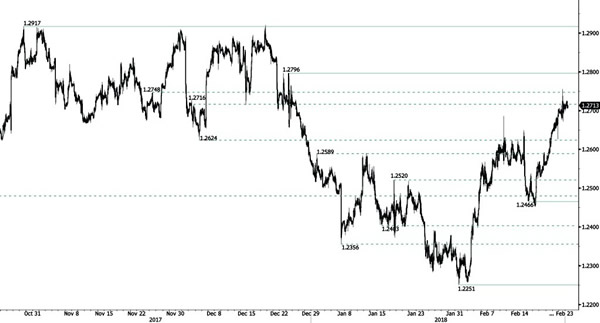
USD/CAD Bullish Trend Maintained
USD/CAD increases further after breaking hourly resistances at 1.2716 (04/12/2017 high) and 1.2748 (24/11/2017 high), recovering from December downward pattern. New hourly resistance is given at 1.2796 (25/12/2017 high) while hourly support is maintained at 1.2466 (15/02/2018 low). The technical structure indicates that continued rise is expected in the short-term.
In the longer term, the pair is trading between resistance point at 1.3805 (05/05/2017 high) and support at 1.2128 (18/06/2015 low). Strong resistance is given at 1.4690 (22/01/2016 high). The pair is likely to head lower. The pairs is trading above its 200 DMA.
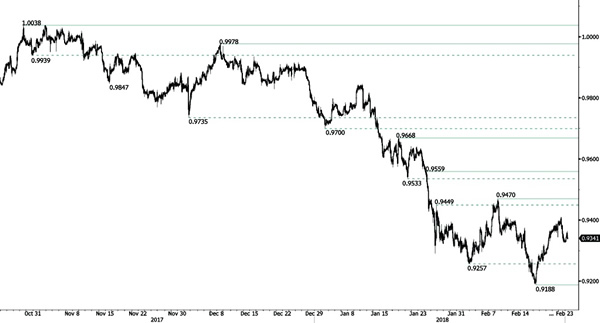
USD/CHF Pushing Higher
USD/CHF ended its short-term downward trend, heading for further rise along 0.94. Hourly resistance stands at 0.9470 (08/02/2018 high) while hourly support remains at 0.9188 (16/02/2018 low).
In the long-term, the pair is still trading in range since 2011 despite some turmoil when the SNB unpegged the CHF. Key support lies at 0.9072 (07/05/2015 low) while resistance at 1.0344 (15/12/2016 high) is distanced. The technical structure favours a long term bullish bias since the unpeg in January 2015.