Sample Category Title
EURJPY Continues the Strong Bearish Tendency; Strong Support Zone at 131.20
EURJPY is heading lower over the last three weeks, following the pullback from the more than a 2-year high of 137.50. Prices managed to bounce up to the 133.00 handle on Wednesday but soon stepped back, falling to a fresh 3-month low of 131.22. The bearish picture in the short-term is further supported by the technical indicators.
Looking at the 4-hour chart, momentum indicators are also pointing to a continuation of the bearish bias. The stochastic oscillator posted a bearish crossover within its moving averages, while the MACD oscillator is still holding in the negative territory and is falling below its trigger line.
If the market continues the sell-off, a drop below the significant barrier of 131.20, which has been tested several times in the past, could shift focus to the 129.30 support level, taken from the low on September 6. A fall below the latter level could open the way towards the 127.45 barrier in the medium-term.
Conversely, in case of an upward correction of the aggressive bearish move, the price could re-challenge the 23.6% Fibonacci retracement level of 132.70. A break above the aforementioned obstacle could see a re-test of the 133.00 psychological level.
GBPJPY Struggles Below 20 and 40 SMA; Could Gain Upside Momentum
GBPJPY is currently paring some of Thursday's losses but the last couple of hours it has been trading with weak momentum. Meanwhile, the price has been struggling below the 20- and 40-period simple moving averages in the short-term timeframe, which are near the 149.40 resistance level.
From the technical point of view, the market could increase positive momentum in the short-term. In the 4-hour chart, the MACD oscillator is moving slightly to the upside above its trigger line, while the stochastic oscillator is approaching the overbought area.
Upside moves above the 149.50 significant barrier are likely to find resistance at near the 151.00 psychological level, but the price needs to surpass the 23.6% Fibonacci retracement level of 149.90 of the down-leg with the high of156.60 and the low of 147.90. Rising above this area would shift the focus to the upside towards the 38.2% Fibonacci mark of 151.20.
If price action remains negative, the next level to have in mind is the 148.50 support level. A slip below the aforementioned level could open the door to the key barrier of 148.00.
Sunset Market Commentary
Markets
Global core bonds corrected higher today. The move mainly occurred ahead of the start of the US trading session. Additional gains for oil and stocks couldn't counter the upleg. The end of this week's US supply operation and a preference for a more neutral positioning into next week's important events probably added to today's technical repositioning. Technically, the US 30-yr yield failed to break above 3.22% resistance, which probably added to moves. EMU headline inflation as expected was downwardly revised from 1.4% Y/Y to 1.3% Y/Y. The German yield curve bull flattens at the time of writing with yields 1.5 bps (2-yr) to 4.3 bps (30-yr) lower. The US yield curve shifts in similar fashion with yields 0.8 bps (2-yr) to 3.1 bps (30-yr) lower. Peripheral yield spreads vs Germany add 4 to 6 bps. Belgian OLO's don't underperform after the Kingdom's announcement that it intends to issue an inaugural syndicated green OLO next week (OLO 86 Apr2033).
USD trading was also mostly technical in nature. Core yields eased further but the move was again more or less parallel between the US and EMU, leaving little guidance for EUR/USD trading. Investors are probably looking forward to next week's EMU event risk with the ECB meeting, the Italian elections and the outcome of SPD member vote on a new German government coalition. With the market positioned long euro/short dollar, this might cap the topside in EUR/USD. The pair hovers near the 1.23 big figure. At the same time, USD/JPY also maintains a slightly negative bias (currently 106.80 area). The combination of both EUR/USD and USD/JPY tendencies pushed EUR/JPY back lower in the key 132/131 support area. For now, the move remains orderly with little impact on other markets. However, EUR/JPY still deserves monitoring.
Sterling traded with a positive bias against the euro, and to a lesser extent against the dollar. There was a brief intraday drop (reportedly due to low liquidity), but it was reversed soon. UK PM PM May will give her speech on Brexit on March 02. For now, we didn't seen any concrete new steps of progress in the run-up to next month's Brexit negotiations. BoE's Ramsden in a speech indicated that Brexit is likely to weigh on UK productivity. This also contains an upward inflation risk, supporting the case for further BoE policy tightening. EUR/GBP drifted below 0.88. Cable hovers below 1.40. We maintain the view that more concrete progress on Brexit is needed to cause sterling gains beyond the 0.8690 support.
News Headlines
EUR/SEK jumped well beyond the psychological barrier of 10.00, marking the weakest level of the krona against the euro since November 2016. The minutes of the Riksbank's latest policy meeting suggest that the timing of a first rate hike might be postponed. Until now, the Riksbank signalled a first rate hike in the second half of 2018.
Canada's inflation declined in January to 1.7% Y/Y from 1.9% in December as consumers paid less for gasoline and vehicles, offsetting a pick-up in the cost of food. However, the decline was less than expected (consensus 1.5%) while underlying inflation firmed. CPI common, which the central bank says is the best gauge of the economy's underperformance, rose to 1.8%, the highest since April 2012.
Banks in the European Union will have eight years to write down bad debts backed by collateral under proposals from the European Commission designed to tackle their 759 billion euros ($933.19 billion) in soured loans, a source familiar with the matter said on Friday.
U.S. House Financial Services Committee announces the date of Federal Reserve Chairman Jerome Powell's semi-annual testimony has been brought forward one day to Feb. 27, at 10 a.m. in Washington, due to a change in the House schedule.
More Signs of Underlying Firming in Canadian CPI Growth in January
Highlights:
- Headline CPI growth eased to 1.7% from 1.9% in December - but only because a large monthly jump in energy prices a year ago wasn't repeated.
- Excluding food & energy, year-over-year price growth inched down to 1.5% from 1.7% in December.
- The Bank of Canada's preferred 'core' measures ticked higher, on balance. The CPI-common measure ticked up to 1.8% - its highest level since 2012.
Our Take:
Year-over-year growth in headline CPI moderated to 1.7% in January from 1.9% in December - but that was still well-above market expectations for a 1.5% increase. An unusually large but ultimately transitory month-over-month increase in prices a year ago was supposed to weigh more heavily on the January year-over-year growth rate. Price growth excluding food & energy products also ticked down to 1.5% from 1.7% in December - but that was also a little stronger than we expected given the aforementioned year-ago base effects. The Bank of Canada's core measures actually ticked higher, on balance. The median and trim measures held steady while the CPI-common measure ticked up to 1.8% from 1.6%.
Part of the stronger-than-expected increase in January CPI appears to have come from businesses in Ontario hiking prices in response to a large increase in the minimum wage. Excluding Ontario, year-over-year CPI growth moderated to about 1.6% from 2.1% last month by our calculation. With that said, signs of firming in both wages and consumer price growth are not really new. To be sure, there is still little evidence that inflation is anywhere close to getting out of hand on the upside. At the same time , firming in underlying price growth should further reinforce the Bank of Canada's view that the economy is operating pretty close to its long-run capacity - and supporting the view that further gradual rate hikes towards more normal long-run 'neutral' levels will be appropriate.
US 100 Index Regains Lost Ground, Approaches All-Time Highs
The US 100 index has risen in the past two weeks, recovering more than half of the losses it posted in early February when it fell 12.5% over the period January 29 - February 9. During that period, the index collapsed from an all-time high of 7037, before it found support near the crossroads of the 6162 level, the uptrend line drawn from the low of June 2016, and the 200-day exponential moving average. Subsequently, it rebounded and is currently trading not far from its record highs, last seen at 6803.
Momentum oscillators paint a cautiously positive picture for the index. The RSI rebounded from its neutral 50-line and is pointing upwards, detecting modest upside momentum. The MACD, already above both its zero and trigger lines, looks to be moving higher as well.
Should the index continue along its recovery path, immediate resistance may be encountered near the latest highs of February 21, at 6890. If the bulls manage to break that territory, the next level that could come into play is the aforementioned all-time high of 7037. Further advances after that would take the index into uncharted territory. In such a case, sell orders may be found near round figures, as they may hold some psychological significance. For instance, the 7200 or 7300 territories could provide some resistance. Continued upside could even aim for the 7570 barrier, which is the 161.8% Fibonacci retracement of the January 29 - February 9 collapse, with a high at 7037 and low at 6162.
On the other hand, in case the upside momentum fades and the index tumbles again, immediate support may be found at 6690, the February 22 low. A downside break of that zone could set the stage for declines towards the 6286 hurdle, which is the 23.6% Fibonacci retracement of the February 2016 - January 2018 advance, with a low at 3866 and high at 7032. If sellers manage to break below that level too, then buy orders may be lurking near the index's recent lows at 6162, marked by the lows of February 9. A potential violation of that territory too, would mark a forthcoming lower low on the daily chart, and could be a signal for even more declines, initially towards the psychological area of 6000.
Canada: Inflation Mild in January, But Core Measures Show Signs of Firming Price Pressures
Consumer prices rose a faster-than-expected 1.7% year-on-year in Canada in January (consensus was for 1.5%), edging down from 1.9% in December.
The deceleration in headline inflation was mainly an energy price story. Energy prices rose swiftly last January, and as those gains fell out of the index, the year-on-year rate fell to 2.4% (from 4.5% in December). Prices were up a robust 0.5% on a seasonally adjusted month-on-month basis.
Food price inflation meanwhile picked up steam, rising 2.3% (up from 2.0%) and rising at the fastest rate since April 2016. Higher prices at restaurants led the acceleration, rising to 3.7% (from 2.9% in December).
Core price measures showed a firming trend with the CPI-common moving up from 1.6% to 1.8%, while CPI-trim and CPI-median remained unchanged at 1.8% and 1.9% respectively.
Key Implications
The impact of minimum wage legislation in Ontario was hard to ascertain in the January employment report, but easier to see in the price data. The acceleration in food price growth came in large part due to restaurants and in Ontario. Child care and housekeeping services prices also accelerated in the month.
The Bank of Canada may look through the one-time impact of higher minimum wages, but it cannot ignore the broader evidence of price pressures that are becoming apparent. The firming in core measures in particular, suggests that the strong economic growth that Canada has experienced over the past year is doing its job in pushing inflation toward the Bank's 2% target.
EUR/USD Mid-Day Outlook
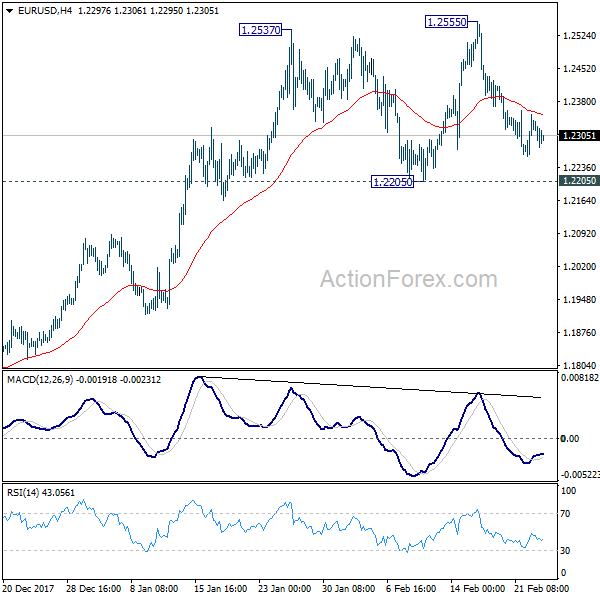
Daily Pivots: (S1) 1.2276; (P) 1.2314 (R1) 1.2369; More....
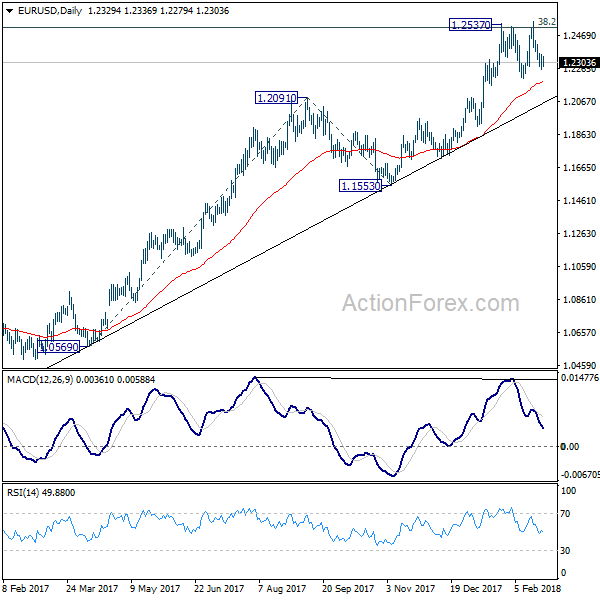
EUR/USD is staying in corrective trading in range of 1.2205/2555. Intraday bias remains neutral. On the upside, break of 1.2555 will revive the bullish case of up trend resumption and target 100% projection of 1.0569 to 1.2091 from 1.1553 at 1.3075. However, break of 1.2205 will confirm rejection by 1.2516 key fibonacci level and trend reversal.
In the bigger picture, key fibonacci level at 38.2% retracement of 1.6039 (2008 high) to 1.0339 (2017 low) at 1.2516 remains intact despite attempts to break. Hence, rise from 1.0339 medium term bottom is still seen as a corrective move for the moment. Rejection from 1.2516 will maintain long term bearish outlook and keep the case for retesting 1.0039 alive. However, sustained break of 1.2516 will carry larger bullish implication and target 61.8% retracement of 1.6039 to 1.0339 at 1.3862.
GBP/USD Mid-Day Outlook
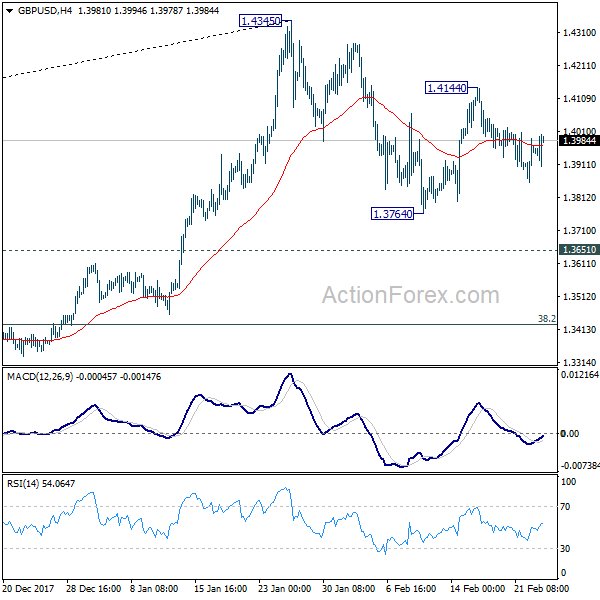
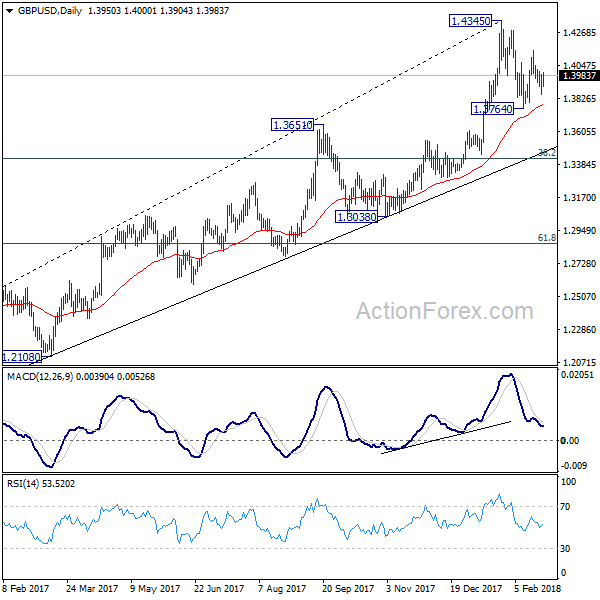
Daily Pivots: (S1) 1.3878; (P) 1.3933; (R1) 1.4010; More....
Intraday bias in GBP/USD remains neutral at this point. On the upside, break of 1.4144 will extend the rebound from 1.3764 and target a test on 1.4345 resistance. Break there will resume larger up trend and target long term trend line resistance (now at 1.5105). On the downside, below 1.3764 will extend the correction from 1.4345 to 1.3651 resistance turned support instead.
In the bigger picture, as long as 1.3038 support holds, medium term outlook in GBP/USD will remains bullish. Rise from 1.1946 is at least correcting the long term down from 2007 high at 2.1161. Further rally would be seen back to 38.2% retracement of 2.1161 (2007 high) to 1.1946 (2016 low) at 1.5466. However, GBP/USD fails to sustain above 55 month EMA (now at 1.4279) so far. Break of 1.3038 support, will suggests that rise from 1.1946 has completed and will turn outlook bearish for retesting this low.
USD/CHF Mid-Day Outlook
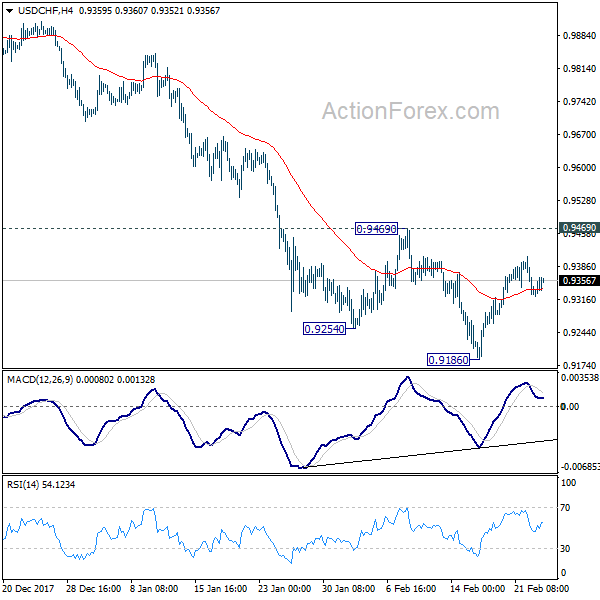
Daily Pivots: (S1) 0.9298; (P) 0.9354; (R1) 0.9382; More...
USD/CHF's consolidation from 0.9186 is still in progress and intraday bias remains neutral. Near term outlook stays bearish with 0.9469 resistance intact. On the downside break of 0.9186 will extend the larger down trend to 0.9115 medium term projection level next. However, considering bullish convergence condition in 4 hour MACD, break of 0.9469 will indicate near term reversal and turn outlook bullish for 55 day EMA (now at 0.9527) and above.
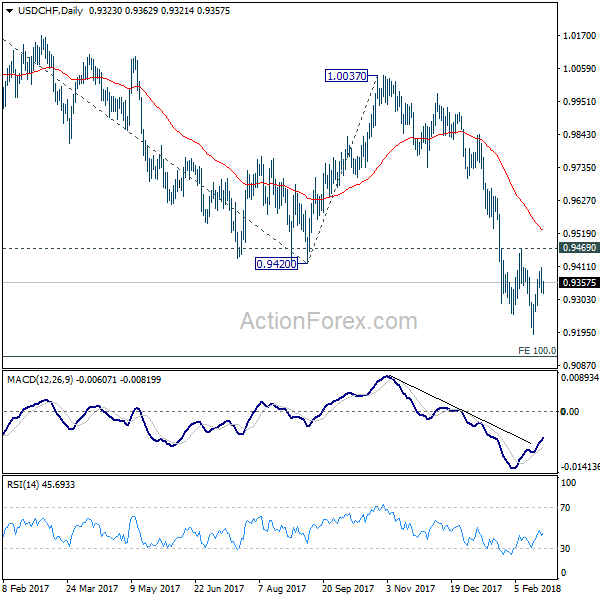
In the bigger picture, fall from 1.0342 is developing into a medium term down trend. Deeper decline should be seen to 100% projection of 1.0342 to 0.9420 from 1.0037 at 0.9115. Break will target 161.8% projection at 0.8545. In any case, sustained trading above 55 day EMA is needed to be the first sign of medium term reversal. Otherwise, outlook will stay bearish even in case of strong rebound.
USD/JPY Mid-Day Outlook
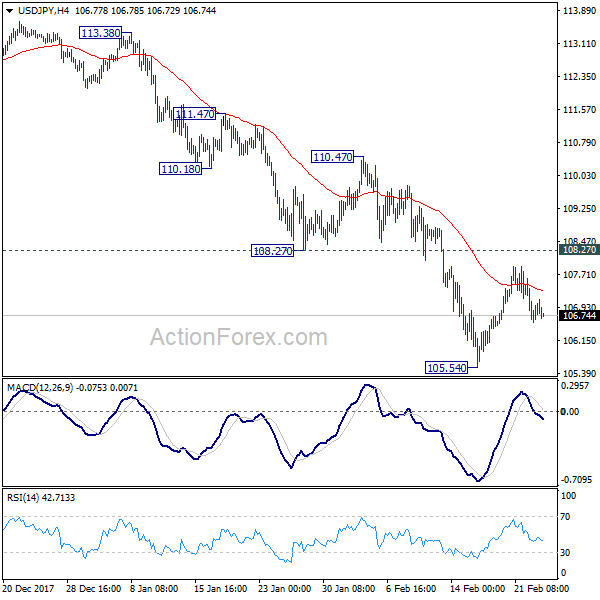
Daily Pivots: (S1) 106.31; (P) 107.03; (R1) 107.48; More...
Intraday bias in USD/JPY remains neutral as consolidation from 105.54 is extending. Outlook remains bearish with 108.27 resistance intact and deeper fall is expected. Break of 105.54 will extend the larger fall from 118.65 and target 100% projection of 118.65 to 108.12 from 114.73 at 104.20 next. However, break of 107.72 will be the first sign of near term reversal and will target 110.47 resistance for confirmation.
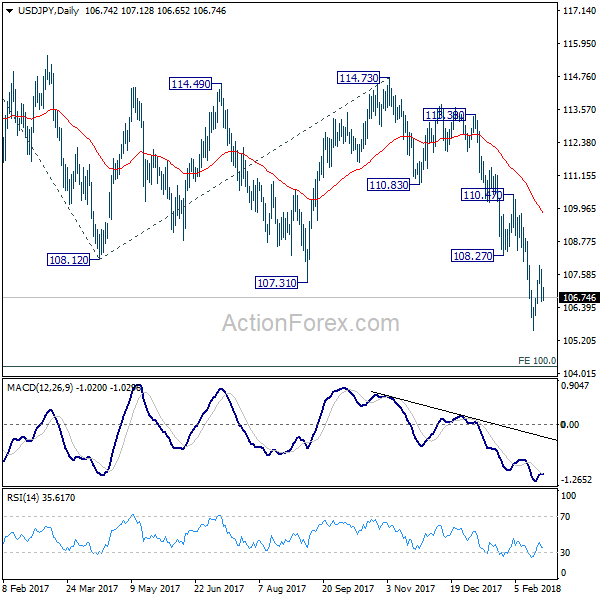
In the bigger picture, current development argues that the corrective pattern from 118.65 is extending. The solid break of 61.8% retracement of 98.97 to 118.65 at 106.48. now suggests that the pattern from 125.85 high is possibly extending. Deeper fall could be seen through 98.97 key support (2016 low). This bearish case will now be favored as long as 110.47 resistance holds.