
Sample Category Title
USD/CHF Weekly Outlook
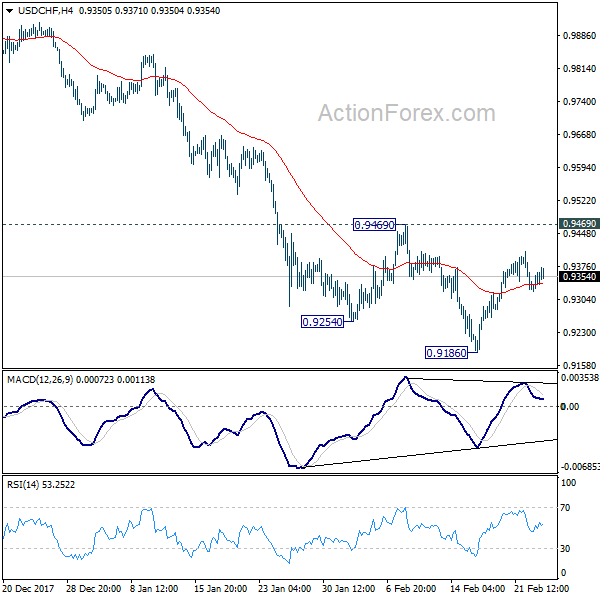
USD/CHF stayed in consolidation above 0.9186 last week and outlook is unchanged. Initial bias remains neutral this week first. With 0.9469 resistance intact, deeper fall is still expected. On the downside, break of 0.9186 will extend the larger down trend to 0.9115 medium term projection level next. However, considering bullish convergence condition in 4 hour MACD, break of 0.9469 will indicate near term reversal and turn outlook bullish for 55 day EMA (now at 0.9533) and above.
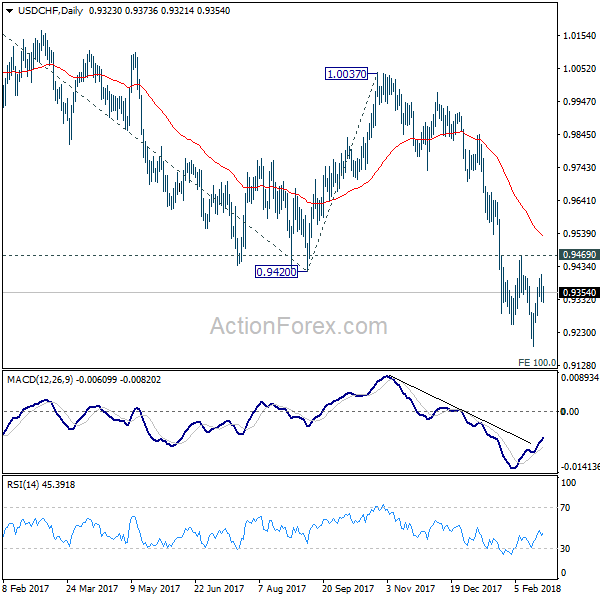
In the bigger picture, fall from 1.0342 is seen as a medium term down trend. Deeper decline should be seen to 100% projection of 1.0342 to 0.9420 from 1.0037 at 0.9115. Break will target 161.8% projection at 0.8545. In any case, sustained trading above 55 day EMA is needed to be the first sign of medium term reversal. Otherwise, outlook will stay bearish even in case of strong rebound.
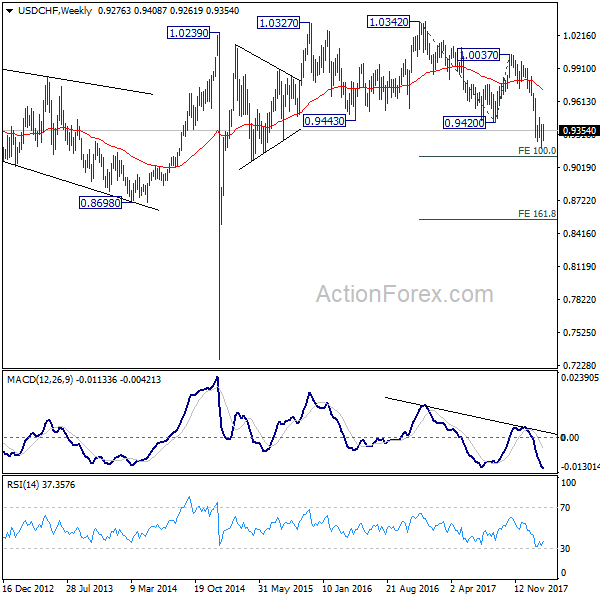
In the long term picture, the strong break of 0.9420 support and downside acceleration turns the long term outlook rather bearish. Corrective rebound from 0.7065 (2011 low) could have already completed at 1.0342. 0.8698 support will be a key level to watch. Sustained break there could bring retest of 0.7065.
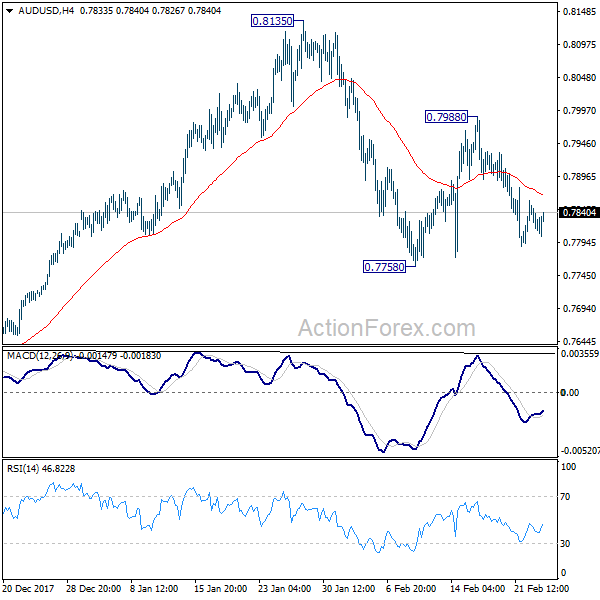
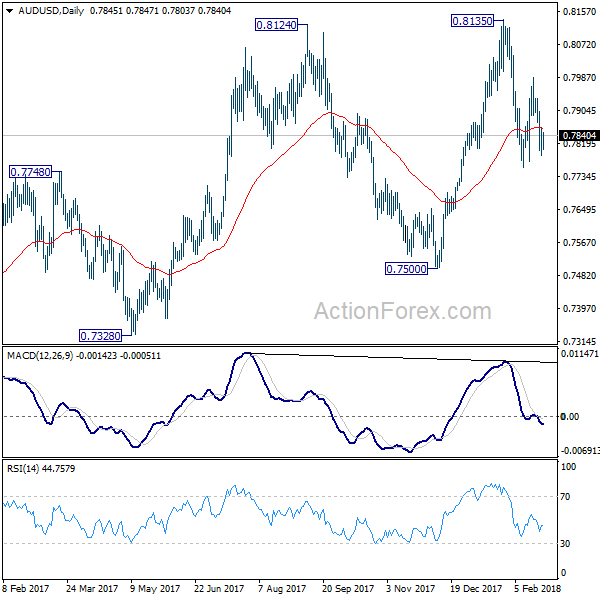
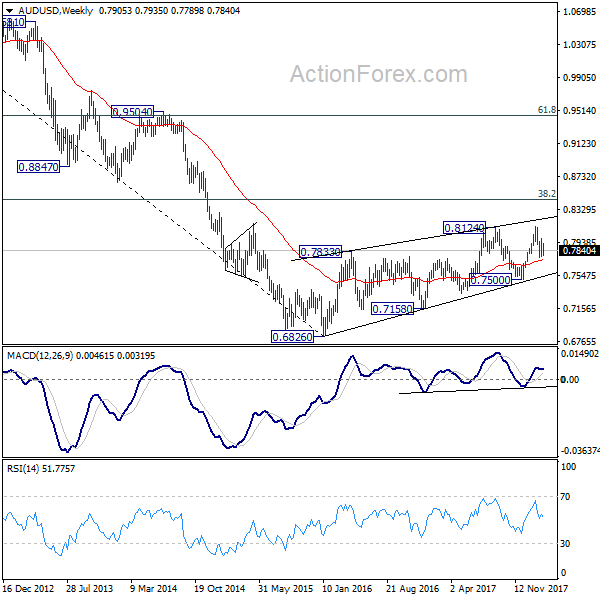
AUD/USD Weekly Outlook
AUD/USD stayed in range of 0.7758/7988 last week and outlook is unchanged. Initial bias remains neutral this week first. On the upside, above 0.7988 will extend the rebound to retest 0.8135. On the downside, below 0.7758 will resume the fall from 0.8135 and target 0.7500 key near term support. At this point, there is no strong case for a range breakout yet and 0.7500/8135 could hold for a while.
In the bigger picture, medium term rebound from 0.6826 is seen as a corrective move. It might still extend higher but we'd expect strong resistance from 38.2% retracement of 1.1079 to 0.6826 at 0.8451 to limit upside to bring long term down trend resumption. On the downside, break of 0.7500 support will now be an important signal that such corrective rebound is completed.
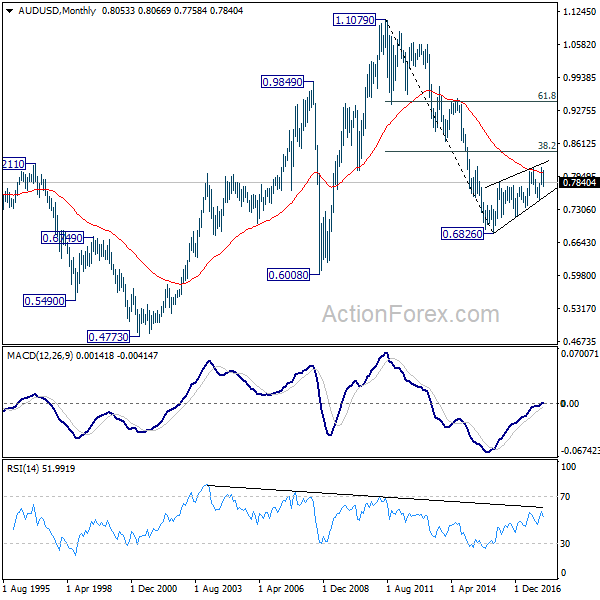
In the longer term picture, 0.6826 is seen as a long term bottom. Rise from there could either reverse the down trend from 1.1079, or just develop into a corrective pattern. At this point, we're favoring the latter. And, as long as 38.2% retracement of 1.1079 to 0.6826 at 0.8451 holds, we'd anticipate another decline through 0.6826 at a later stage. But strong support should be seen between 0.4773 (2001 low) and 0.6008 (2008 low).
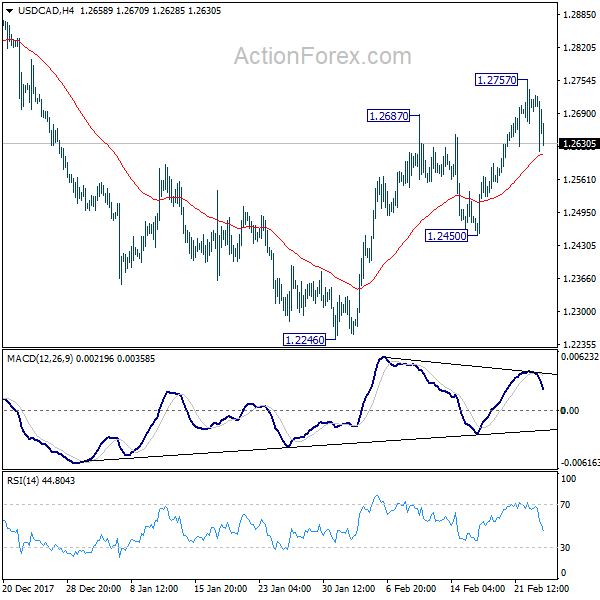
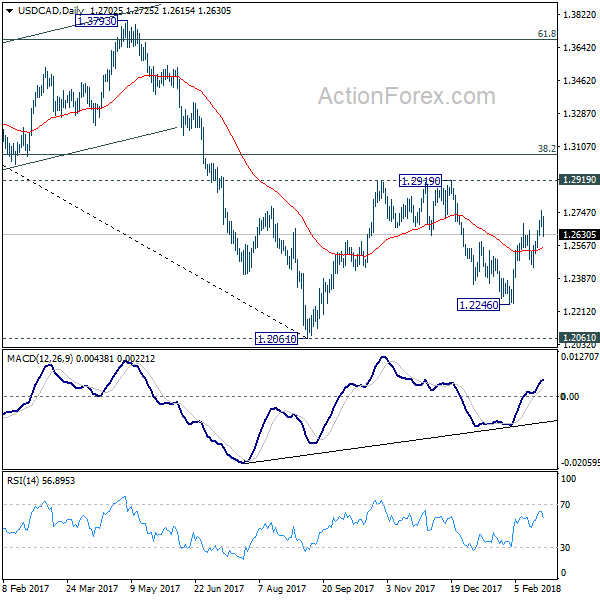
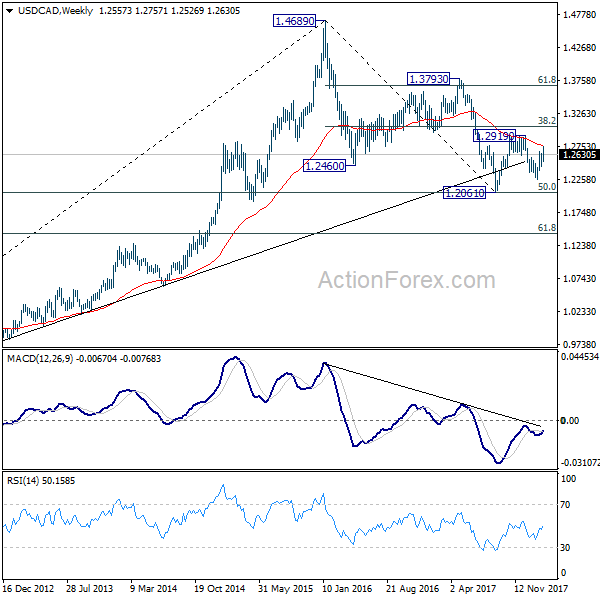
USD/CAD Weekly Outlook
USD/CAD rebounded to as high as 1.2757 last week but lost momentum since then. Initial bias remains neutral this week first. Above 1.2757 will target a test on 1.2919 key resistance. We'd be cautious on strong resistance from there to limit upside. On the downside, below 1.2450 will turn bias back to the downside for 1.2246 support.
In the bigger picture, the rebound from 1.2246 is mixing up the medium term outlook. Nonetheless, USD/CAD is staying below falling 55 week EMA (now at 1.2771), hence, the bearish case is in favor. That is, fall from 1.4689 is not completed yet. Sustained break of 1.2061 key support will carry larger bearish implication and target 61.8% retracement of 0.9406 to 1.4689 at 1.1424. However, firm break of 1.2919 will revive the case of medium term reversal and turn outlook bullish.
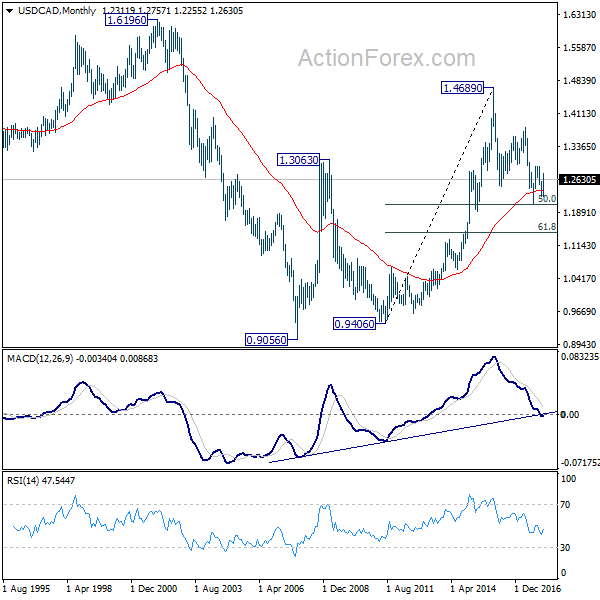
In the longer term picture, 50% retracement of 0.9406 (2011 low) to 1.4689 (2015 high) at 1.2048 remains a key support level to watch. As long as this level holds, we'll treat fall from 1.4689 as a correction and expect another rally through this level. However, sustained break of 1.2048 will turn favors to the case that rise from 0.9056 (2007 low) is a three wave corrective move that's completed at 1.4689. And retest of 0.9056/9406 support zone could be seen in medium to long term.
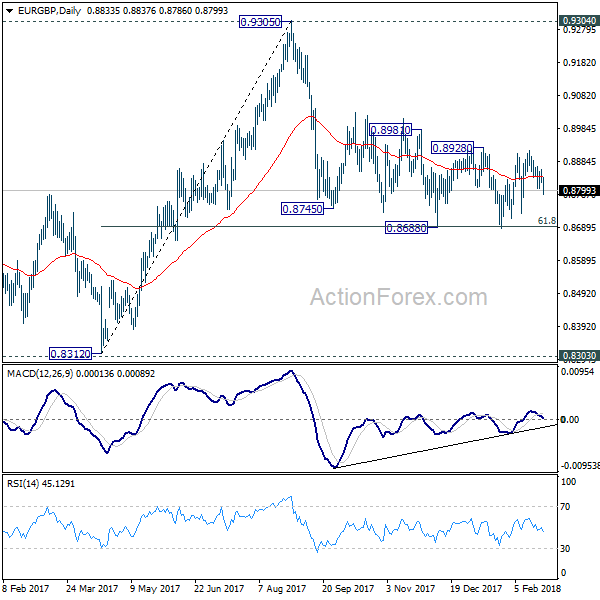
EUR/GBP Weekly Outlook
EUR/GBP's sideway trading continued last week, inside range of 0.8686/8928. Initial bias remains neutral this week first. Also, outlook stays mildly bearish with 0.8928 resistance intact. On the downside, firm break of 0.8686 will resume whole decline from 0.9305. As 61.8% retracement of 0.8312 to 0.9305 should then be taken out too, deeper decline would be seen to retest 0.8303/8312 support zone. Nonetheless, on the upside, break of 0.8928 will indicate near term reversal and turn outlook bullish for 0.9304 resistance.
In the bigger picture, there are various ways to interpret price actions from 0.9304 high. But after all, firm break of 0.9304/5 is needed to confirm up trend resumption. Otherwise, range trading will continue with risk of deeper fall. And in that case, EUR/GBP could have a retest on 0.8303. But we'd expect strong support from 0.8116 cluster support (50% retracement of 0.6935 to 0.9304 at 0.8120) to contain downside.
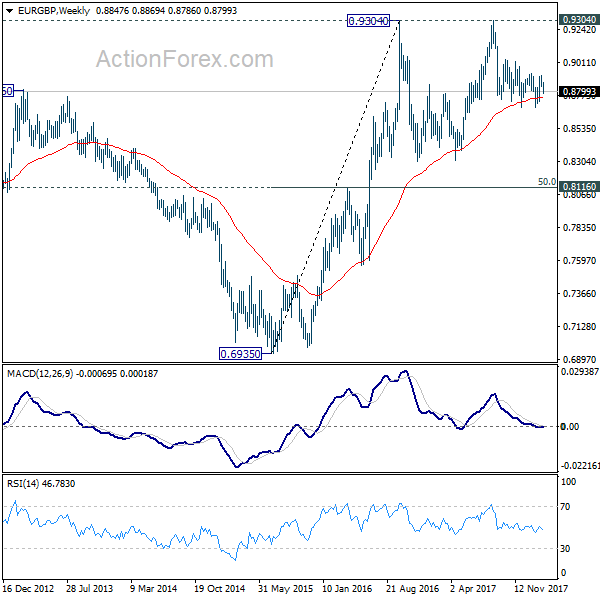
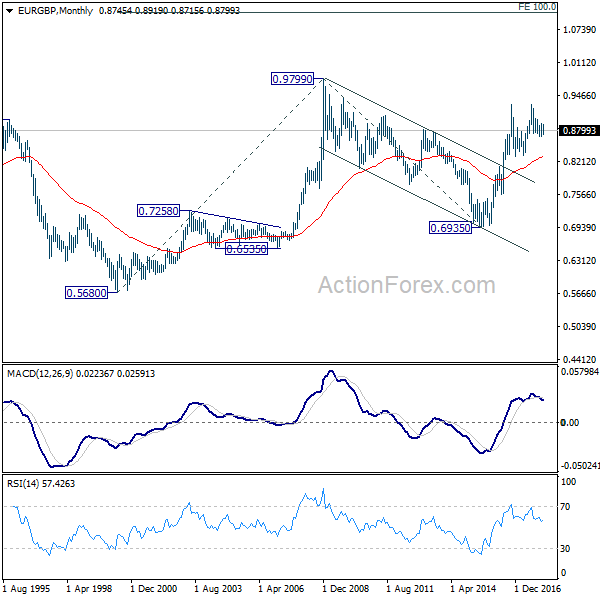
In the long term picture, we're holding on to the view that rise from 0.6935 (2015 low) is resuming the up trend from 0.5680 (2000 low). Hence, after the consolidation from 0.9304 completes, we'd expect another medium term up trend through 0.9799 to 100% projection of 0.5680 to 0.9799 from 0.6935 at 1.1054.

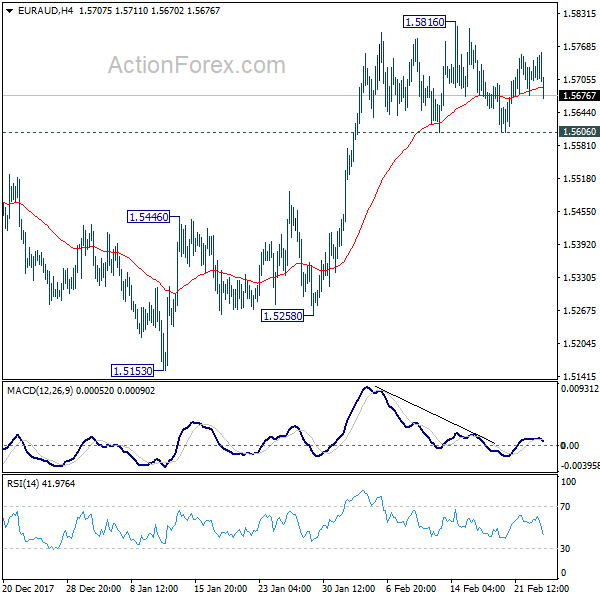
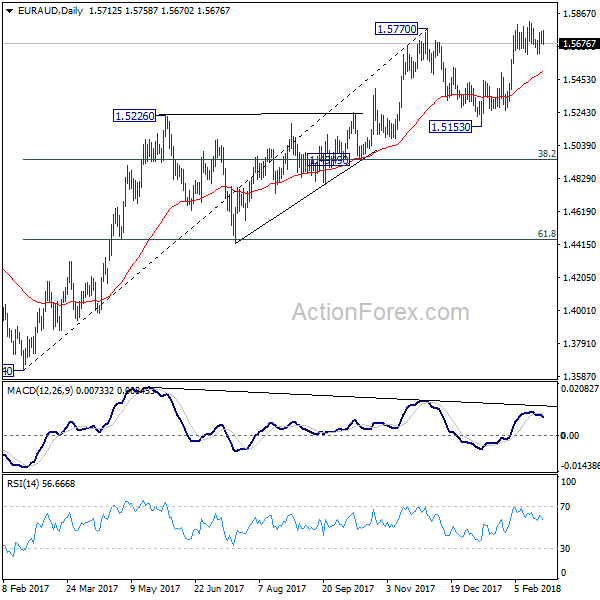
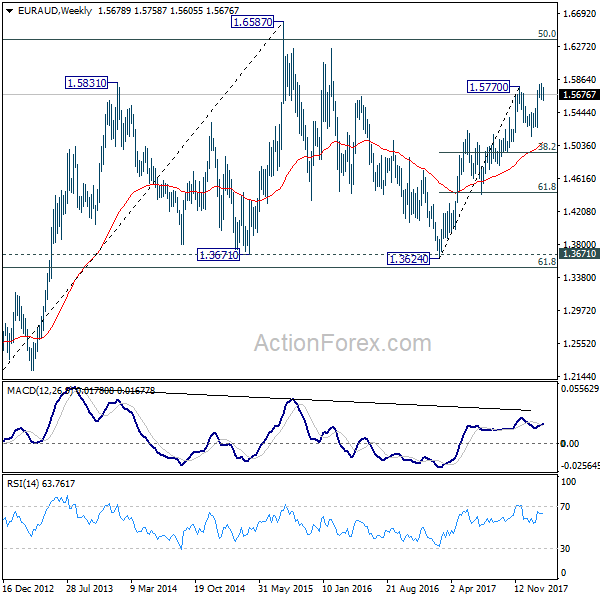
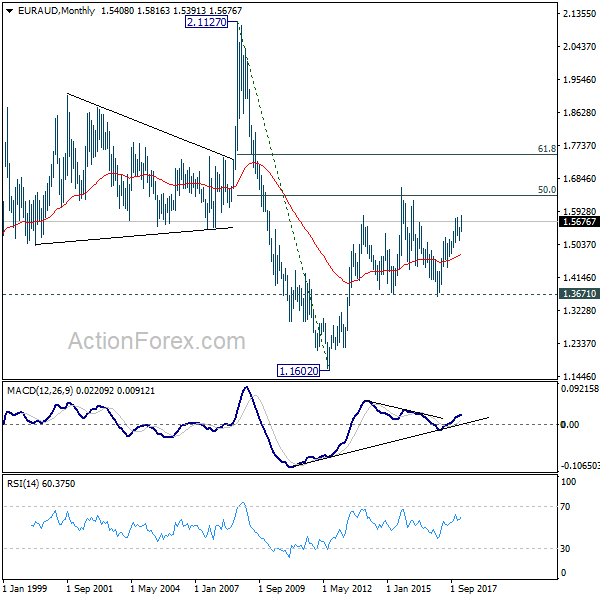
EUR/AUD Weekly Outlook
EUR/AUD stayed in consolidation below 1.5816 last week and outlook is unchanged. Initial bias remains neutral this week first. Also, near term outlook stays cautiously bullish as long as 1.5606 support holds. Break of 1.5816 should now confirm resumption of medium term rise from 1.3264. In that case, EUR/AUD should target 1.6587 key long term resistance. Meanwhile, firm break of 1.5606 will argue that a short term top is formed. Intraday bias will be turned back to the downside for 55 day EMA (now at 1.5501) and below.
In the bigger picture, medium term rise from 1.3624 is not completed yet. Sustained break of 1.5770 will extend the rise to retest 1.6587 (2015 high). However, considering bearish divergence condition in daily MACD, break of 1.4949 cluster support (38.2% retracement of 1.3624 to 1.5770 at 1.4950) will indicate medium term reversal. And there is prospect of retesting 1.3624 low in that bearish case.
In the longer term picture, the rise from 1.1602 long term bottom (2012 low) isn't over yet. We'll keep monitoring the development but there is prospect of extending the rise to 61.8% retracement of 2.1127 to 1.1602 at 1.7488 and above. However, sustained trading below 1.3671 should indicate long term reversal and target 1.1602 long term bottom again.
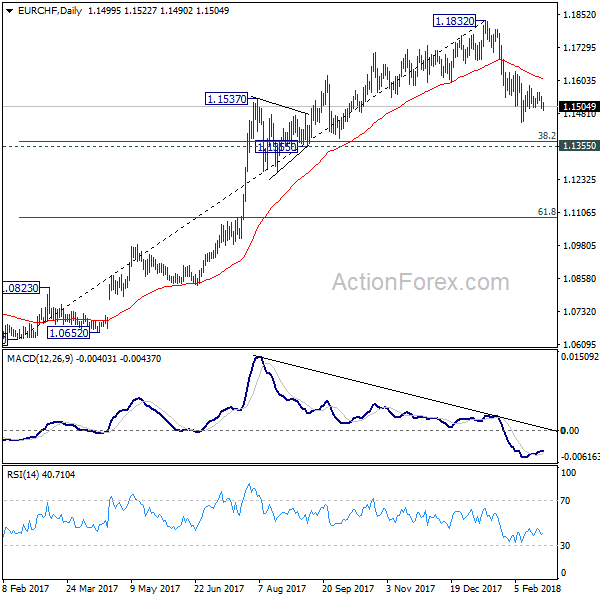
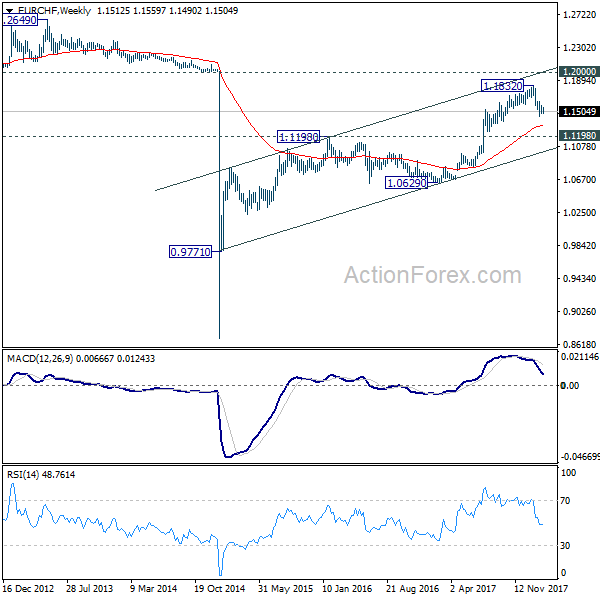
EUR/CHF Weekly Outlook
EUR/CHF stayed in consolidation from 1.1445 last week and outlook is unchanged. Initial bias remains neutral this week first. Also, outlook remains bearish with 1.1639 resistance intact and deeper decline is expected. Break of 1.1445 will resume the corrective fall from 1.1832 and target 1.1355 cluster support (38.2% retracement of 1.0629 to 1.1832 at 1.1372.) At this point, we'd expect strong support from there to contain downside and bring rebound.
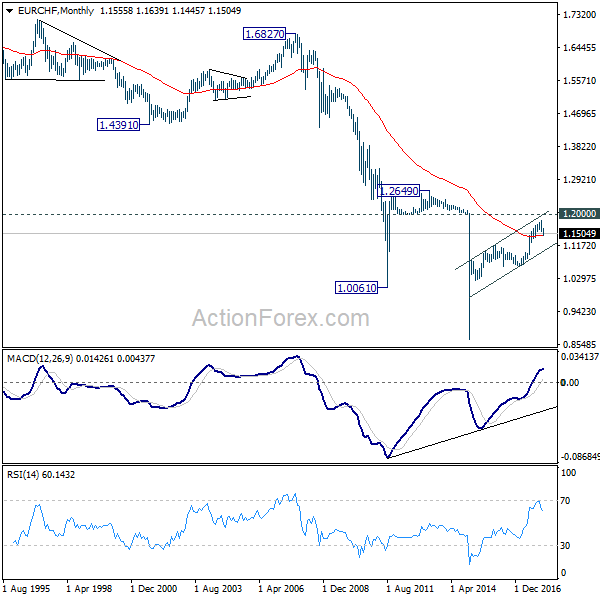
In the bigger picture, a medium term top should be in place at 1.1832 on bearish divergence condition in daily MACD. But there is no indication of long term reversal yet. As long as 1.1198 resistance turned support holds, we'd still expect another rise through prior SNB imposed floor at 1.2000.
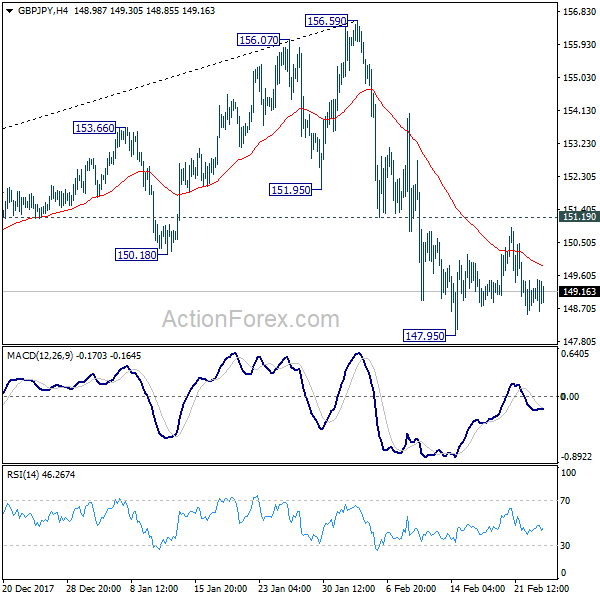
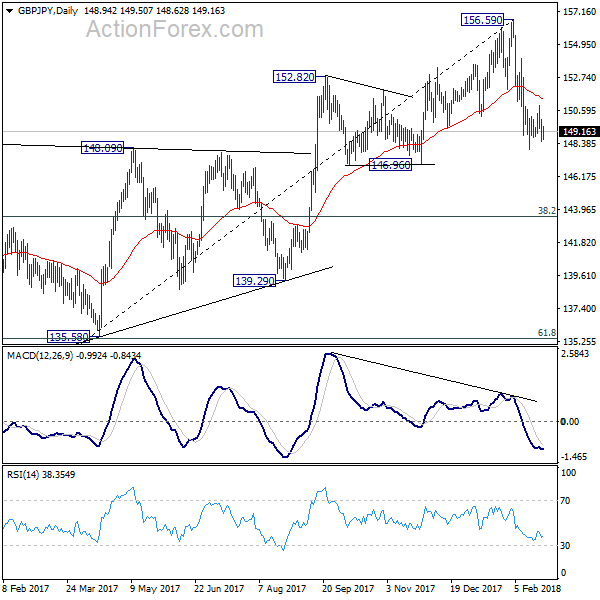
GBP/JPY Weekly Outlook
GBP/JPY stayed in consolidation above 147.95 last week and outlook is unchanged. Initial bias remains neutral this week first. Also, outlook remains bearish with 151.19 resistance intact and deeper decline is expected. Below 147.95 will resume the fall from 156.59 and target 146.96 support next. Considering bearish divergence condition in daily MACD, firm break of 146.96 will be another sign of medium term trend reversal. On the upside, break of 151.19 will indicate short term bottoming and turn bias back to the upside for rebound.
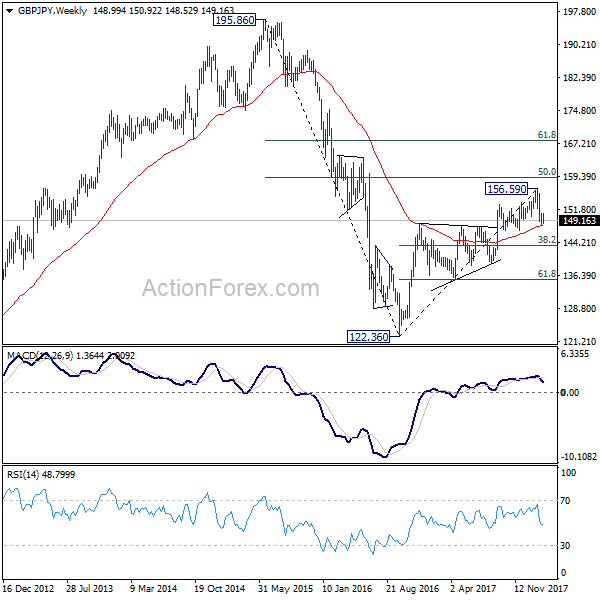
In the bigger picture, the case for medium term reversal continues to build up on loss of medium term momentum as seen in weekly MACD. Also, firm break of 146.96 will indicate rejection by 55 month EMA (now at 154.60) and add to that case of reversal. In that case, deeper fall would be seen to 38.2% retracement of 122.36 to 156.59 at 143.51 and then 61.8% retracement at 135.43. Meanwhile, break of 156.59 will extend the rise from 122.36 to 61.8% retracement of 195.86 to 122.36 at 167.78.
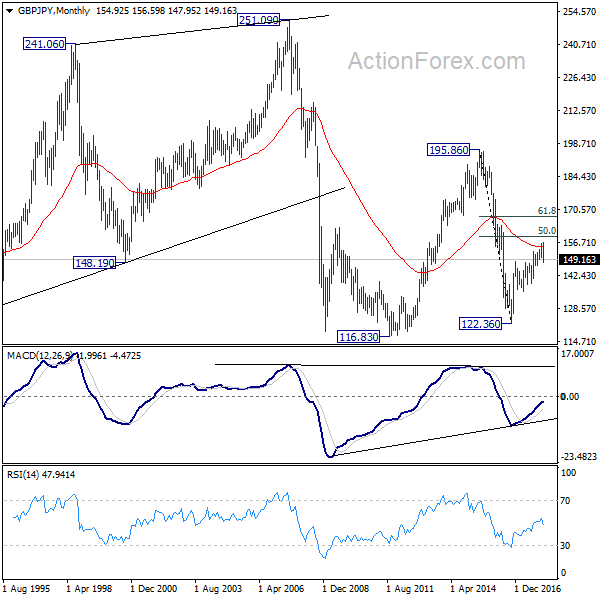
In the longer term picture, down trend from 195.86 (2015 high) has already completed at 122.36. Focus is now on 55 month EMA (now at 154.60). Firm break there will suggest that rise from 122.36 is developing into a long term move that targets 195.86 again. And, price actions from 116.83 (2011 low) is indeed a sideway pattern that could last more than a decade. However, rejection from the 55 month EMA will turn focus back to 122.36 low.
EUR/JPY Weekly Outlook
EUR/JPY dropped to as log as 130.29 last week. The development should now confirm medium term topping at 137.49, on bearish divergence condition in daily MACD. Initial bias is remains on the downside for 126.61 medium term fibonacci level next. On the upside, break of 133.05 resistance is needed to confirm short term bottoming. Otherwise, outlook will remain bearish in case of recovery.
In the bigger picture, current development argues that rise from 109.03 has completed at 137.49, on bearish divergence condition in weekly MACD. Deeper fall should be seen to 38.2% retracement of 109.03 to 137.49 at 126.61 first. On the upside, break of 137.49 is needed to confirm medium term rise resumption. Otherwise, risk will now stay on the downside even in case of strong rebound.
In the long term picture, at this point, EUR/JPY is staying in long term sideway pattern. established since 2000. Rise from 109.03 is seen as a leg inside the pattern. As long as 124.08 support holds, further rally is in favor in medium to long term through 149.76 high. However, break of 124.08 could extend the fall through 109.03 low instead.
Dollar Rebound Lacks Conviction for Trend Reversal
Dollar ended last week as the strongest major currency Fed communications solidified the case for three hikes this year. Nonetheless, as pointed out a few times, the greenback was held below key near term resistance levels against others and there is no change in its bearish outlook yet. Stocks continued to stabilize in tight rang and Friday's rally in DOW argues that the rebound from the spike low earlier this month might be ready to resume soon. 10 year yield attempted to rise but felt heavy ahead of psychological level at 3%. Elsewhere in the currency markets, Sterling and Yen were the second and third strongest for the week. Kiwi, Euro, Aussie and Swissy were the weakest.
Case for three Fed hikes solidified, but not more
Fed's monetary policy report released on Friday was seen as a prelude to new Fed Chair Jerome Powell's semi-annual testimony to Congress next week. The report delivered nothing new to the markets, which suggests that Powell is unlikely to tell us anything new neither. Unemployment rate at 4.1% showed the economy was near to or even a bit beyond full employment. Inflation is expected to be around or a little below the 2% target throughout 2018.
Released earlier in the week, minutes of the January 30-31 FOMC meeting showed "a majority of participants noted that a stronger outlook for economic growth raised the likelihood that further gradual policy firming would be appropriate. Also, there are "upside risks" to growth because of the tax cuts. Meanwhile, "almost all participants" expected inflation to move up to the 2% target over the "medium term".
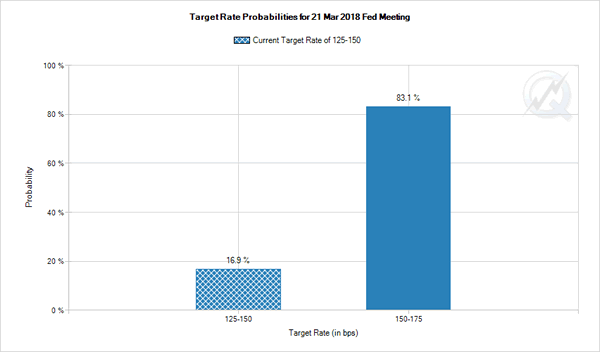
All in all, the releases solidify the case for Fed to hike three times this year. Fed fund futures are pricing in 83.1% change on a 25bps hike in March. However, while there are speculations Fed could raise interest rates one more time, neither the minutes nor the report give any indication on it. That's a key for the loss in momentum in 10 year yield last week, as well as the rebound in stocks on Friday.
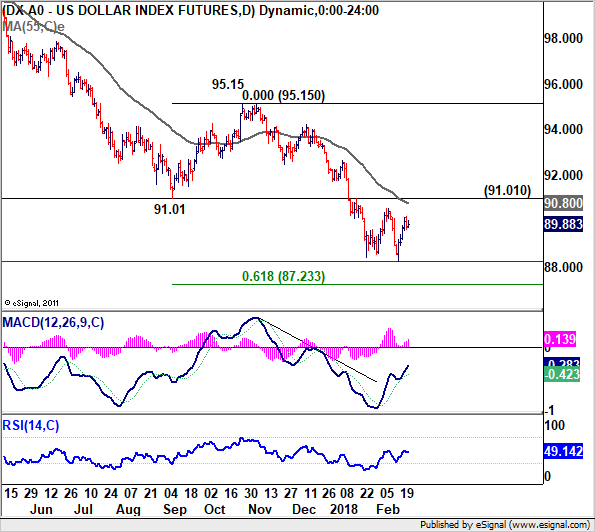
Dollar index still technically bearish
We'd mentioned a couple of times last week that while Dollar was firm, the rebound is seen as a corrective move at best for the moment. Major dollar pairs were kept in recently established range and there is no confirmation of trend reversal yet. Dollar index could be drawing support from 50% retracement of 72.69 (2011 low) to 103.82 (2017 high) at 88.25. But so far, it's limited below 91.01 support turned resistance, as well as falling 55 day EMA (now at 90.80). Further decline is still expected to next fibonacci level at 61.8% retracement at 84.58 in medium term. Nonetheless, firm break of 91.01 will be the first signal of trend reversal and will turn focus back to 95.15 key resistance for confirmation.
Euro ended lower on a couple of factors
Euro, on the other hand, ended as the second weakest one last week on a couple of factors. Firstly, data released argue that growth in Eurozone could be past its acceleration phase. German ZEW dropped from 20.4 to 17.8 in February. Ifo business climate dropped from 117.6 to 115.4. Eurozone PMI manufacturing dropped from 59.6 to 58.5. PMI services dropped from 58.0 to 56.7. Make no mistakes that these were still solid numbers. But the mild cooling of the economy would give fewer reasons for ECB to end its stimulus program earlier.
Talking about ECB, minutes of the January meeting were a disappointment to Euro bulls. The minutes showed that "changes in communication were generally seen to be premature at this juncture, as inflation developments remained subdued despite the robust pace of economic expansion." The central bank is not even ready to drop the option to extend the asset purchase program after it expires in September.
Some cited political uncertainties as another factor in Euro's weakness. In particular, two important events will fall on next Sunday March 4. Firstly, Italy will hold the national election. Political fragmentation, just like other parts of Europe, could lead to indecisive results and a hung parliament. Secondly, over 450k German SPD members are voting on the grand coalition with Chancellor Merkel's CDU/CSU. The results will also be released on March 4.
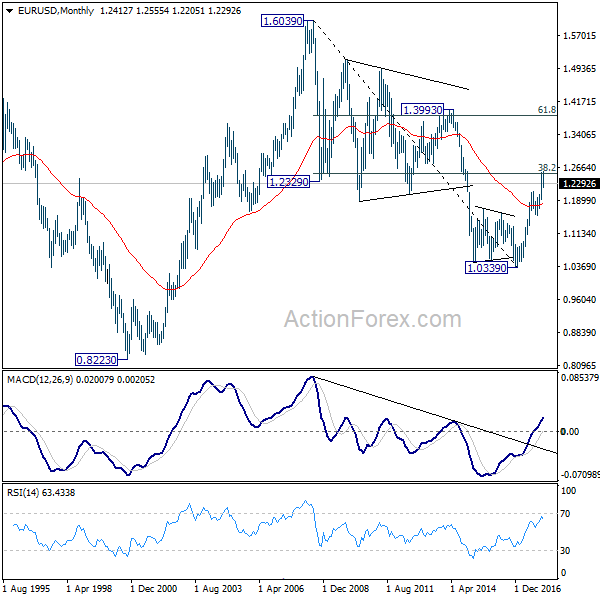
In our view, the technical development in EUR/USD was probably the most important factor among all. It's pressing the key long term fibonacci level at 38.2% retracement of 1.6039 (2008 high) to 1.0339 (2017 low) at 1.2516. Fresh inspiration is needed to push the pair through this key level decisively. Or, Euro could suffer a deeper pull back when the bulls start to get impatient.
Position trading strategy
Our GBP/CHF short (sold at 1.3105) was stopped out at break-even last week as the cross recovered to 1.3120. The forex markets are basically in consolidation mode and there is no clear trend for the near term yet. We'll keep our hands off during the last week of February and reassess the opportunities next week.
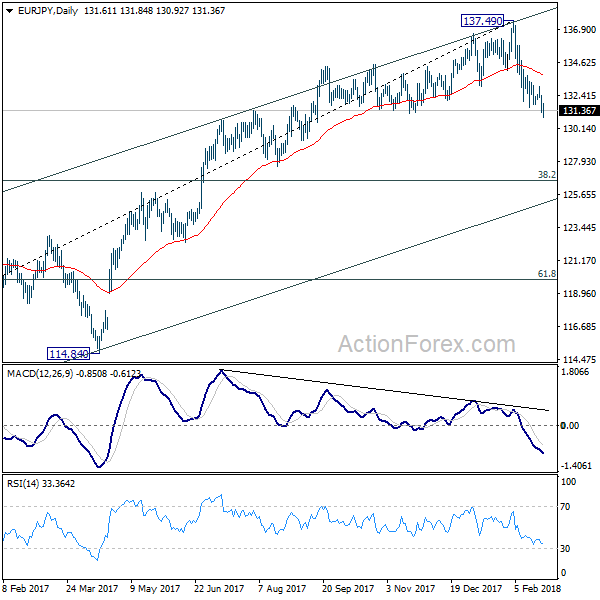
EUR/JPY Weekly Outlook
EUR/JPY dropped to as log as 130.29 last week. The development should now confirm medium term topping at 137.49, on bearish divergence condition in daily MACD. Initial bias is remains on the downside for 126.61 medium term fibonacci level next. On the upside, break of 133.05 resistance is needed to confirm short term bottoming. Otherwise, outlook will remain bearish in case of recovery.
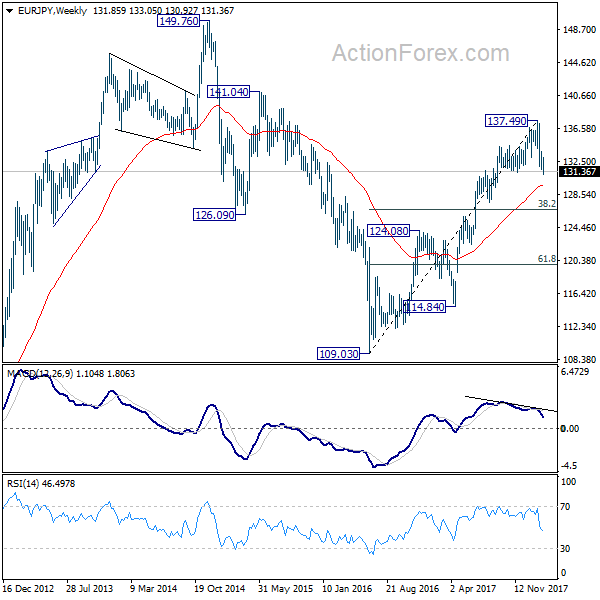
In the bigger picture, current development argues that rise from 109.03 has completed at 137.49, on bearish divergence condition in weekly MACD. Deeper fall should be seen to 38.2% retracement of 109.03 to 137.49 at 126.61 first. On the upside, break of 137.49 is needed to confirm medium term rise resumption. Otherwise, risk will now stay on the downside even in case of strong rebound.
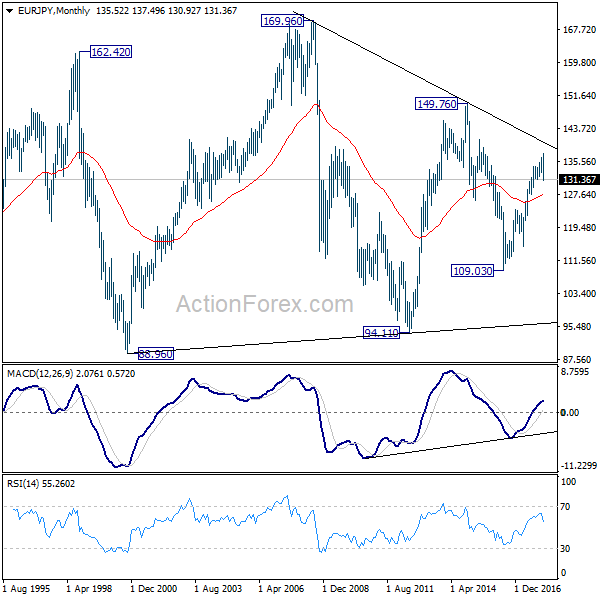
In the long term picture, at this point, EUR/JPY is staying in long term sideway pattern. established since 2000. Rise from 109.03 is seen as a leg inside the pattern. As long as 124.08 support holds, further rally is in favor in medium to long term through 149.76 high. However, break of 124.08 could extend the fall through 109.03 low instead.