Sample Category Title
USD Stays Weak Despite Upbeat Inflation
Consumer prices in the United States were seen rising stronger than expected in the month of January. Despite the upbeat figures, the U.S. dollar turned weaker on the day. Headline CPI rose 0.5% on the month beating estimates and rising to an annual pace of 2.1% while core CPI increased 0.3% on the month for an annual gain of 1.8%.
However, the upbeat data was offset by soft retail sales which fell 0.3% in January. The hourly earnings data also showed an increase of 0.8% in January up from December's revised 0.6% increase.
Elsewhere, the Swedish central bank was seen holding its monetary policy unchanged at -0.50% at its meeting yesterday. The central bank signaled that it would hike interest rates in the second half of 2018 while downgrading its inflation forecasts.
Looking ahead the ECB's Chief economists Peter Praet will be speaking at a panel discussion today. Data from the U.S. will see the producer prices numbers coming out for January. This will be followed by the regional manufacturing index data.
The Rally Continues Despite Higher US Inflation Data | Gold And Oil Hold Steady
Strong US Inflation and soft retail makes the dollar weak
Saudi oil ministers fuelled the bull rally once again
Precious metal looks strong from technical perspective
European markets and US futures are staring the day on a positive note as investors have shrugged off the concerns that the Fed would adopt any aggressive stance towards their monetary policy. The inflation data released over in the US was hot and it was better than the forecast. The text book trade, higher dollar on the back of better inflation number, wasn’t able to last long as investors started to factor in other aspects.
The US CPI number released yesterday printed the reading of 2.1% against the forecast of 1.9%. The signal that rising ISM prices could have an impact on the CPI number, did filter through and stamp of that was all over the reading. However, what saved the day for investors was the retail sales number which came below the forecast.
A soft retail number simply gives the message that consumers have started to ease off from their spending or they are not digging deep into their pockets. A sensible approach would be that the Fed isn’t going to increase the interest rate when they can clearly see that the retail data was soft. However, one factor which has become acute after the dust settled from yesterday’s economic reading is that the March interest rate hike is pretty much a done deal. Again, it only looks like that it is a done deal for now, because if we get a soft readings from the US NFP, the game could change.
As for the commodity market, comments from the Saudi oil ministers fuelled the bull rally once again. Saudi Arabia clearly has a more interest in keeping the oil price higher than any other country right now because of its gigantic IPO of Armco. The Saudi oil minister made traders happy by announcing that Saudi Arabia prefers an undersupplied oil market and it is not likely that the country would turn its back to keep the production down. The dollar weakness is another reason that we are seeing the recovery in the commodity metal today.
Precious metal looks strong from technical perspective especially when you pull up the daily chart. The precious metal is holding steady on Thursday thanks to the US data. The inflation data hasn’t changed the matrix and there is no change in the odds for the Fed to increase the interest much faster than previously thought. Gold is using its both plays; inflation hedge and safe haven. Higher inflation calls for an inflation hedge trade and aggressive stance adopted by the Fed for their monetary policy triggers the safe haven trade. So it is more of a win and win scenario.
DAX30: The Price Has Reached An Important Zone
The DAX30 has been in a steady uptrend. We can see a cluster of resistance that makes for a POC zone ( W H3, D H3, channel top, historical sellers) 12500-12510 is the zone and we could see a bearish reversal candlestick configuration that might turn the price down. If the price is rejected, watch for 12400. Clear break below should target 12367, 12299 and 12197. However if the price proceeds and makes 1h momentum candle or 4h close above 12510. we might see 12606 and eventually 12783 by Friday. Weekly H3 resistance is the most important level now.
W H3 -Weekly Camarilla Pivot (Weekly Interim Resistance)
W L3 - Weekly Camarilla Pivot (Weekly Interim Support)
W H3 - Weekly Camarilla Pivot (Weekly Interim Resistance)
W H4 - Weekly Camarilla Pivot (Strong Weekly Resistance)
D H4 - Daily Camarilla Pivot (Very Strong Daily Resistance)
D L3 – Daily Camarilla Pivot (Daily Support)
D L4 – Daily H4 Camarilla (Very Strong Daily Support)
POC - Point Of Confluence (The zone where we expect price to react aka entry zone)
Forex Technical Analysis: EUR/USD, USD/JPY, GBP/USD
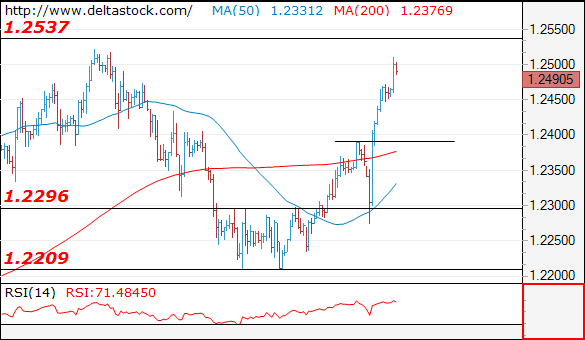
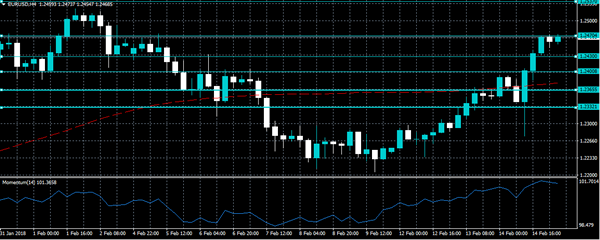
EUR/USD
Current level - 1.2490
The sharp reversal at 1.2270 led to a break through 1.2390 peak and currently the pair is heading for a test of 1.2540 peak. Initial pullback is expected, to 1.2390 area.
| Resistance | Support | ||
| intraday | intraweek | intraday | intraweek |
| 1.2540 | 1.2540 | 1.2460 | 1.2210 |
| 1.2540 | 1.2870 | 1.2390 | 1.2090 |
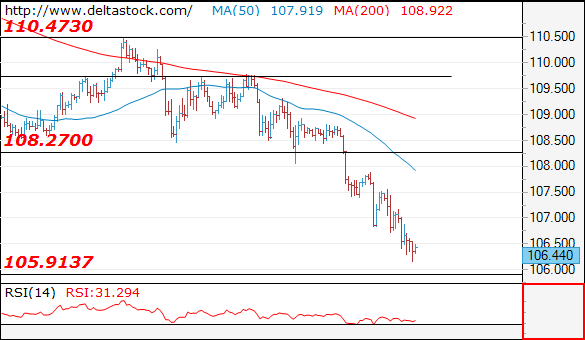
USD/JPY
Current level - 106.44
The bias remains bearish, for a slide to 105.90-40 area. Crucial on the upside is 107.50.
| Resistance | Support | ||
| intraday | intraweek | intraday | intraweek |
| 107.50 | 111.90 | 105.90 | 105.90 |
| 109.70 | 113.40 | 105.40 | 105.40 |
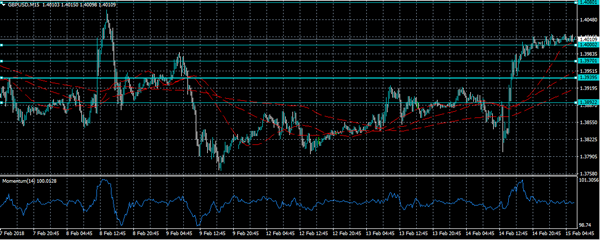
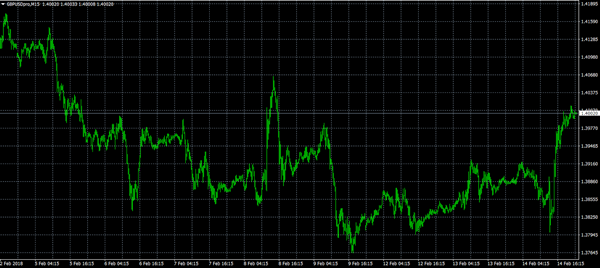
GBP/USD
Current level - 1.4055
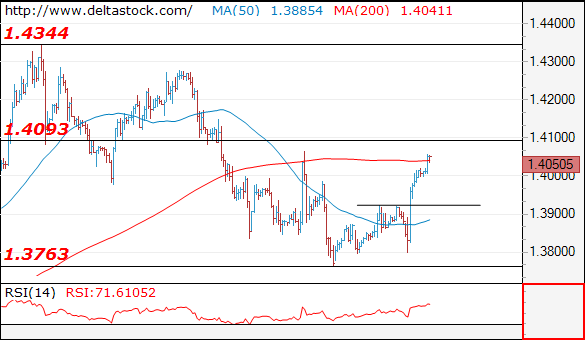
The break through 1.3920 points to another test of 1.4090 hurdle and an eventual break through the later will challenge 1.4280. Initial intraday support lies at 1.3920.
| Resistance | Support | ||
| intraday | intraweek | intraday | intraweek |
| 1.4090 | 1.4280 | 1.3920 | 1.3760 |
| 1.4175 | 1.4340 | 1.3760 | 1.3620 |
Technical Outlook: USDJPY Hits New 15-Mth Low On Break Through Key Point At 106.51
The pair remains firmly in red on Thursday and broke below key support at 106.51 (Fibo 61.8% of 98.99/118.66, Jun/Dec 2016 rally), extending losses to new 15-month low at 106.17, posted in early hours of European session. Clear break below 106.51 will be strong bearish signal and will confirm an end of broader longs, shifting longer-term bias to the downside. Fresh risk appetite pushed the dollar lower and boosted stocks which works in favor of bearish scenario, activated on break below main bull-trendline from Oct 2012 low at 77.12 and probe below 106.51 pivot. Close below 106.51 would open way for stronger bearish acceleration as no technical obstacles are seen on weekly chart until 103.63 (Fibo 76.4% of 98.99/118.66 rally). However, bears may be obstructed by oversold conditions on daily chart, which could result in consolidation before bears resume. Former lows and key supports at 107.31 (08 Sep) and 108.28 (108.11 (17 Apr 2017) mark solid barriers which should limit upticks.
Res: 106.51, 107.00, 107.31, 107.90
Sup: 106.17, 105.57, 105.00, 104.50
Technical Outlook: GBPUSD – Fresh Risk Aversion Inflates Pound, Bulls Focus 1.4066/81, Post-BoE High/Fibo 61.8% Barrier
Fresh bullish acceleration in early European trading broke above 20SMA (1.4021) and probes above 1.4056 (4-hr cloud top) for retest of 1.4066 ( high posted after last week's post-BoE's hawkish hold announcement). Cable remains firm on fresh risk appetite that sent stocks higher and increased pressure on US dollar. Wednesday's close above psychological 1.40 barrier was bullish signal, with big bullish daily candle with long tail underpinning. Bullish setup of daily studies supports but still lacking stronger momentum, which could obstruct bulls. Firm break above 1.4066 and 1.4081 (Fibo 61.8% of 1.4277/1.3764) is needed for fresh bullish signal for extension of recovery leg at 1.3764 (09 Feb low). Broken 20SMA offers immediate support at 1.4021 with 1.40 handle expected to ideally hold and deeper dips to be contained by 10SMA (1.3940) to keep bullish stance intact.
Res: 1.4066, 1.4081, 1.4156, 1.4200
Sup: 1.4021, 1.4000, 1.3974, 1.3940
Elliott Wave View: Gold Renew The Path To $1450
Gold Short-term Elliott Wave view suggests that the decline from January 25.2017 high (1365.96) to February 08.2018 low ended Minor wave X at 1306.96 low. After reaching the 100%-123.6% Fibonacci extension area of ((w))-((x)) at 1306.70-1297.49 area. When internals in Minor wave X unfolded as Elliott Wave Double Three Structure, where each leg had an internal distribution of 3-3-3 lower. Down from 1365.96 peak, Minute wave ((w)) ended 1327.24 low, Minute wave ((x)) ended at 1345.96 and Minute wave ((y)) of X ended on 1306.96 low.
Above from Minor wave X 1306.96 low, metal is expected to resume higher the rally in Minor wave Y higher targeting more upside in the metal towards 1450+ area to the upside. However, a break above 1365.96 high remains to be seen for final confirmation of next extension higher and until than double correction lower in Minor wave X dip can’t be ruled out yet. Near-term cycle from 1306.96 is expected to be unfolding as Elliott Wave Zigzag pattern and expected to see more upside towards 1365.67 area approximately to end the Minute wave ((a)) higher in 5 waves. Afterwards, metal should do a pullback in Minute wave ((b)) for the correction against 1306.96 cycle in 3, 7 or 11 swings before further upside extension is seen in the metal. We don’t like selling it and as far as a pivot from 1306.96 low remains intact during the dips yellow metal is expected to see more upside.
Gold 1 Hour Elliott Wave Chart
GBPUSD Strongly Bullish Above 1.4000
The British pound has moved sharply higher against the greenback, following much better than expected January CPI inflation figures from the American economy. The GBPUSD pair has now reclaimed the 1.4000 handle, after the U.S Consumer Price Index came in at 0.5 percent, which was better than the 0.3 percent the market had been expecting. Going forward, traders will look towards the key 1.4000 handle on sterling for further intraday direction and the 88.00 level on the U.S dollar index.
The GBPUSD pair remains intraday bullish whilst clearly trading above the 1.4000 level, further upside towards the 1.4080 and 1.4150 levels seems possible.
Should GBPUSD price-action start to trade below the 1.4000 level, we may see a correction back towards the 1.3980 and 1.3940 levels.
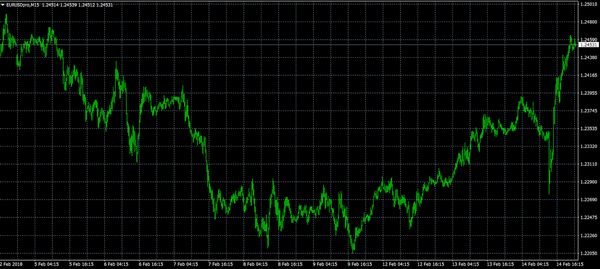
EURUSD Now Strongly Bullish Above 1.2430
The euro has surged higher against the greenback, with price-action now edging towards the 1.2500 handle, following much better than expected U.S inflation figures for the month of January. The EURUSD now trades well above the key 1.2430 level following a volatile U.S session, with the pair initially falling towards the 1.2300 level before later recovering to trade above the 1.2400 level. Moving into Thursday’s European trading session, the 1.2500 level becomes the key level to watch for further upside gains for the euro.
The EURUSD pair is strongly bullish whilst trading above the 1.2430 level, further upside towards 1.2500 and 1.2537 remains possible.
Should EURUSD price-action slip back below the 1.2430 level, we may see a correction back towards and 1.2400 and 1.2365 support levels.
US Data In The Headlines For Second Straight Day
The US economy will be front and centre on Thursday, with the economic calendar set to deliver a steady stream of market-moving reports. Eurozone data and monetary policy considerations are also expected to influence investor sentiment.
The day begins at 06:30 GMT with a report on French unemployment. Ninety minutes later, the Spanish government will release headline inflation figures for the month of January.
Monetary policy watchers will be keeping a close eye on a speech by Yves Mersch at 08:15 GMT. Mersch serves on the European Central Bank's Executive Board.
European trade data will dominate the headlines over the next hour, with the Italian government and Eurostat set to deliver official data releases. The Eurozone trade surplus is forecast to narrow slightly in December to €22.4 billion from €22.5 billion the month before.
Central bank governors Peter Praet and Sabine Lautenschlager are also scheduled to deliver speeches later in the day.
Shifting gears to North America, the US Labor Department will report on producer inflation and initial jobless claims in two separate reports at 13:30 GMT. The New York Federal Reserve Bank will also unveil the latest Empire State Manufacturing Index for February. Meanwhile, the Philadelphia Fed will also unveil its latest manufacturing survey at the same time.
The Federal Reserve will issue its monthly industrial production report at 14:15 GMT. The January reading is expected to show a 0.2% monthly increase, following a 0.9% gain the previous month.
Finally, the National Association of Home Builders (NAHB) are expected to unveil the housing market index at 15:00 GMT. The monthly report is expected to show strong demand for domestic real estate.
On the Canadian side of the border, ADP Inc. will report on private sector payrolls for the month of January.
EUR/USD
Europe's common currency rose sharply against the dollar on Wednesday, with the EUR/USD adding nearly % to trade at its highest level in over a week. The pair was last seen trading comfortably in the mid-1.2400 region, where it was eyeing the psychological 1.2500 resistance level. A clean move above 1.2520 is needed to ensure a bullish breakout for the euro.
GBP/USD
Cable also took advantage of a crumbling dollar Wednesday, surging 120 pips to retake the 1.4000 handle. The bulls are now eyeing the 1.4077 resistance area as the next major target. This level is attainable insofar as the dollar remains in a downtrend.
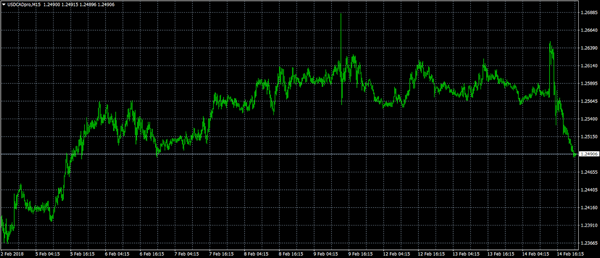
USD/CAD
The Canadian dollar broke sharply higher on Wednesday, with the USD/CAD plunging 100 pips. The pair traded below 1.2500 for the first time in a week, as the greenback continued to unwind its recent gains. The pair is now testing immediate support at 1.2494.