Sample Category Title
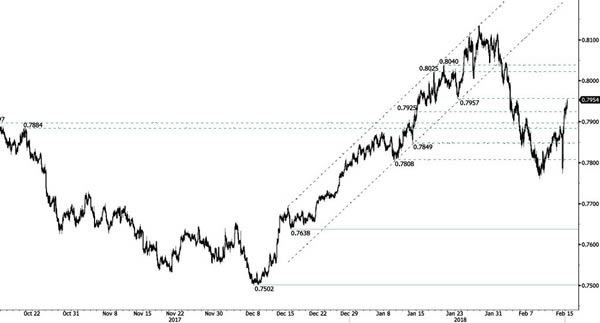
AUD/USD Reversing Pattern
AUD/USD quickly bounced back from 0.7773 (14/02/2018 low) and continues its hike above resistance at 0.7925 (12/01/2018), heading toward 0.80. Hourly support remains at 0.7638 (15/12/2017 low). The technical structure suggests further short-term upside moves.
In the long-term, the upward trend resumes after failing to reach key resistance at 0.8164 (14/05/2015 low). Key support stands at 0.6009 (31/10/2008 low). A break of the key resistance at 0.8164 (14/05/2015 high) is needed to invalidate our long-term bearish view.
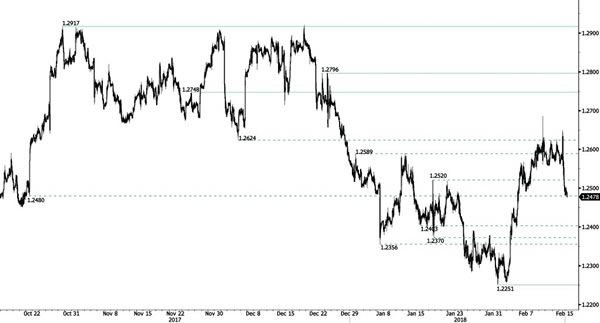
USD/CAD Downturn
USD/CAD is strongly decreasing following recent sideways trading. The pair broke support at 1.2480 (20/10/2017 low) and heads toward the range of 1.2450. Hourly resistance is maintained at 1.2748 (24/11/2017 high) and new support is given at 1.2251 (31/01/2018 low). The technical structure indicates that further short-term weakness is expected.
In the longer term, the pair is trading between resistance point at 1.3805 (05/05/2017 high) and support at 1.2128 (18/06/2015 low). Strong resistance is given at 1.4690 (22/01/2016 high). The pair is likely to head lower. The pairs is trading below its 200 DMA
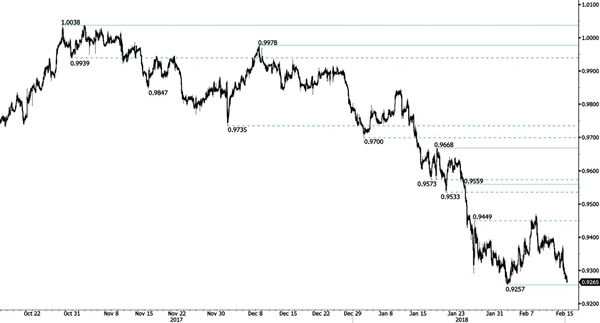
USD/CHF Decline
USD/CHF is weakening. The declining trend line remains intact, as resistance at 0.9257 (01/02/2018) has been broken. Heading toward 0.92. Hourly resistance stands at 0.9559 (24/01/2018 high) while further resistance remains at 0.9668 (17/01/2018 high).
In the long-term, the pair is still trading in range since 2011 despite some turmoil when the SNB unpegged the CHF. Support at 0.9259 (24/08/2015 low) is now reached. Key support remains at 0.9072 (07/05/2015 low) while resistance at 1.0344 (15/12/2016 high) is distanced. The technical structure favours a long term bullish bias since the unpeg in January 2015.
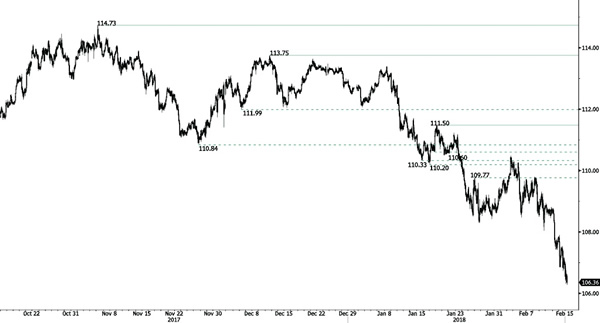
USD/JPY Failing To Bounce
USD/JPY is declining again under strong selling pressures, heading toward 106 range. Hourly resistances at 111.50 (18/01/2018) and 113.75 (12/12/2017 high) are further distanced. The technical structure suggests short-term downside moves.
We favor a long-term bearish bias. Support is given at 105.55 (03/05/2016 low). A gradual rise towards the major resistance at 125.86 (05/06/2015 high) seems unlikely. Expected to decline further support at 101.20 (09/11/2016 low).
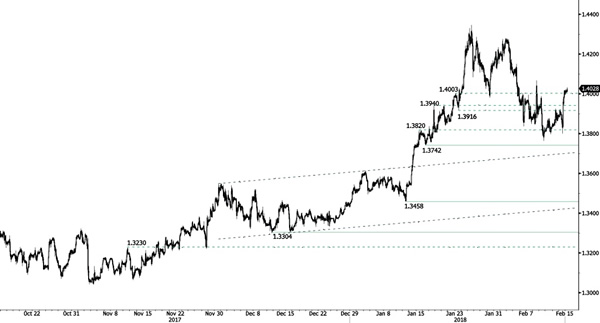
GBP/USD Strengthening
GBP/USD continues bouncing and trades between resistance at 1.4003 (23/01/2018 high) and support at 1.3742 (16/01/2018 low). The technical structure suggests further upside move.
The long-term technical pattern is reversing. The Brexit vote had paved the way for further decline but the pair is moving to 2016 highs. Long-term support and resistance are given at 1.1841 (07/10/2017 low) and 1.5018 (24/06/2016 high)
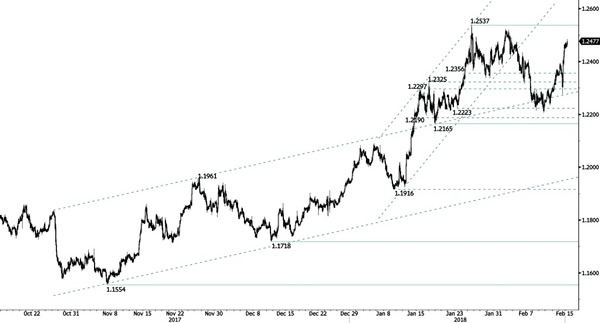
EUR/USD Overshooting
EUR/USD made a drastic rise, reaching the 1.25 range and heading toward 1.2537. Hourly resistance is now at 1.2537 (25/01/2018 high) while hourly support is maintained at 1.2165 (17/01/2018 low). The technical structure suggests further upside moves.
In the longer term, the momentum is turning largely positive. We favor a continued bullish bias. Key resistance is holding at 1.2886 (15/10/2014 high) while strong support lies at 1.1554 (08/11/2017 low).
Technical Outlook: WTI Oil Maintains Fresh Bullish Sentiment On Weak Dollar, Remarks From Saudi Arabia
WTI holds firm tone on Thursday and extends higher after strong rally on Wednesday when crude price was up 3%.
Fresh rally was sparked by EIA weekly crude stocks report which showed lower than expected build of crude inventories last week (1.84 vs forecasted build of 2.82 million barrels) and comments from Saudi Arabia, reaffirming its commitment to continue with reducing production in order to stabilize oil market, saying that would rather see an undersupplied market than end deal with OPEC and other major oil producers to reduce output.
Weaker dollar also supports oil price which bounced strongly from $58.06 zone, where a higher base has formed.
Strong recovery rally emerged above rising daily Ichimoku cloud after being stuck in the cloud for a couple of sessions and dented important barrier at $61.34 (Fibo 38.2% of $66.28/$58.06 pullback, reinforced by falling 10SMA.
Oil price started to regain traction after being under strong pressure in past two weeks, with extension and close above $61.34 pivot needed to maintain fresh bullish sentiment and generate positive signal for extension of recovery leg from $58.06 base.
Bullish scenario on repeated close above daily cloud top and firm break above $61.34 would open way for extension towards target at $62.35 (daily Kijun-sen).
Cloud top offers good support at $60.64 and is expected to contain and keep fresh bulls intact.
Res: 61.34, 61.53, 61.72, 62.35
Sup: 60.64, 60.00, 59.25, 59.00
Euro Rise Continues On Broad Dollar Weakness
The euro continues its upward movement and has posted gains in the Thursday session. Currently, the pair is trading at 1.2483, up 0.27% on the day. In the eurozone, the trade surplus continues to grow, climbing to EUR 23.8 billion. This beat the forecast of EUR 22.4 billion. It’s a busy day in the US, highlighted by PPI and Core PPI reports for January. Both indicators are expected to record gains after declining in the December readings. The US will also release key manufacturing reports and unemployment claims. On Friday, the US releases key housing and consumer confidence numbers.
The euro has posted winning sessions every day this week, and continues to move upwards on Thursday. The euro has gained 1.8% this week, and posted strong gains on Wednesday, after the US releases pointed to stronger inflation and dismal retail sales.
The US dollar remains under strong pressure after Wednesday’s CPI and retail sales reports. CPI jumped 0.5%, above the estimate of 0.3%. Consumer spending reports in January were dismal. Retail Sales was flat at 0.0%, short of the estimate of 0.5%. Core Retail Sales declined 0.3%, well off the forecast of +0.2%. A catalyst for the recent market sell-off was fear of higher inflation, and with inflation indicators pointing upwards, the dollar and the stock markets could be in for rough ride in the coming weeks.
The recent stock market turbulence has triggered volatility in the currency markets, and this is causing concern at the ECB. Last week, ECB President Mario Draghi said that he is more confident that eurozone inflation is moving closer to the Bank’s target of just below 2 percent, due to improving economic growth. However, Draghi listed currency market volatility as an obstacle to the inflation target, and added that the ECB would carefully monitor the euro’s exchange rates. The ECB tapered its massive stimulus program from EUR 60 billion to 30 billion/mth in January, and the markets are on the lookout for hints as to whether the ECB will normalize policy and wind up stimulus in September.
Weak Retail Sales Dampen CPI Boost
Weak retail sales dampen CPI boost
January inflation figures came in well above median forecast and raised fears of another sell-off in the equity market. The headline measure printed at 2.1%y/y, compared to 1.9%y/y consensus, while the core measure came in at 1.8%y/y versus 1.7% expected. As discussed yesterday, the steady appreciation of energy prices explains most of the upside surprise in the headline CPI. Regarding the core measure, the broad-based USD weakness of the last couple of months is undoubtedly the main reason behind this stronger Core CPI read.
Initially, financial markets reacted violently to the release as it would to suggest that the Fed would have to respond with a more aggressive path of tightening to tame accelerating inflation pressures. As broadly expected, European equities and US futures moved in negative territory with the Dow Jones losing instantaneously 2%, while the Eurostoxx 50 fell 1.4%. In the bonds market, the entire US yield curve shifted to the upside. The VIX index jumped to 25.7.
However, it didn’t take long before investors start shifting attention towards retail sales figure to realise that consumer didn’t spent much in January. Advanced retail sales contracted 0.3%m/m (versus +0.2% median forecast), when excluding auto & gas the contraction is trimmed to -0.2%. Given the sharp and steady increase in consumer spending since September last year, this decrease is consumption is rather due to the fact that US people are taking a temporary break after the Christmas season, rather than the sign of persistent weakness in the economy. Indeed, the unemployment rate is very low and wage have finally started to grow.
Therefore, investors quickly started to dump the greenback again and bought stocks as their concerns about accelerating inflation pressure have been alleviated. This morning, the US dollar continues to grind lower. EUR/USD is up 0.4% to 1.25, USD/JPY is off 0.7% to 106.25 while USD/CHF touched 0.9229, down 0.55%. The greenback is not out of the wood yet as investors are paying more and more attention to the current account and fiscal deficit of the world largest economy. In addition, the trend seems here to stay, meaning that further USD weakness should be expected.
European markets remain stoic following US CPI release
Markets were waiting for US January CPI thinking it would be decisive for the global outcome of Wednesday’s journey. In the end, even if the US CPI Y/Y came out at 2.10% (expected at 1.90%; M/M: 0.50% vs 0.30% expected), European markets extended current week’s rally, with the Euro Stoxx 50 ending at 3’370 (+0.87%), CAC 40 5’165 (+1.10%), DAX 12’339 (+1.17%), IBEX 35 9’686 (+0.37%), FTSE MIB 22’434 (+1.81%) along with the FTSE 100 that ended at 7’214 (+0.64%). Switzerland’s SMI followed the same trend, closing at 8’899 (+1.67%). Overall, world stock markets performed well, the MSCI World reached 2’106 points (+1.21%), maintaining its momentum and boosted by Information Technology (+1.84%), Financials (1.69%), Materials (1.29%), Consumer Discretionary (1.28%), Health Care (+1.28%) and Energy (+1.14%). Lagers were Telcos (-0.22%) and Real Estate (-0.06%).
As we see a US 10-year Treasury note jumping up to 2.91% (+2.57%), a 4-year high, 10-year treasuries in the Eurozone slightly increased up to 0.757 (+0.98%), highest rates since September 2015, thus confirming that we might be gradually witnessing a change in the era of global bond market.
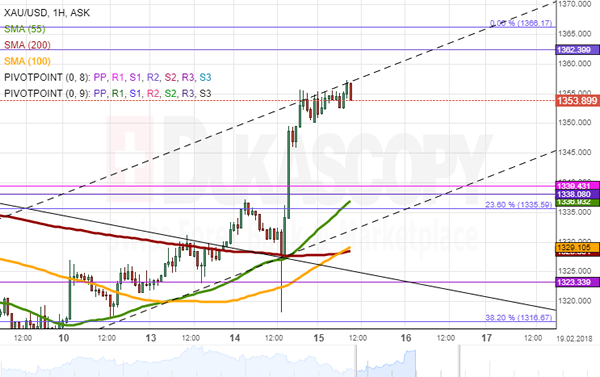
XAUUSD Analysis: Reaches New February High
Gold spent the first part of Wednesday's trading session calmly, as it managed to reverse the from 23.60% Fibo retracement and approach the upper boundary of the breached three-week channel.
The better-than-expected US CPI had an immediately positive impact on the Greenback, as it managed to push the rate as low as the 1,318.10 mark. However, the 55– and 200-hour SMAs proved to be strong support, thus allowing for the yellow metal to surge up to a new February high of 1,355.00.
The Asian session started with no changes to the exchange rate, thus suggesting that bulls might finally be ready to surrender their positions. The nearest resistance is the weekly R2 at 1,362.40, while two strong support clusters are located at 1,340.00 and 1,325.00.