Sample Category Title
Can UK Retail Sales Extend the Pound’s Recovery?
UK retail sales for January are due to be released at 0930 GMT on Friday and forecasts point to a rebound in monthly terms following a sharp decline previously. Should the actual prints show that UK consumer spending remains on a decent track despite the squeeze in real incomes, that would be another factor enhancing the case for the Bank of England (BoE) to raise interest rates in May.
In January, UK retail sales are projected to have risen by 0.5% on a monthly basis, after a 1.5% plunge in the preceding month. The core measure – which excludes fuel for automotives – is expected to have increased by 0.6%, following a 1.6% drop in December. In yearly terms, both the headline and the core prints are anticipated to have accelerated notably.
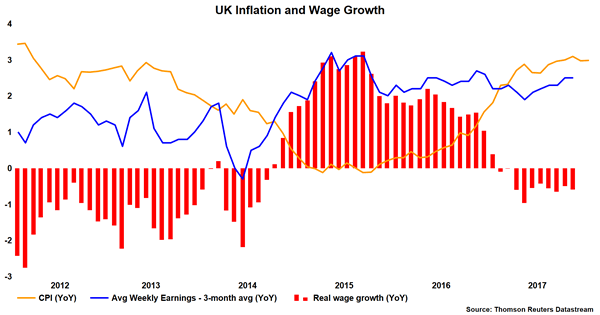
It is critical to note that retail sales have been on a weakening path for over a year now. To a large extent, this has been attributed to the squeeze in real incomes that has occurred ever since the Brexit vote. To explain – UK inflation has accelerated sharply due to the pound's devaluation, but wage growth has remained almost flat, thereby "squeezing" the real disposable income of UK consumers. This is one of the (many) reasons that have kept BoE policymakers from raising interest rates too much. Higher borrowing costs could weigh further on wages and thus, feed into slower consumption and economic growth.
Still, at its latest policy gathering, the BoE was confident enough to indicate that rates may rise faster and to a greater extent than previously signaled, pushing the implied probability for a rate hike in May to 65%. With expectations for a May action riding high, it will be critical to see whether spending (i.e. retail sales) has remained on a decent track.
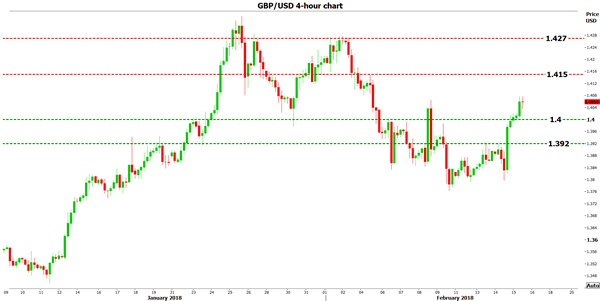
Should the retail sales prints meet or exceed their forecasts, that could help the probability for a May hike to climb higher and by extent, support the pound. Sterling/dollar is likely to surge and test the 1.4150 resistance zone, where a potential upside break could open the way for extensions towards the 1.4270 territory, marked by the peaks of February 1.
On the flipside, if sales disappoint relative to expectations, it may be perceived as a signal that the income squeeze is continuing to limit consumption, and it could lower the likelihood for a BoE action in May. Such an outcome may bring the pound under renewed selling interest, with sterling/dollar likely to aim for a test of the psychological 1.4000 area. If sellers manage to overcome that zone, then the 1.3920 hurdle could come into play.
In terms of what the other major gauges of the retail sales printed in the month, the British Retail Consortium (BRC) retail sales monitor held steady at 0.6% year-on-year, while the Visa consumer spending index declined further to -1.2%, also in yearly terms. Both of these gauges suggest that the risks surrounding the retail sales forecasts may be skewed somewhat to the downside, perhaps for slightly softer-than-anticipated prints.
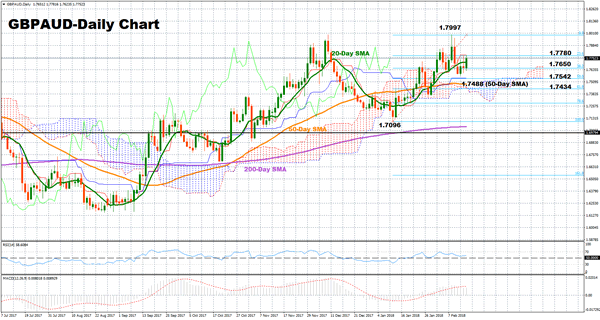
GBPAUD Seen Neutral in Short-Term; Could Maintain Uptrend in Medium-Term
GBPAUD has been making higher highs over the last number of months. In the short-term, the market seems to have lost direction after the pair touched a 1 ½-year peak of 1.7997 on February 8 and now the technical indicators suggest the continuation of the consolidation phase.
The Relative Strength Index (RSI) is moving sideways above 50. The red Tenkan-sen line has been flat the past two days above the blue Kijun-sen line which has also no specific direction, indicating a trendless situation in the short-term. The 20-day simple moving average (SMA) is turning flatter, sending further neutral signals.
However, if the market manages to expand to the north, the 23.6% Fibonacci of 1.7780 of the upleg from 1.7096 to 1.7997 could offer nearby resistance ahead of attention shifting to the previous top of 1.7997. Further above, the extension of the recent rally could reach the area between 1.8100-1.8300.
On the flip side, a decline could meet support around the 38.2% Fibonacci at 1.7650, including the 20-day moving average at 0.7710 which was violated on the way up earlier the day and could instead provide support. Steeper losses leading to a close below the 50% Fibonacci of 1.7542 and more importantly under the 50-day SMA of 1.7488 would increase the odds for the pair to plunge to 0.7434 (61.8% Fibonacci).
Looking at the medium-term picture, the market is looking neutral-to- bullish given its performance the past three months. Moreover, as far as prices hold above the 50-day SMA and the golden cross between the 50- and the 200-day SMA remains in place, the odds for a trend reversal are looking smaller.
USDCAD – Limited Recovery Attempts as Thickening Daily Cloud Continues to Weigh
The USDCAD bounced on Thursday after extension of Wednesday's sharp bearish acceleration found footstep at 1.2465 (daily Kijun-sen/50% retracement of 1.2248/1.2687 upleg). Recovery attempts were so far limited at 1.2520 (broken Fibo 38.2%) and under rising 10SMA which marks first pivotal barrier at 1.2537. Mixed daily studies (conflicting MA's/neutral RSI/negative slow stochastic) are lacking clearer direction signal, however, thickening daily cloud and Wednesday's large bearish candle with long upper shadow, continue to weigh. Next pivots lay at 1.2550/55 (Fibo 38.2% of 1.2687/1.2465/daily cloud base) and firm break here would generate fresh bullish signal for extended advance. Meanwhile, the downside would remain vulnerable while these barriers cap, keeping risk at 1.2465 at 1.2452 (converged 20/30SMA's), with break here to generate stronger bearish signal.
Res: 1.2520; 1.2555; 1.2576; 1.2602
Sup: 1.2465; 1.2452; 1.2416; 1.2352

Sunset Market Commentary
Markets
Global core bonds traded near yesterday's sell-off lows during European dealings amid an empty eco calendar. Investors counted down to huge batch of US eco data. Inflation (PPI) once more beat expectations, but was offset by mixed business sentiment indicators and disappointing hard data (production). While this combination was no hurdle for a huge bond sell-off yesterday, it was the case today. A lackluster attempt to head to the lows was countered by some short term profit taking. The US yield curve flattens at the time of writing with yield changes ranging between +2.9 bps (2-yr) and -1.6 bps (30-yr). The German yield curve bear steepens with yields 0.6 bps (2-yr) to 1.7 bps (30-yr) higher. On intra-EMU bond markets, 10-yr peripheral yield spread changes versus Germany narrow 2 to 4 bps with Greece (+2 bps) underperforming.
Dollar weakness was still the name of the game early in European dealings. The move occurred amid a positive equity sentiment. EUR/USD filled offers just north of 1.25. However, the risk rally and the decline of the dollar both slowed going into the US trading session. US eco data were mixed, but the PPI price data again surprised on the upside of expectations. US yields, especially at the short end of the curve, held close to recent highs. The data had little impact on USD trading. Maybe the PPI report helped to prevent a new USD downleg. EUR/USD is trading in the 1.2480 area. USD/JPY hovers around 106.40. For now we look out whether the recent pattern of equity gains causing USD selling will persist.
There were no important UK eco data today (UK retail sales are scheduled for tomorrow). Yesterday, sterling remained in the defensive as the 'Road to Brexit' speech of UK foreign affairs Minister Boris Johnson suggested that Britain could be heading for a hard Brexit. EUR/GBP traded temporary north of 0.89, but a real test of the 0.8928 intermediate resistance didn't occur. Some correction kicked in. This correction continued today. Technical consideration probably prevailed. There were also rumours that the EU could be less strict in the implementation/ sanctioning of rules during the transition period. EUR/GBP trades currently in the 0.8870 area. Cable rebounded to the high 1.40 area, but this is mainly a story of USD weakness.
European equities mostly show modest gains of about 0.25%, with France outperforming (1.3%). US indices try to extend yesterday's impressive rebound and are gaining between 0.5% and 1.0%.
News Headlines
US President Trump said he would support a 25-cent-per-gallon increase in federal gasoline and diesel taxes to help pay for upgrading American roads, bridges and other public works.
US eco data printed mixed to stronger. US weekly jobless claims continued to hover around multi-decade low (230k), providing more evidence of the strong US labour market. PPI headline (0.4% M/M, 2.7% Y/Y) and core inflation (0.4% M/M, 2.2% Y/Y) rose more than forecast in January, posting yet another upward surprise on the US inflation front. Regional business indicators parted ways with an increase and positive surprise for the Philly Fed Business outlook (22.2 to 25.8) and a bigger-than-expected decline in the Empire manufacturing survey (17.7 to 13). Industrial production disappointed in January (-0.1% M/M) with a downward revision to the December figure (0.4% M/M)
Yen Climbs to 3-Month High as Dollar Under Pressure
The Japanese yen has posted gains in the Thursday session, continuing the upward trend seen we've seen for most of the week. In North American trade, USD/JPY is trading at 106.36, down 0.60% on the day. On the release front, Japanese manufacturing reports were mixed. Core Machinery Orders plunged 11.9%, worse than the estimate of -1.9%. However, Revised Industrial Production bounced back with a strong gain of 2.9%, beating the forecast of 2.7%. This marked the strongest gain since April. In the US, PPI gained 0.4%, matching the forecast. Core PPI also gained 0.4%, beating the estimate of 0.2%. Both indicators rebounded after declines in the previous month. Unemployment Claims climbed to 230 thousand, just above the estimate of 229 thousand. On Friday, the US releases key housing and consumer confidence numbers.
The yen continues to roll, as the currency has climbed 2.2% this week. The safe-haven yen has received a boost from the turbulence in the markets, as the appetite for risk has waned. The yen is enjoying a stellar 2018, posting gains of 5.5% against the struggling US dollar. On Thursday, the Japanese currency climbed to its highest level since early November. The dollar was broadly lower, as investors reacted negatively to weak retail sales reports in the US. Retail Sales was flat at 0.0%, short of the estimate of 0.5%. Core Retail Sales declined 0.3%, well off the forecast of +0.2%.
All signs are pointing to Haruhiko Kuroda remaining at the helm of the Bank of Japan. Kuroda is about to complete his first 5-year term, and another term would represent a strong vote of confidence in Kuroda, especially because BoJ governors usually serve only one term. Kuroda has made it a priority to raise inflation, but this has proven a daunting task, as inflation is still short of the BoJ's inflation target of 2%. In this period of strong volatility in the currency markets, Kuroda's re-election may have a calming effect on the markets.
With US inflation indicators pointing higher in January, the Fed will be reevaluating its projection for rate hikes in 2018. Currently, the Fed is planning three hikes this year, but that could change to four, or even five hikes, if inflation continues to head upwards and the robust US economy maintains its strong expansion. The new head of the Federal Reserve, Jerome Powell, received a rude welcome from the stock markets, as he started his new position last week. Powell sought to send a reassuring message on Tuesday, saying that the Fed is on alert to any risks to financial stability. However, it is clear that the Fed's hand is limited when it comes to stock markets moves, and the volatility which we saw last week could resume at any time.
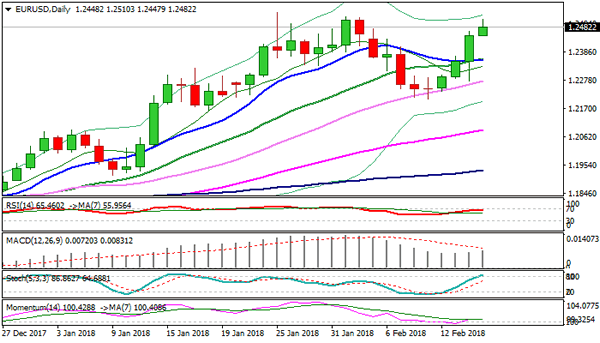
EURUSD Remains Firm after Mixed US Data; Bulls May Extend Consolidation Before Continuing
The Euro holds firm tone at the beginning of US session and holding under fresh two-week high at 1.2510, posted in early European trading today. Pullback from 1.2510 was shallow (contained at 1.2462), with mild reaction on mixed US data (jobless claims and PPI came in line with expectations; Philly Fed manufacturing PMI strongly overshooting forecast and Empire State Manufacturing index falling well below consensus).
Bulls remain firmly in play, with expected hesitation ahead of pivotal 1.2537 barrier (2018 high, posted on 25 Jan), being so far shaped in narrow consolidation range, which could extend before continuing higher.
Break above 1.2537 would expose strong barrier at 1.2597 (Fibo 61.8% of 1.3992/1.0340, May 2014/Dec 2016 fall).
Hourly higher low is forming at 1.2462 and marking immediate support, followed by 1.2447 (session low), which guards psychological 1.2400 support, also broken Fibo 61.8% of 1.2522/1.2205 bear-leg.
Res: 1.2510; 1.2522; 1.2537; 1.2597
Sup: 1.2462; 1.2447; 1.2400; 1.2358
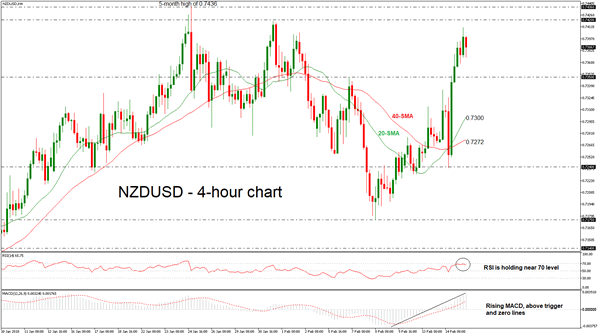
NZDUSD Follows Bullish Tendency; Next Level Up at 0.7420
NZDUSD is moving lower over the last couple of hours after the bullish run it created in the previous days. However, the aggressive buying interest pushed the price above the key level of 0.7350 and posted a 2-week high of 0.7410, indicating further upward tendency.
Short-term momentum indicators are also pointing to a continuation of the bullish bias. However, the RSI is near the 70-overbought level at 64, suggesting that the latest upswing may be running out of steam and that the risk of a near-term correction is high. The MACD oscillator is still moving with strong momentum in the bullish zone.
If prices extend the upside pressure, immediate resistance could come at 0.7420. Above that, the price could hit the 5-month high of 0.7436.
On the flip side, in the event of an upside reversal, the next level to watch is the 0.7350 support obstacle. A penetration to the downside of the aforementioned barrier could open the door for the 20 and 40 simple moving averages of 0.7300 and 0.7272 respectively, in the 4-hour chart.
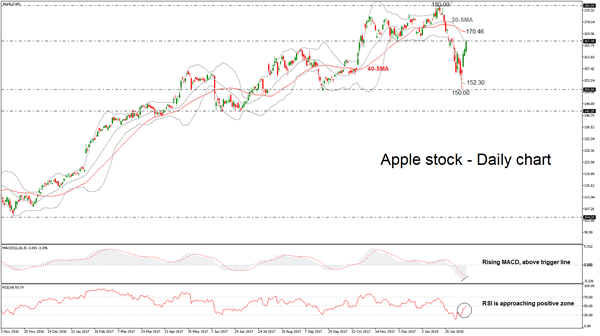
Apple Stock Returns to Gains; Posts 2-Week High
Apple stock price reached a 2-week high of 167.41 during Wednesday's US session as the price extends its bullish run, following the rebound on the 150.00 critical psychological level. Also, the stock completed the third straight green day hitting the 20-day simple moving average, which overlaps with the current 167.30 resistance level.
In the daily timeframe, from the technical point of view, technical indicators are endorsing the scenario for further gains. The MACD oscillator is rising in the negative territory above its trigger line with strong momentum, while the RSI indicator is touching the 50 level after the aggressive run from the 30 area.
To the upside, there is an obstacle of 40-day SMA near 170.46, where the price needs to surpass it before moves towards the 180.00 handle, taken from the high on January 18.
Should prices reverse lower, immediate support could come at 152.30, which is the lower Bollinger band. A drop below this area could take the stock closer to the 150.00 key level and significantly weaken the bullish short-term structure.
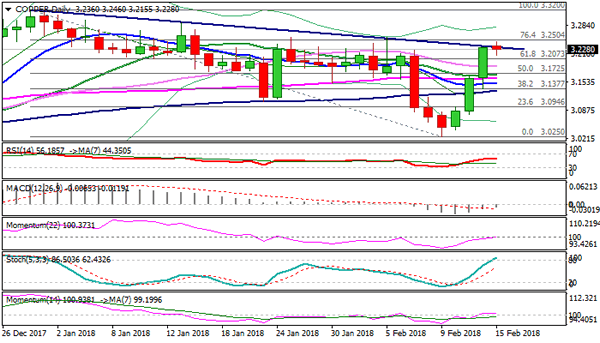
Copper – Profit-Taking after Strong Rally Slows Bulls
Copper trades in narrow consolidation under new marginally higher high at $3.2460, posted after strong three-day rally from $3.0250 (09 Feb low). Rally accelerated on Tue/Wed on fresh weakness of the dollar and surged through thick daily cloud and a number of daily MA's, retracing nearly 76.4% of $3.3200/$3.0250 bear-leg and generating strong bullish signal. Profit-taking after strong rally could slow bulls, along with overbought slow stochastic. Also, lower liquidity on reduced participation of Chinese traders due to Lunar New Year could cause stronger movements in the market. Today's close in red would initial signal of bulls taking a breather, however, firm bullish structure suggests limited dips (ideally to be contained by daily cloud top ($3.1956), before bulls continue through immediate barriers at $3.2504 (Fibo 76.4% of $3.3200/$3.0250 descend) and double-top at $3.2565/60 (25 Jan/05 Feb). Plethora of supports provided by daily MA's lies below cloud top and supports scenario.
Res: 3.2504; 3.2565; 3.2750; 3.2900
Sup: 3.2155; 3.1956; 3.1185; 3.1714
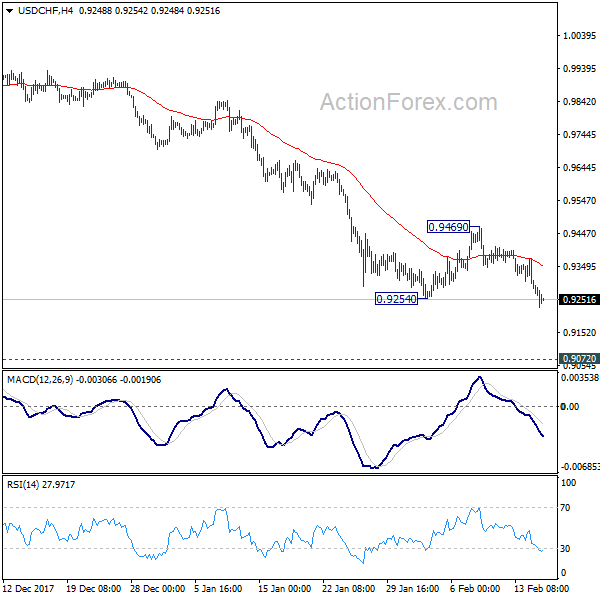
USD/CHF Mid-Day Outlook
Daily Pivots: (S1) 0.9259; (P) 0.9317; (R1) 0.9349; More...
USD/CHF's break of 0.9254 low today confirms down trend resumption. Intraday bias stays on the downside. Current fall should target 0.9115 medium term projection level next. On the upside, break of 0.9469 resistance is needed to indicate short term bottoming. Otherwise, outlook will remain bearish in case of recovery.
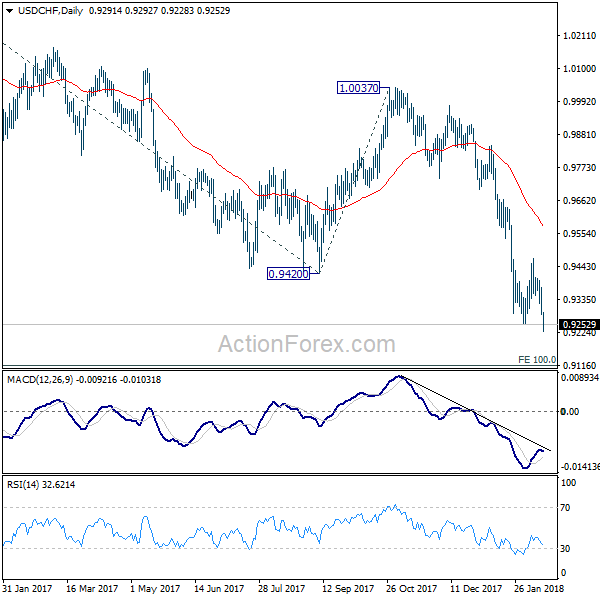
In the bigger picture, fall from 1.0342 is developing into a medium term down trend. Deeper decline should be seen to 100% projection of 1.0342 to 0.9420 from 1.0037 at 0.9115. Break will target 161.8% projection at 0.8545. In any case, sustained trading above 55 day EMA is needed to be the first sign of medium term reversal. Otherwise, outlook will stay bearish even in case of strong rebound.