Sample Category Title
Technical Outlook: AUDUSD – Falling 10SMA Continues To Cap Recovery, US CPI Data Expected To Provide Fresh Signal
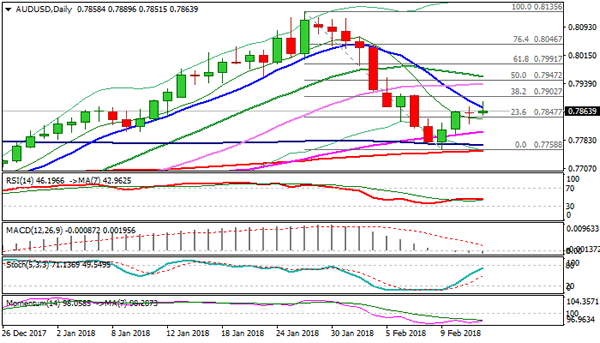
The Australian dollar ticked higher on broadly weaker dollar on Wednesday and probed above falling 10SMA (0.7873) but gains were short-lived so far.
Tuesday's Doji candle which came after two days of strong rally was signal that recovery might be running out of steam.
Negative 14-d momentum and neutral RSI on daily chart also warn of stall.
Rising daily cloud continues to underpin, but bulls need clear break through 10SMA and another pivotal barrier at 0.7902 (Fibo 38.2% of 0.8135/0.7758 bear-leg / falling daily Tenkan-sen) to generate stronger signal for further recovery extension towards 0.7947 (daily Kijun-sen).
Conversely, repeated close below 10SMA will be initial bearish signal which would increase downside risk and expose lower pivot at 0.7807 (rising 55SMA).
US CPI data are expected to provide stronger signal.
Res: 0.7873, 0.7889, 0.7902, 0.7947
Sup: 0.7851, 0.7827, 0.7807, 0.7770
XAUUSD Analysis: Breaches 200-Hour From Below
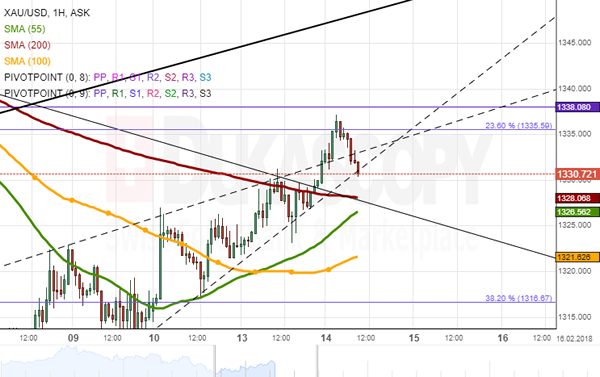
Contrary to expectations, the upper channel boundary and the 200-hour SMA near 1,330.00 did not provide enough resistance to pressure the rate south on Tuesday.
The pair remained sticky to this cluster, thus providing and early indication of the likely breakout north, even despite signals technical signals pointing to the prevailing bearish sentiment. By Wednesday morning, the yellow metal had reached the monthly PP, the weekly R1 and the 23.60% Fibo retracement circa 1,338.00.
The base scenario favours the pair edging lower during the following trading hours just to make a rebound from the breached channel. Subsequently, the 200-hour might successfully support the pair and thus allow for a continuous surge, setting the 1,350.00 mark as today's high.
CHF/JPY 4H Chart: Possible Breakout From Triangle
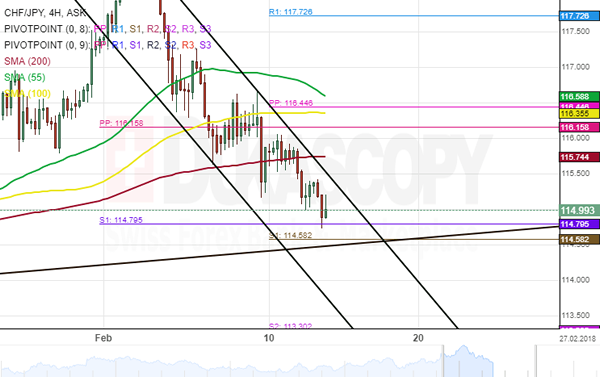
The Swiss Franc has been trading in an ascending channel against the Japanese Yen after hitting the lower boundary of a dominant channel on January 10. However, the rally was stopped by the monthly pivot point at 118.64.
After reaching the monthly high at 118.64, the currency pair has been trading in a channel down.
The dominance of bears over the currency exchange rate is likely to end near support cluster located at 114.58. If this area is to hold, the pair could reserve for a test the upper boundary of the junior pattern.
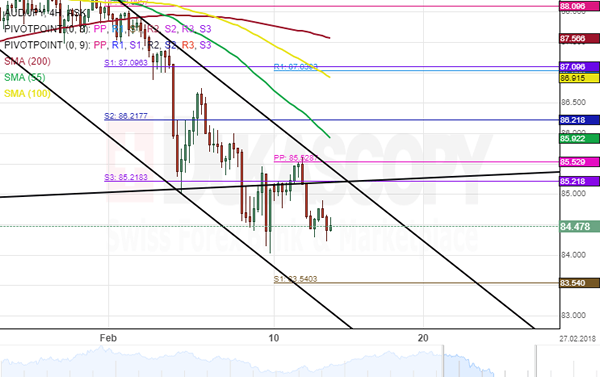
AUD/JPY 4H Chart: Poised For 83.54
The bearish movement is dominating the AUD/JPY pair since late January. The currency pair breached the lower boundary of a dominant channel and is currently heading south.
Given that the rate broke the previous pattern, a new junior pattern has been drawn to trail the price movement. In the meantime, technical indicators favour the currency exchange rate to continue plummeting south.
As for the near future, the Aussie is likely to continue trading in the channel down until it finds support at the weekly pivot point at 83.54
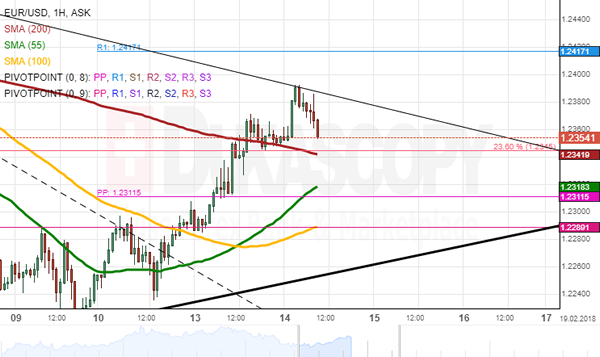
EURUSD Analysis: Tests Medium-Term Channel
Upside momentum prevailed in the market on Tuesday, as the Euro closed the day with a 64-pip gain against the US Dollar. Along the way, the 200-hour SMA, the weekly PP and the 23.60% Fibo were breached.
On Wednesday morning, the pair was testing the upper boundary of a three-week channel down and the 1.24 mark which had provided an unbreakable resistance last week.
Technical indicators point to a period of consolidation today, as their high positioning might start to weaken in the nearest time. Some minor upside potential, however, is still apparent. Thus, gains could be capped near the weekly R1 at 1.2417, while the pair is likely to be supported by the 200-hour SMA circa 1.2350.
In the meantime, US CPI data is likely to introduce volatility in the market.
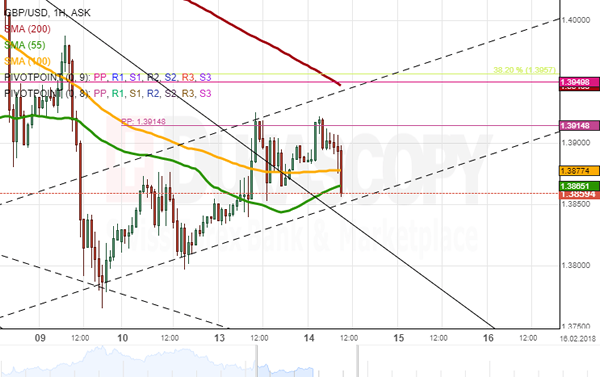
GBPUSD Analysis: Likely To Respect Junior Channel
The Sterling closed the previous trading session by gaining 56 pips against the US Dollar. The rate's failure to reach the bottom channel line on Friday and its subsequent surge was eventually followed by a breakout of the prevailing two-week channel down and the 55– and 100-hour SMAs near 1.3870.
The pair is currently trading in a short-term channel up. Its southern barrier is supported by the aforementioned SMAs, while the northern side—by the 200-hour SMA and the 38.20% Fibo retracement. This channel is likely to be respected during the first part of the day and maybe even further if the US CPI data do not introduce extensive volatility in the market.
The ultimate daily high should be the monthly PP at 1.40, while the nearest support is the distant weekly and monthly S1s at the 1.37 mark.
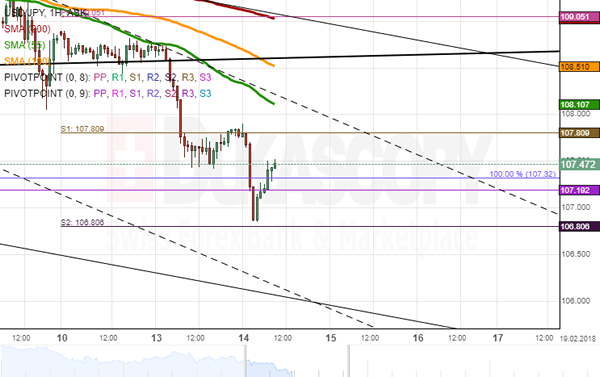
USDJPY Analysis: Plunges To Yearly Low
The strong bearish pressure that dominated the USD/JPY exchange rate on Tuesday continued to prevail in this session, as well.
The pair showed some signs of a recovery during yesterday evening; however, the unsuccessful test of the weekly S1 at 107.81 sent the pair for a further plunge down to the weekly S2. As a result, the Greenback reached a new 2017/2017 low of 106.85.
Technical indicators have been sent in the strongly oversold area; thus, a possible recovery up to the 55– and 100-hour SMAs near 108.50 might be due in the nearest time. However, bears could likewise be reluctant to abandon their positions and therefore continue pressuring the US Dollar lower down to the bottom boundaries of two descending channels near the 106.00 area.
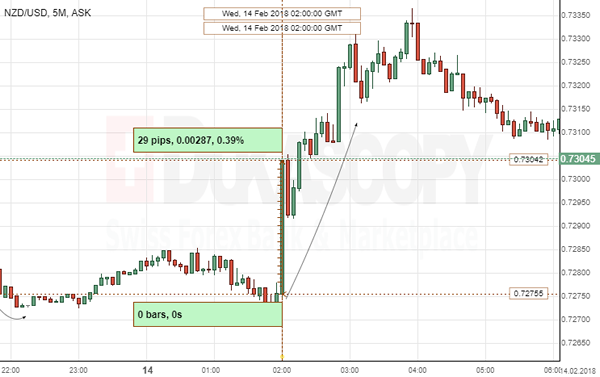
NZD/USD: NZ Inflation Expectations
The Kiwi strengthened against the US Dollar after the Reserve Bank of New Zealand boosted its inflation expectations. The NZD/USD currency pair climbed 0.39% or 29 base points to the 0.7304 mark to continue gradual increase.
The RBNZ quarterly expectations survey showed annual inflation is likely to reveal average 2.11% growth pace in the next two years, following 2.02% in the prior survey. The report added to expectations that the Central Bank would keep the key interest rate at the record-low of 1.75% for longer before hiking in 2019. Meanwhile, the Bank's one-year inflation preformed a slightly softer 1.86%, compared with 1.87% in the fourth quarter.
Technical Outlook: GBPUSD Remains Steady But Gains Are Limited, US Data In Focus
Cable is holding within narrow consolidation under previous day’s high at 1.3924 which capped fresh attempts higher today.
Stronger than expected UK inflation data on Tuesday boosted pound but gains were so far limited.
Mixed signals from daily techs lack clearer direction signals, as falling 10SMA approaches (currently at 1.3950) and weighs after forming bear-cross with 20SMA, together with bearish momentum.
Daily RSI remains in neutral mode while slow stochastic is trending higher after reversal from oversold zone and underpins.
Lift above 1.3924 is needed to expose pivots at 1.3950/60 (falling 10SMA / Fibo 38.2% of 1.4277/1.3764 downleg) break of which will be bullish signal for extension towards 1.4008/21 (20SMA/daily Tenkan-sen).
Otherwise, the downside would stay vulnerable while 1.3924 barrier caps.
US data today are eyed for fresh signals.
Res: 1.3924, 1.3950, 1.3960, 1.4008
Sup: 1.3850, 1.3832, 1.3796, 1.3764
GBP/USD Congestion Zone 1.3866-1.3916
The GBP/USD has been consolidating within the 1.3866-1.3916 zone and we can see a clear congestion without any clear breakout to the upside. UK January CPI remained at 3.0% contrary to the 2.9 % forecast. Technically the price has been supported at 1.3866-76 and while the price bias remains bullish, the pair needs to make a strong 1h candle above 1.3920 in order to proceed further up. Clear break or 4h close above 1.3920 should target 1.3942, 1.3983 eventually reaching 1.4035 W H4 level. However a break below 1.3840 might go for a retest of 1.3799.
W H3 -Weekly Camarilla Pivot (Weekly Interim Resistance)
W L3 - Weekly Camarilla Pivot (Weekly Interim Support)
W H3 - Weekly Camarilla Pivot (Weekly Interim Resistance)
W H4 - Weekly Camarilla Pivot (Strong Weekly Resistance)
D H4 - Daily Camarilla Pivot (Very Strong Daily Resistance)
D L3 – Daily Camarilla Pivot (Daily Support)
D L4 – Daily H4 Camarilla (Very Strong Daily Support)
POC - Point Of Confluence (The zone where we expect price to react aka entry zone)