Sample Category Title
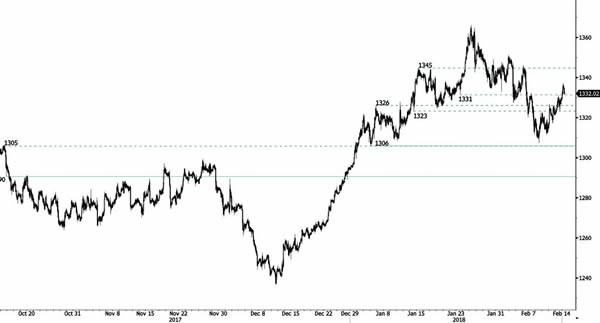
GOLD Upward Trend Maintained
Gold is recovering after its recent strong sell-off. Resistance is located at 1337 (12/09/2017) while further resistance remains at 1358 (08/09/2017). Supports are given at 1306 (04/01/2018 low) and 1290 (16/10/2017). The technical structure suggests further upside moves.
In the long-term, the technical structure suggests that there is a growing upside momentum. A break of 1'392 (17/03/2014) is required to confirm it. A major support can be found at 1'045 (05/02/2010 low).
abilize between 7'000 - 12'000 in 2018. Bitcoin is trading above its 200 DMA (6'500 range).
BITCOIN Indistinct Trading
Bitcoin is maintained at the range of 8800. Strong support and resistance stand at 5605 (13/11/2017 low) and 12130 (18/01/2018 high). The short-term technical structure suggests further sideways moves.
In the long-term, the digital currency has had an exponential growth but also presented important downturns. There is decent likelihood that the currency could stabilize between 7'000 - 12'000 in 2018. Bitcoin is trading above its 200 DMA (6'500 range).
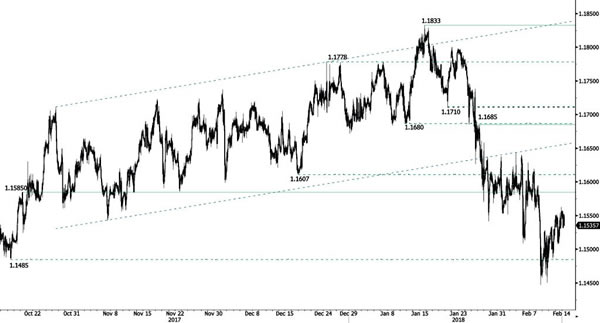
EUR/CHF Bouncing Back
EUR/CHF is heading higher and reached back the 1.155 range early this morning. Hourly resistance at 1.15850 (19/10/2017 high) is approaching while strong resistance at 1.1833 (15/01/2018 high) remains. Hourly supports are given at 1.14269 (04/10/2017 low) and 1.1388 (02/10 2017 low).
In the longer term, the technical structure has reversed. Strong resistance is given at 1.20 (level before the unpeg). Yet, the ECB's slowing QE program is likely to cause buying pressures on the euro, which should weigh in favour of the EUR/CHF. Support can be found at 1.0234 (20/04/2015 low).

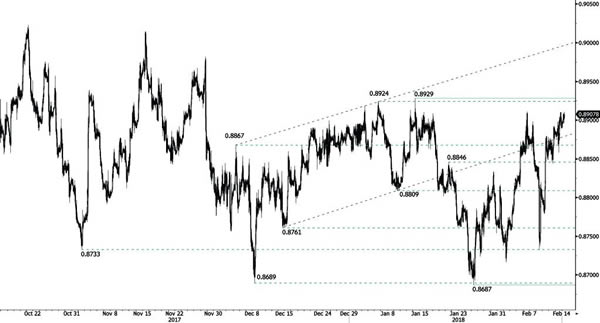
EUR/GBP Monitor Resistance At 0.8929
EUR/GBP is trading higher and approaches resistance at 0.8929 (12/01/2018 high). Hourly support remains at 0.8687 (25/01/2018). The technical structure suggests further short-term upside move.
In the long-term, the pair has largely recovered from 2015 lows. The technical structure suggests further upside pressure. The pair is trading above its 200 DMA. Strong resistance can be found at 0.9500 (psychological level) while support remains at 0.8304 (05/12/2016 low).
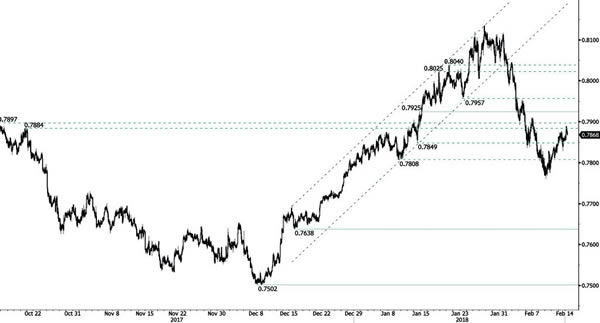
AUD/USD Recovery Maintained
AUD/USD bounced back at 0.7759 (09/02/2018 low) and continues its retracement, breaking resistance at 0.7884 (19/10/2017 high) and heading further up. Hourly resistance and support remain at 0.7925 (12/01/2018 high) and 0.7638 (15/12/2017 low). The technical structure suggests further short-term upside moves.
In the long-term, the upward trend resumes after failing to reach key resistance at 0.8164 (14/05/2015 low). Key support stands at 0.6009 (31/10/2008 low). A break of the key resistance at 0.8164 (14/05/2015 high) is needed to invalidate our long-term bearish view.
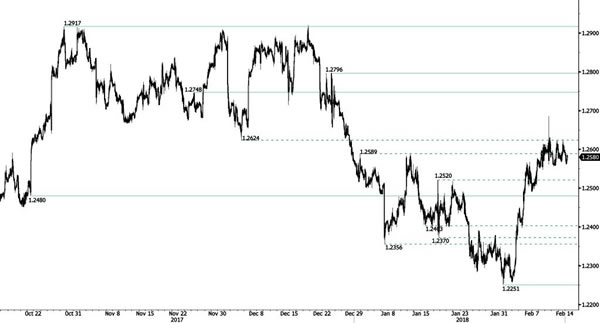
USD/CAD Maintained At 1.2575
USD/CAD is stabilizing and maintained at yesterday's range. The pair lies between hourly resistance at 1.2748 (24/11/2017 high) and support given at 1.2480 (20/10/2017 low). The technical structure indicates that further shortterm side trading is expected.
In the longer term, the pair is trading between resistance point at 1.3805 (05/05/2017 high) and support at 1.2128 (18/06/2015 low). Strong resistance is given at 1.4690 (22/01/2016 high). The pair is likely to head lower. The pairs is trading below its 200 DMA
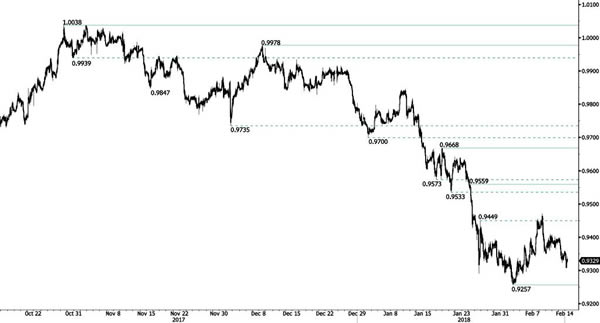
USD/CHF Slight Decrease
USD/CHF is weakening. The declining trend line remains intact, heading towards resistance at 0.9257 (01/02/2018 low). Hourly resistance stands at 0.9559 (24/01/2018 high) while further resistance remains at 0.9668 (17/01/2018 high).
In the long-term, the pair is still trading in range since 2011 despite some turmoil when the SNB unpegged the CHF. Support at 0.9259 (24/08/2015 low) is attainable. Key support remains at 0.9072 (07/05/2015 low) while resistance at 1.0344 (15/12/2016 high) is distanced. The technical structure favours a long term bullish bias since the unpeg in January 2015.
USD/JPY Trying To Bounce
USD/JPY is retracing following recent decline at 106.86 (14/02/2018 low) and broke resistance at 107.32 (08/09/2017 low). Hourly resistances can be found at 111.50 (18/01/2018) and 113.75 (12/12/2017 high). The technical structure suggests however further downside moves.
We favor a long-term bearish bias. Support given at 107.32 (08/09/2017 low) is now broken. A gradual rise towards the major resistance at 125.86 (05/06/2015 high) seems unlikely. Expected to decline further support at 101.20 (09/11/2016 low).

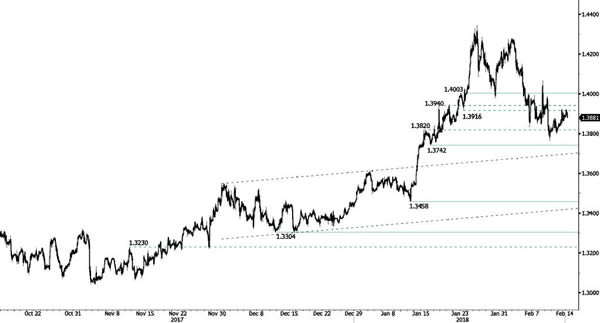
GBP/USD Grinding Higher
GBP/USD is bouncing since recent sideways moves, trading between resistance at 1.4003 (23/01/2018 high) and support at 1.3742 (16/01/2018 low). The technical structure suggests further potential upside move.
The long-term technical pattern is reversing. The Brexit vote had paved the way for further decline but the pair is moving to 2016 highs. Long-term support and resistance are given at 1.1841 (07/10/2017 low) and 1.5018 (24/06/2016 high)
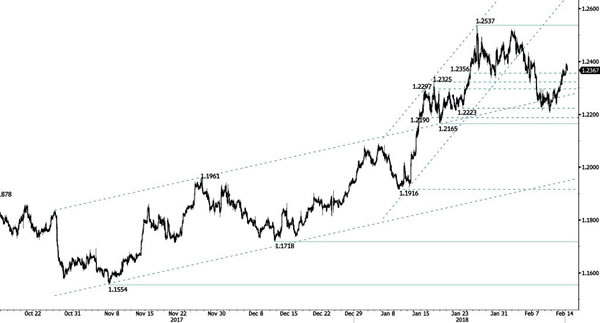
EUR/USD Increase Maintained
EUR/USD broke resistance at 1.2356 (24/01/2018 high) and challenges the 1.24 range. New hourly resistance is now at 1.2537 (25/01/2018 high) while hourly support is maintained at 1.2165 (17/01/2018 low). The technical structure suggests further upside moves.
In the longer term, the momentum is turning largely positive. We favor a continued bullish bias. Key resistance is holding at 1.2886 (15/10/2014 high) while strong support lies at 1.1554 (08/11/2017 low).