Sample Category Title
USD/CAD: Canada Employment Change
The Loonie dropped initially against the US Dollar on disappointing Canada's labour market data. The USD/CAD currency pair added 64 base points or 0.51% to touch the 1.2670 mark.
The economy of Canada lost the most positions in nine years in the beginning of 2018, confirming expectations that the BoC would keep rates on hold next month. Statistics Canada reported a decrease of 88K jobs in January, missing expectations for a 10K gain. Meanwhile, the unemployment rate increased to 5.9% in the reported month from December's 5.8%. Analysts suggested that the report is unlikely to change the trajectory of the Bank of Canada of a gradual monetary tightening path to come this year.
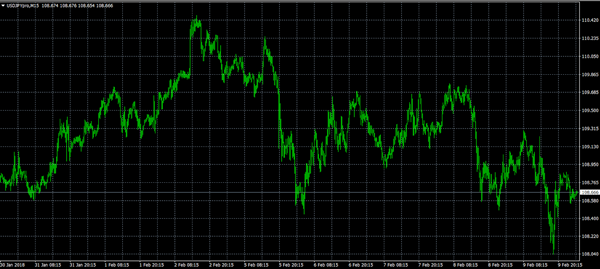
Technical Outlook: USDJPY – Friday’s Long-Legged Doji Warns Of Strong Indecision At Key 108.28/00 Supports
The pair stands at the back foot at the beginning of the week with limited recovery attempts in Asia. Friday's long-legged Doji signaled strong indecision at key support at 108.28 (26 Jan low) cracked on Friday's brief dip to 108.04.
Daily studies are in firm bearish setup and keep the downside at risk, extended consolidation phase above 108.28 seems to be over.
Firm break through supports at 108.28/00 would open way for final push towards key short-term support at 107.31 (03 Sep low) to fully retrace 107.31/114.73 correction.
However, the pair may extend consolidation, awaiting Wednesday's US CPI data, which could be a catalyst.
Meanwhile, the pair is expected to hold between 108.28 and 109.20 (daily 10SMA) with break above 10 SMA to sideline immediate downside risk.
Res: 109.20, 109.78, 110.18, 110.48
Sup: 108.28, 108.00, 107.31, 107.00
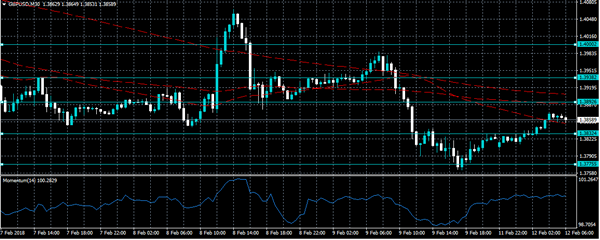
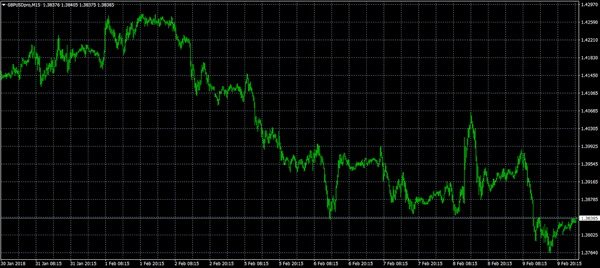
Technical Outlook: GBPUSD Near-Term Bears Found Footstep But Recovery Was So Far Limited
Bear-leg off 1.4277 (02 Feb lower top) found footstep at 1.3796 (Fibo 61.8% of 1.3457/1.4344 upleg) after Friday’s probe below was short-lived, but recovery attempts were so far limited.
Near-term direction is not clear as daily studies give mixed signals. Momentum is negative, 10/20SMA’s and converging and signaling formation of bear-cross, with strong bearish weekly close also weighing.
Daily RSI is in sideways mode and in neutrality zone (50), while positive signal is generating on reversal of daily slow stochastic from oversold territory. Stronger bullish signal could be expected on firm break above rising 30SMA (1.3864) which capped recovery attempts in Asia and lift above daily Kijun-sen (1.3901) which would open way for stronger recovery and expose next targets at 1.3960 (Fibo 38.2% of 1.4277/1.3764) and 1.4021 (daily Tenkan-sen).
Otherwise, the downside would remain vulnerable, with bearish signal seen on firm break below 1.3796 Fibo support.
Res: 1.3901, 1.3960, 1.3986, 1.4021
Sup: 1.3796, 1.3764, 1.3700, 1.3655
Stocks Look To US Budget Deficit And Inflation Data For Clues
Here are the latest developments in global markets:
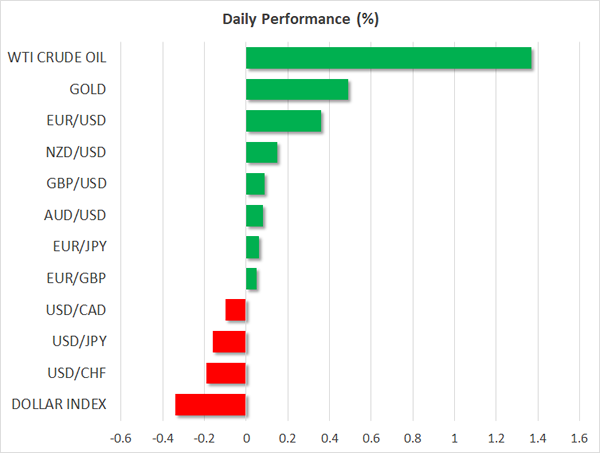
FOREX: The dollar index traded 0.3% lower on Monday, despite the recent surge in 10-year US Treasury yields, which are now hovering near 2.88%.
STOCKS: US equity indices experienced a tentative rebound on Friday. The S&P 500 led the way, rising by 1.5%, while the Dow Jones and the Nasdaq Composite rose by 1.4%. Moreover, futures tracking the S&P, Dow, and Nasdaq 100 are all in positive territory at the moment, suggesting that these indices could open in the green today. That said, the turbulence may not be over just yet, as there are a couple of major events in the bond market this week that could have spillover effects to stocks as well. Japanese markets were closed today for a holiday. Hong Kong's Hang Seng was down by less than 0.2%, giving up on earlier gains, while the rest of Asia was up for the most part. In Europe, futures tracking the Euro STOXX 50 are safely in the green.
COMMODITIES: Oil prices briefly tumbled on Friday, after the Baker Hughes oil rig count showed that the number of active US rigs surged. The pullback only lasted a few hours though, before oil prices recovered alongside the major US equity indices and energy stocks. WTI crude is up nearly 1.4% today, while Brent is 1.0% higher. Despite the rebound, one must sound a note of caution that US production has risen rapidly in recent weeks, putting in jeopardy the narrative that the market is rebalancing itself quickly, and increasing the risk of further tumble should this pattern continue. In precious metals, gold prices are 0.3% higher today, possibly due to the softer greenback. Strangely, the yellow metal has remained largely indifferent to equity market volatility in the past week.
Major movers: Stocks rebound; US budget deficit in focus
Friday was a particularly busy day in financial markets. The spotlight remained on major US equity indices, which recovered some of their recent losses, but still posted their worst week in around two years. Following last week's selloff, investors may be wondering how much longer the turbulence will last, and whether it will get even worse before it gets better. That question may be partially answered on Wednesday, when the US releases its inflation data for January. Should the CPIs confirm that inflationary pressures have started to intensify, as was indicated by the pick-up in earnings, then US Treasury yields could spike higher and thus exert greater downward pressure on equities. Conversely, soft inflation prints could provide some much-needed reprieve to stock indices.
Another factor that could impact US bond yields and thereby equity performance is the government's budget deficit announcement for 2019, which is due today. On Sunday, US Budget Director Mick Mulvaney said that the US will post a larger deficit this year, something that could result in a “spike” in interest rates. Should his statement come true, equity indices will probably continue to be on shaky legs for a while longer.
Sterling tumbled on Friday, as the EU's chief Brexit negotiator Michel Barnier provided a reality check on the progress of the negotiations. Among other points, he noted that there are still substantial disagreements regarding the transition period, and that a transition deal is not a given should these disputes persist. His comments underline once again that there is little room for complacency in this process, and that even a “simple” matter like a transition period should not be viewed as a “done deal” beforehand by investors.
Elsewhere, the Canadian dollar experienced heightened volatility on Friday, following the nation's jobs report for February. The currency initially tumbled, as the unemployment rate rose by more than expected and the labor force participation rate fell. However, the loonie rebounded almost immediately to trade even higher against the dollar, perhaps because investors focused on the encouraging aspect of the report; wages. Earnings accelerated notably, a factor that may have led to speculation the BoC may “look through” some of the softness in jobs, amid signs that inflationary pressures are picking up.
In Japan, media outlets reported that Bank of Japan (BoJ) Governor Haruhiko Kuroda will be nominated for another term. A confirmation of this by Parliament could help to cement expectations that the BoJ will keep its ultra-loose policy framework in place for an extended period of time.
Day ahead: Equities could dominate attention in absence of data
Monday's calendar is a light one, with the focus possibly remaining in equity markets after the previous week's turmoil. Companies releasing earnings will also be attracting interest.
Data on the US's Federal Budget balance for the month of January will be made public at 1900 GMT.
Bank of England policymakers Gertjan Vlieghe and Ian McCafferty will be speaking at 0950 GMT and 1630 GMT respectively, while Reserve Bank of Australia Assistant Governor Luci Ellis will be talking at a forecasting conference at 2150 GMT.
On the political front, it seems that there are renewed efforts to further ease tensions in the Korean peninsula, as the 2018 Winter Olympics are taking place in South Korea; the event seems to have brought North and South Korea closer together.
In oil markets, OPEC's monthly report is due later on Monday. The survey covers issues affecting oil markets, touching on supply and demand and providing an outlook for the coming year. The release in tentative though, without a specific time of release.
Technical Analysis: Gold moves further above 1-month low; bullish signal by stochastics in very short-term
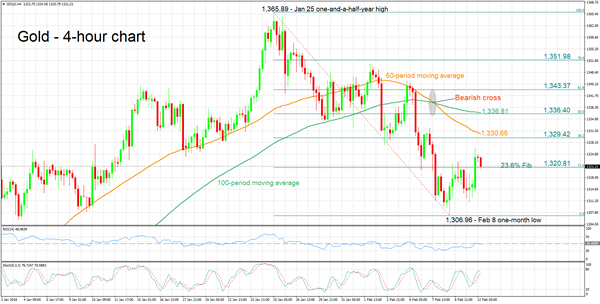
Gold has advanced somewhat after hitting a one-month low of 1,306.96 on February 8.
The RSI started rising after hitting oversold levels on the four-hour chart, potentially signaling a change in momentum in the short-term. The stochastics are giving a bullish signal in the very-short-term: the %K line has crossed above the slow %D one and both lines are heading higher.
A catalyst driving the US currency higher is anticipated to lead to weakness in the dollar-denominated precious metal, with the area around the 23.6% Fibonacci retracement level of the January 25 to February 8 downleg at 1,320.81 potentially acting as immediate support. Price action is at the moment taking place not far above the 23.6% Fibonacci, which was monetarily violated. Further below, the focus would shift to last week's one-month low of 1,306.96.
A weaker greenback on the other hand, could lend support to gold. In this case, resistance might come around the 38.2% Fibonacci at 1,329.42 – the area around this level also encapsulates the 50-period moving average at 1,330.66.
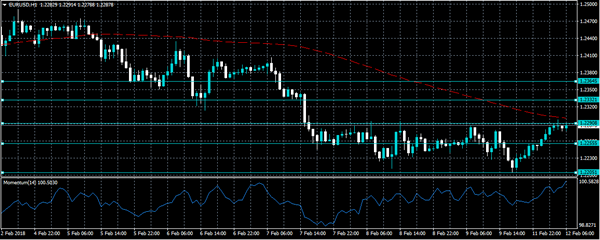
EURUSD Holds Above 1.2200, Bearish Correction In Progress
EURUSD remains under pressure and risk is still to the downside as prices continue to drift lower from the 3-year high of 1.2540. In the weekly timeframe, the world’s most traded currency snapped the seven winning sessions and posted a red candle. The short-term technical indicators seem to be in confusion as the price has been moving higher since today’s Asian session.
Looking at the daily timeframe, the Relative Strength Index (RSI) is sloping slightly to the upside near the 50 level, whilst the MACD oscillator is falling in the positive territory below its trigger line. As a side note, the price is being capped by the 20-day simple moving average, which is holding around 1.2330 at the time of writing.
If price action remains above the strong psychological level of 1.2200, there is scope to test 1.2540 resistance level. Clearing this key level could see additional gains towards the next immediate resistance of 1.2570. This is considered to be a strong resistance area which has been rejected a few times in the previous years.
If 1.2200 support fails, then the focus would shift to the downside towards the 1.2160 support, which is standing near the 40-day SMA. A drop below the latter level, could open the door for the 1.2080. This level is the 23.6% Fibonacci retracement level of the up-leg from 1.0560 to 1.2540 and thus is an important level, which if breached, would increase downside pressure and bring about a reversal of the trend as the ascending trend line would be penetrated.
USD/JPY Downtrend Continuation Only If 108.45 Breaks
The USD/JPY short zig-zag moves since February 7, have formed a clear pattern that suggests possible continuation to the downside. However, we can see steady support within 108.45 zone and if the zone holds we might see a spike first towards 108.90-109.00 POC zone. However, if the price continues with bearish momentum, it needs to break this interim support zone (108.45) and make a clear 1h momentum or 4h candle close below it. If it happens a test of W L3 -108.15 should be next target.
W H3 - Weekly Camarilla Pivot (Weekly Interim Resistance)
W H4 - Weekly Camarilla Pivot (Strong Weekly Resistance)
D H4 - Daily Camarilla Pivot (Very Strong Daily Resistance)
D L3 – Daily Camarilla Pivot (Daily Support)
D L4 – Daily H4 Camarilla (Very Strong Daily Support)
POC - Point Of Confluence (The zone where we expect price to react aka entry zone)
GBPUSD Intraday Gains Likely Above 1.3855
The British pound has recovered upside momentum against the greenback, as the U.S dollar index turns lower towards the key 0.9000 support level. The GBPUSD pair is currently trading around the 1.3855 region, after finding strong support and buying interest from the 1.3760 level on Friday. Going forward, sterling traders are likely to remain cautious ahead of the United Kingdom inflation numbers on Tuesday, as the Consumer Price Index and Producer Price Index are released for the month of January.
The GBPUSD pair is likely to see further upside above the 1.3855 level, key intraday resistance is now found at the 1.3892 and 1.4000 levels.
Should the GBPUSD pair fail to find buyers above the 1.3855 level, we may see a decline back towards the 1.3824 and 1.3875 support levels.
EURUSD Only Intraday Bullish Above 1.2290
The euro currency has opened the new trading week sharply higher against the U.S dollar as risk-on sentiment returns, with European equity markets set to open with triple digit gains. The EURUSD is also being helped by weakness in the U.S dollar index, with price-action now trading around the 1.2290 region, after the pair found strong support at the 1.2205 level on Friday. With a lack of market moving macroeconomic data from the eurozone and the United States on Monday, traders will look to the direction of the U.S dollar index and the broader equity market.
The EURUSD pair will turn intraday bullish only once above the 1.2290 level, further upside towards 1.2332 and 1.2364 then appears likely.
Should EURUSD price-action be contained by the 1.2290 resistance level, we may see a move back towards the 1.2255 and 1.2205 support levels.
Slow Monday Schedule Offers Little In The Way Of Data
From a calendar perspective, the global financial markets will be off to a slow start this week, with only a few important data releases scheduled.
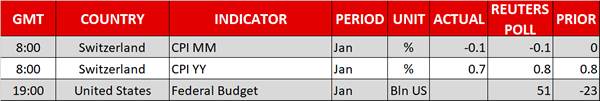
Action begins at 08:00 GMT with a report on Swiss consumer inflation. Switzerland's consumer price index (CPI) is forecast to fall 0.2% in January following a flat-line reading the month before. In annualized terms, this translates into a gain of 0.8%.
Portugal will also release its January CPI report on Monday, with the official data set scheduled for 11:00 GMT.
In North America, the only major data release on the economic calendar is the US Monthly Budget Statement for January. The report is expected to show a budget surplus of $108.8 billion, following a deficit of 23 billion in December.
The calendar of events picks up later in the week with key reports on US inflation and Eurozone gross domestic product (GDP). In the meantime, investors can use the lack of fundamental drivers to reflect on recent turmoil in global equities.
In currencies, the US dollar has managed to recover sharply from multi-year lows, as investors continue to bet on an imminent rate hike by the Federal Reserve. The Federal Open Market Committee (FOMC) will hold its next policy meeting in March. The official rate statement will be accompanied by a revised summary of economic projections covering GDP, unemployment and inflation.
The US dollar index (DXY) was down at the start of Monday trading, falling 0.2% to 90.22. After last week's gains, DXY trimmed its year-to-date loss down to 2%.
EUR/USD
Europe's common currency experienced a broad pullback last week, dragging prices back toward the 1.2200 handle. The EUR/USD bounced back on Monday, gaining 0.2% to 1.2276. However, the pair is down roughly 150 pips from last week's highs north of 1.2400. Furthermore, it is down more than 200 pips from the 1 February high above 1.2500. The pair remains in a general uptrend, but appears to have established a new trading range between 1.2100 and 1.2600.
GBP/USD
Cable fell to nearly four-week lows on Friday, as the dollar rebounded sharply against a basket of world peers. The GBP/USD exchange rate briefly fell below 1.3800 but has since clawed back above those levels. It was last seen trading at 1.3836.
USD/JPY
For all its gains against other currencies, the dollar fell to fresh five-month lows against the yen last week week as prices touched 1.0800 for the first time since September. The yen is clearly benefiting from risk-off sentiment following one of the worst weeks in equities since the financial crisis. The USD/JPY was last seen trading at 108.68, where it was down 0.1% from the previous close.
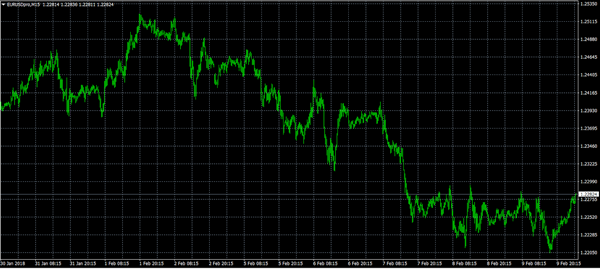
EUR/USD Bullish Rally At 50% Fibonacci Support Zone
The EUR/USD bounced at the 50% Fibonacci level and has broken above the bearish trend channel which could indicate a bullish reversal. Price could be completing a bullish wave 4-5 pattern if price manages to continue above the weekly Pivot Point.
The GBP/USD is showing stronger bearish momentum than the EUR/USD and could confirm one more lower low within a falling wedge chart pattern whereas the USD/JPY remains very corrective and choppy and requires price to either break above resistance or below support on the daily chart before the long-term direction becomes clear.