Sample Category Title
Dollar Headed Down
Dollar headed down
Last week's volatility in equities spurred investors into safe-haven US treasuries, pushing the 10-yr yield from 2.8% down to 2.6%. This Wednesday's US consumer price data, we believe, will come in lower than expected, thanks to easing energy prices. The US economy is growing, but softly, and the bull market, while now wounded, still has room to run.
All told, risk aversion and a downturn in real yields suggest a higher greenback is unlikely near term.
Asian markets to recover
After last week's carnage, we foresee an Asian recovery this week. Hang Seng is now trading at 29'706 points (+0.70%), Shanghai Composite at 3'145 (+0.78%), Kospi at 2'385 (+0.91%) and S&P/ASX 200 at 5'820 (-0.30%), Japan's market is closed for a holiday. Three announcements this week are crucial for maintaining our optimism: US January Consumer Price Index (expected to remain below December's at 2%), Japan's 4Q GDP and Australia's January employment report.
Last week the Dow Jones Industrial Average endured its worst week in two years, decreasing two days by more than 1'000 points, ending the week at 24'190 (-5.50%). Hong Kong's Hang Seng Index lost -9.49%, its biggest decrease since 2008, weakened by energy (-5.21%), real estate (-4.07%), telcos (-3.95%) and financials (-3.87%). China's Shanghai Composite Index was down by -9.60%, its largest weekly loss in a year. Japan's Nikkei 225 Index fell by -8.13%, with losses in most sectors. Korean Kospi index fell by -6.40%, and Australia's S&P/ASX 200 declined 4.63%.
Forex Technical Analysis: EUR/USD, USD/JPY, GBP/USD
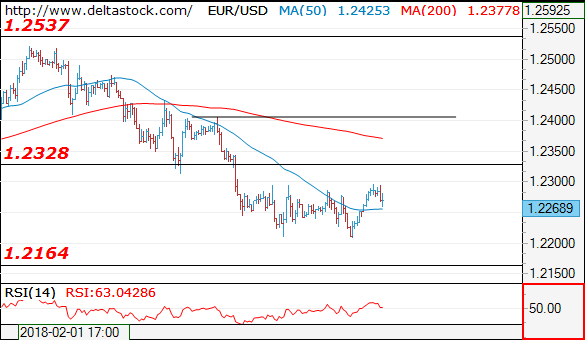
EUR/USD
Current level - 1.2268
The second failure at 1.2210 imposes a risk of another rise to 1.2330 resistance, but while the latter holds, the outlook will remain bearish, for a slide towards 1.2160.
| Resistance | Support | ||
| intraday | intraweek | intraday | intraweek |
| 1.2330 | 1.2540 | 1.2210 | 1.2160 |
| 1.2405 | 1.2870 | 1.2160 | 1.2090 |
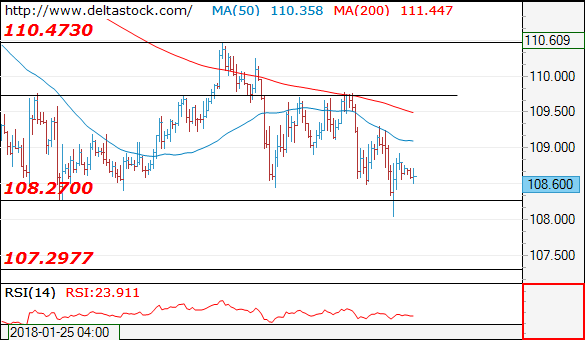
USD/JPY
Current level - 108.60
The dip below 108.27 signals a negative bias, for another slide towards 107.30. Crucial on the upside is 109.30 high and a violation of the latter will signal a renewal of the consolidation trading.
| Resistance | Support | ||
| intraday | intraweek | intraday | intraweek |
| 109.30 | 111.90 | 108.30 | 108.30 |
| 111.50 | 113.40 | 108.30 | 107.30 |
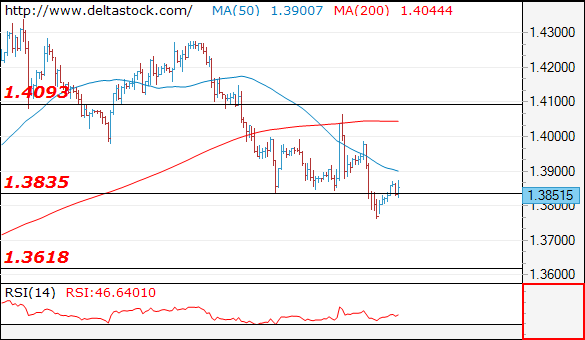
GBP/USD
Current level - 1.3851
The downtrend is intact, heading towards 1.3620 area. Initial intraday resistance lies at 1.3900 and crucial on the upside is 1.3985 high.
| Resistance | Support | ||
| intraday | intraweek | intraday | intraweek |
| 1.3900 | 1.4090 | 1.3730 | 1.3730 |
| 1.3985 | 1.4174 | 1.3620 | 1.3620 |
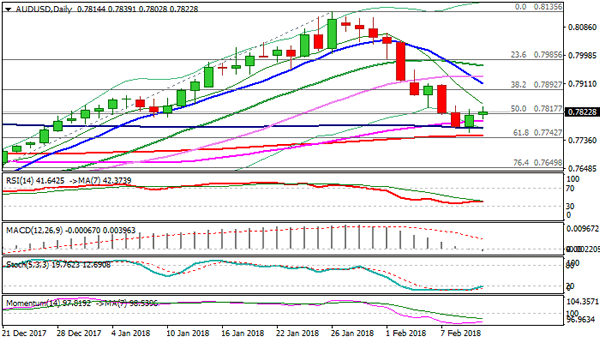
Technical Outlook: AUDUSD – Initial Attempt At Key Daily Cloud Top/200SMA Supports Failed, But Limited Bounce Seen So Far
The Australian dollar trades higher in early Monday's trading after bears stalled above key 200SMA daily cloud top supports.
Subsequent bounce resulted in bullish close on Friday, sidelining immediate downside risk.
Return and close above 55SMA was bullish signal, as the indicators now acts as initial support (0.7797).
Bullish signal is developing on daily slow stochastic emerging from oversold territory, with 14-d momentum turning north in deep negative territory and rising daily cloud underpinning.
However, near-term action was so far unable to clearly break above falling hourly cloud (cloud top currently lies at 0.7823), obstructing recovery attempts, along with mixed signals from lower timeframes (1 & 4-hr).
Stronger recovery signal would be generated on regain of 0.7900 zone pivot (Fibo 38.2% of 0.8135/0.7758 downleg / double upside rejection), while the downside is expected to remain vulnerable while 0.7900 stays intact.
Renewed attempts at key 0.7750/40 zone (daily cloud top / 200SMA / Fibo 61.8% of 0.7500/0.8135 rally) would soften near-term structure, with strong bearish signal to be expected on firm break lower.
Res: 0.7843, 0.7910, 0.7937, 0.7947
Sup: 0.7797, 0.7772, 0.7750, 0.7740
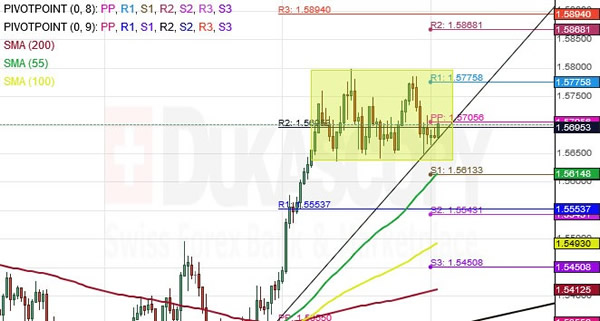
EUR/AUD 4H Chart: Formed A Flag
The Euro has extended its gains against the Australian Dollar. The currency pair continued to trade in the same pattern after it touched the lower boundary of the dominant channel at the 1.3663 mark.
As it can be observed, the EUR/AUD pair has formed a flag and is likely to breakout from the rectangle to either direction.
Technical indicators suggest that the currency exchange rate could continue its movement north to test the resistance cluster of the weekly R2 and the monthly R3 near 1.5868.
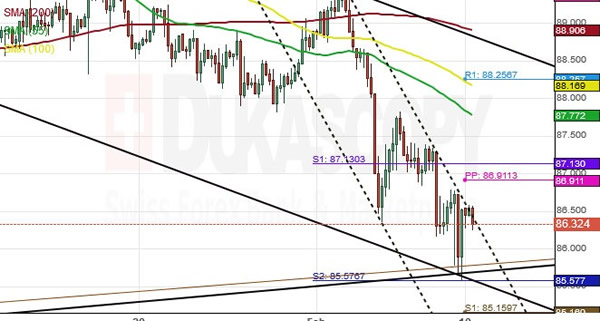
CAD/JPY 4H Chart: Trading Short
The Canadian Dollar has extended its decline against other major currencies during the previous trading sessions. However, the decline can be observed notably in the CAD/JPY chart.
The Loonie is trading in a narrow channel against the Yen. The pair has re-tested the upper boundary of the junior channel.
As for the near future, the currency exchange rate could be a false breakout upwards to test the weekly and the monthly resistance near 86.91. Meanwhile, the overall market sentiment remains bearish.
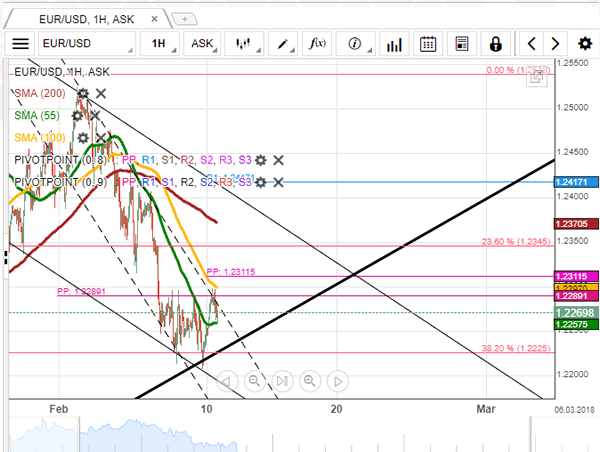
EUR/USD Analysis: Likely To Appreciate Today
The common European currency remained stable against the Greenback on Friday, as it was confined within the bounds of the 32.20% Fibo retracement and the monthly PP at 1.2225 and 1.2289, respectively.
The pair breaching the 55-hour SMA near 1.2250 could point to a soon period of appreciation. This is likewise supported by other indications, such as the slight two-day consolidation after a week of decline, as well as the Euro's reversal from the 38.20% Fibo and the bottom boundary of a three-month channel up. Thus, it could be assumed that the rate will try to push up to the 23.60% retracement line at 1.2345, at least.
This scenario, however, could be hindered by the combined resistance of the weekly and monthly PPs and the 100-hour SMA in the 1.2290/1.2312 area.
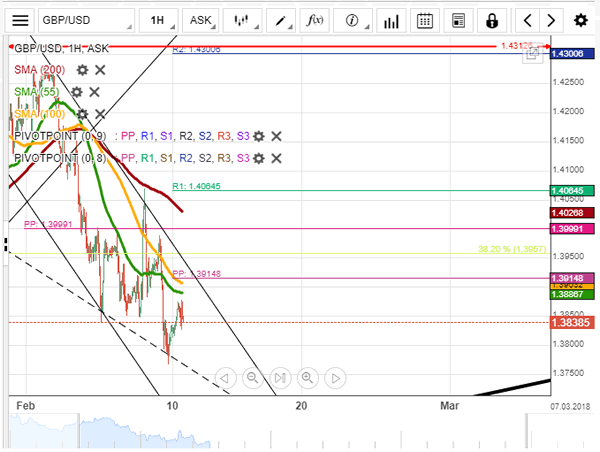
GBP/USD Analysis: Restricted By Strong Resistance
Friday's morning session was spent relatively calm for GBP/USD, as it was restricted from both sides by the 55– and 100-hour SMAs.
The bearish sentiment, reinforced by sluggish UK fundamentals, eventually took over the market, thus resulting in a 153-pip plunge in a couple of hours. This fall halted near the February low of 1.38. The pair's subsequent movement was tended north towards a resistance cluster formed by the 55– and 100-hour SMAs and the weekly PP circa 1.39.
This trading session should be quiet in terms of fundamentals; thus, the Sterling might lack the necessary bullish momentum to move past its nearest resistance. A successful breakout should be stopped near the monthly PP at 1.40.
Meanwhile, a potential southern barrier could be the weekly and monthly S1s at 1.3675.
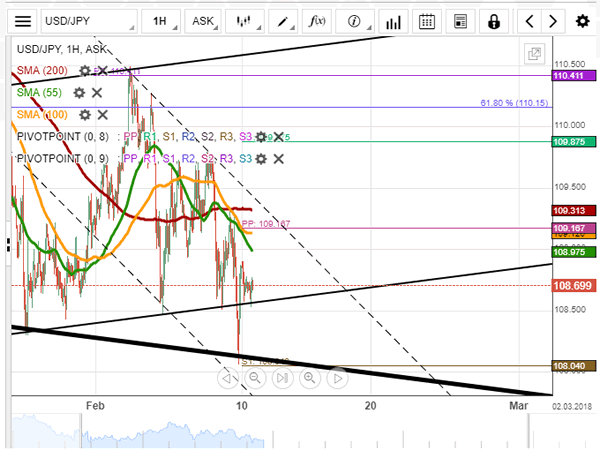
USD/JPY Analysis: Could Remain Stable
The US Dollar was fluctuating considerably against the Yen during the previous trading session. The pair tried to edge higher in the morning but was stopped by the strong resistance of the 55-, 100– and 200-hour SMAs. It subsequently fell down to the 108.30 mark—slightly above the bottom boundary of a medium-term channel.
The US Dollar might still appreciate in this session; however, gains should be limited by the aforementioned SMAs and the weekly PP near the 109.20 mark. This could pressure the pair down to the weekly S1 at 108.00.
Given that there is a bank holiday in Japan and no fundamentals coming from the United States, this session could mark no major changes to the pair's current position, unless high turbulence in the equities market result in higher demand for the Yen.
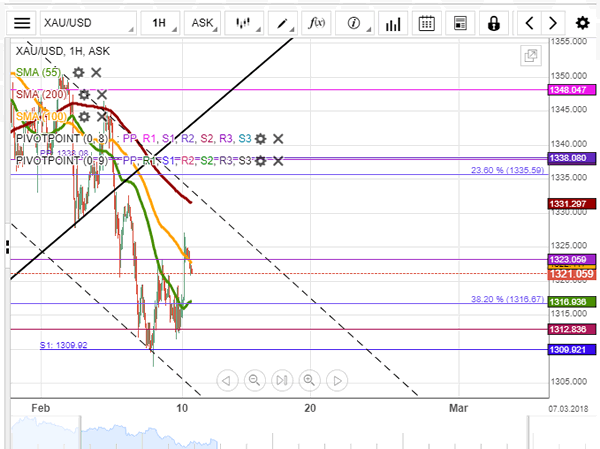
XAU/USD Analysis: Shows Slight Upside Potential
The 55-hour SMA was pressuring XAU/USD from the upside for the whole session on Friday. However, the pair remaining close to this line did suggest that an upside breakout might be due in the nearest time. This necessary push for bulls occurred during the Asian session when Gold shot up by 0.53% in one hour up to the resistance of the 100-hour SMA and the weekly PP near the 1,325.00 mark.
It is likely that the pair consolidates for a brief period of time prior to re-gaining its upside momentum and pushing even higher in this session. Gains should be capped circa 1,335.00 where the upper boundary of a three-week descending channel, the 200-hour SMA and the 23.60% Fibo retracement line are located.
In case the 100-hour is not breached, the pair is expected to find support at 1,310.00.
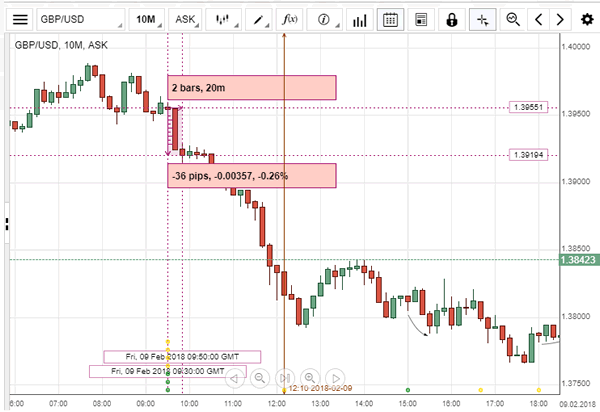
GBP/USD: UK Manufacturing Production
The Sterling depreciated against the US Dollar, following factory output data on Friday. The GBP/USD exchange rate lost 36 pips or 0.26% in the next half an hour, though the downtrend was weakened by the NIESR GDP estimate report.
The UK industrial output fell by the most since 2012 in the month of December, as the main oil pipeline was shut down temporarily, but the manufacturing growth confirmed the economy's strong expansion pace at the 2017 end. The separate report by the National Institute of Economic and Social Research showed that Britain's economy expanded 0.5% in the three month period ending in January, supporting the 1.9% annual growth rate forecast, slightly faster than the BoE anticipated.