Sample Category Title
Technical Outlook: NZDUSD – Bids At 0.73 Hold Dips Ahead Of RBNZ
The Kiwi dollar eased from the session high at 0.7345, posted after solid NZ jobs report, released late Tuesday.
Renewed attempt at Tuesday’s 0.7350 high, hit after strong rally (the biggest one-day gains since 13 Dec) failed, with fresh easing testing bids at 0.7300 zone (rising 20SMA / psychological support).
Loss of 0.7300 handle would risk dip towards key near-term support at 0.7256 (06 Feb correction low, reinforced by rising daily Kijun-sen and broken weekly 200SMA).
Weakening daily momentum studies and south-heading daily RSI maintain pressure, as upside attempts repeatedly failed to clearly break above the top of thick falling hourly cloud.
Stronger correction of 0.6821/0.7436 (08 Dec / 24 Jan rally) could be expected on loss of 0.7256 pivot, which would expose next strong supports at 0.7201 (Fibo 38.2% of 0.6821/0.7436) and 0.7143 (200SMA) in extension.
Bullish scenario requires sustained break above daily Tenkan-sen at 0.7338 to turn near-term focus higher.
RBNZ rate decision is due later today, with central bank expected to keep interest rates unchanged at 1.75% (the RBNZ keeps overnight cash rate at the lowest levels since 1999 and maintains 1.75% rate since late 2016).
Res: 0.7338, 0.7350, 0.7370, 0.7405
Sup: 0.7291, 0.7256, 0.7201, 0.7143
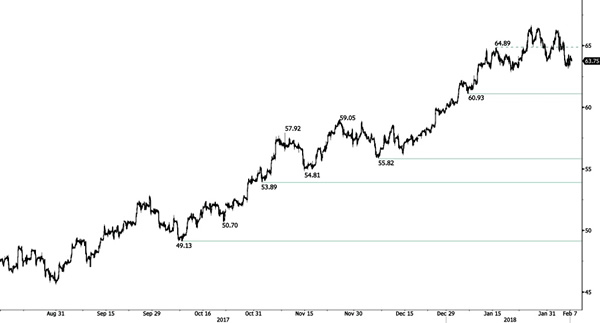
CRUDE OIL Neutral
Crude oil gives signs of stability. Strong support is given at 60.93 (05/01/2018 low). Expected to keep increasing as demand remains strong.
In the long-term, crude oil has recovered after its sharp decline last year. However, we consider that further weakness is very likely. For the time being the pair lies in an upside trend since June 2017. Support lies at 42.20 (16/11/2016) while resistance is located at 77.83 (20/11/2014). Crude oil is trading largely above its 200 DMA.
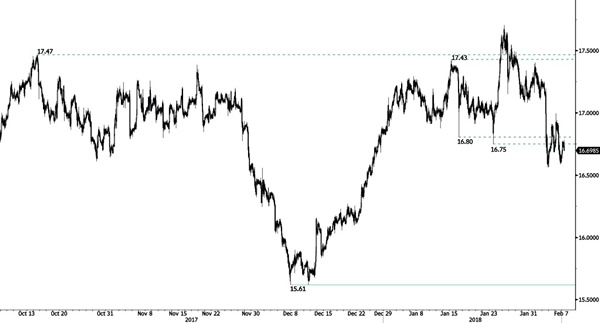
SILVER Short-Term Selling Pressure
Silver is heading lower and trades below 17. The short-term technical structure is turning negative. Hourly resistance lies at 18.21 (08/09/2017 high). The technical structure suggests further short-term decrease.
In the long-term, the trend remains negative/ sideways. Further downside is very likely. The pair is trading slightly above its 200 DMA. Resistance is located at 21.58 (10/07/2014 high). Strong support can be found at 11.75 (20/04/2009).
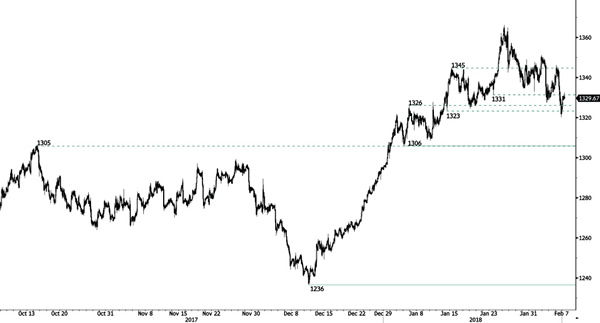
GOLD Profit-Taking
Gold is trading lower following yesterday's contraction. Hourly support at 1'323 (12/01/2018 low) is now broken while further support remains at 1'306 (12/01/2018 low). The technical structure suggests however further sideways moves.
In the long-term, the technical structure suggests that there is a growing upside momentum. A break of 1'392 (17/03/2014) is required to confirm it. A major support can be found at 1'045 (05/02/2010 low).
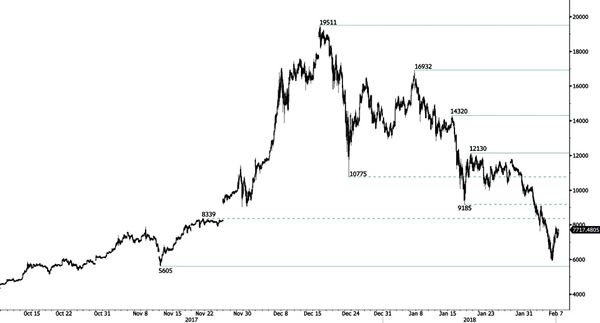
BITCOIN Bullish Breakout
Bitcoin is retracing above 7'500, heading towards 8'339 (21/11/2017 high). Hourly support at 5'605 (13/11/2017 low) is distanced. Hourly resistance remains at 12'130 (18/01/2018 high). The short-term technical structure suggests upside moves.
In the long-term, the digital currency has had an exponential growth but also presented important downturns. There is decent likelihood that the currency could stabilize between 7'000 - 12'000 in 2018. Bitcoin is trading above its 200 DMA (6'000 range).
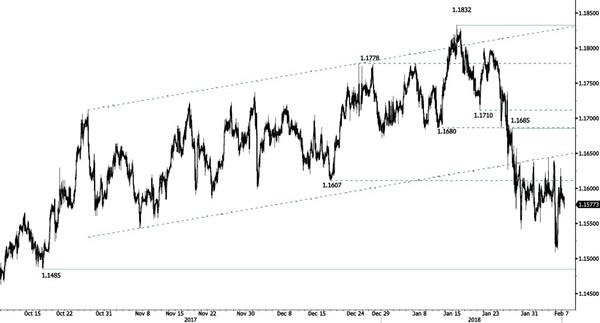
EUR/CHF Consolidating At 1.1575
EUR/CHF buying pressure pauses. Hourly resistance is given at 1.1685 (26/01/2018 high). Expected to show further short-term upside moves.
In the longer term, the technical structure has reversed. Strong resistance is given at 1.20 (level before the unpeg). Yet, the ECB's slowing QE program is likely to cause buying pressures on the euro, which should weigh in favour of the EUR/CHF. Supports can be found at 1.0184 (28/01/2015 low) and 1.0082 (27/01/2015 low).
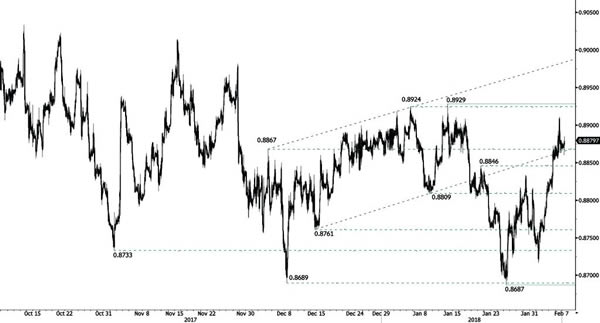
EUR/GBP Waiting For Another Leg Higher
EUR/GBP is trading mixed but seems heading towards hourly resistance at 0.8929 (12/01/2018 high) while hourly support at 0.8687 (25/01/2018) is distanced. The technical structure suggests further short-term upside move.
In the long-term, the pair has largely recovered from lows in 2015. The technical structure suggests further upside pressure. The pair is trading above the range of its 200 DMA. Strong resistance can be found at 0.9500 (psychological level).
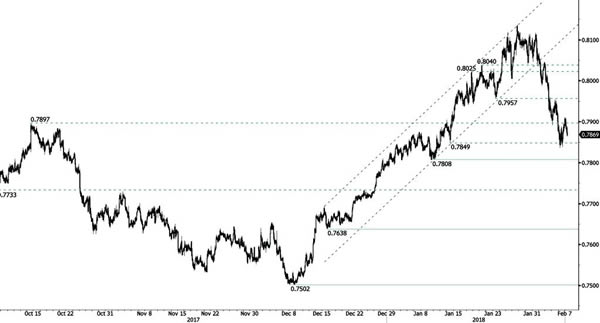
AUD/USD Slight Increase
AUD/USD is slowly recovering from its recent decline. Hourly resistance is now at 0.7808 (01/09/2018 low). The technical structure suggests short-term increase.
In the long-term, the trend is turning positive, yet fails reaching key resistance at 0.8164 (14/05/2015 low). Key support stands at 0.6009 (31/10/2008 low). A break of the key resistance at 0.8164 (14/05/2015 high) is needed to invalidate our long-term bearish view.
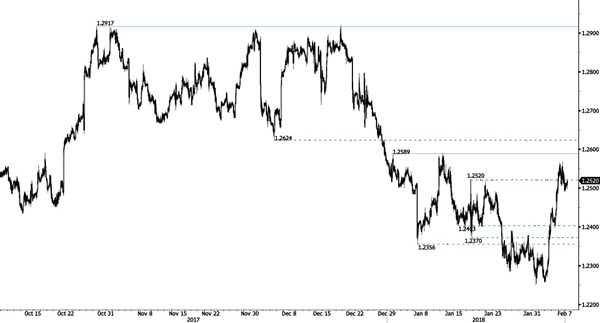
USD/CAD Edging Lower
USD/CAD is trading lower after outreaching 1.2520 (17/01/2018 high) yesterday. Resistance is now given at 1.2589 (01/01/2018). The technical structure indicates that further short-term weakness is expected.
In the longer term, the pair is trading between resistance point at 1.3805 (05/05/2017 high) and support at 1.2128 (18/06/2015 low). Strong resistance is given at 1.4690 (22/01/2016 high). The pair is likely to head lower. The pairs is trading below 200 DMA
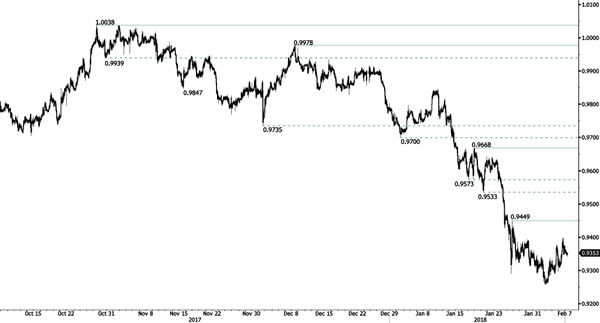
USD/CHF Rise Continues
USD/CHF is strengthening. Hourly resistance is at 0.9449 (25/01/2018 high). Expected to show further short-term upside move.
In the long-term, the pair is still trading in range since 2011 despite some turmoil when the SNB unpegged the CHF. Support at 0.9259 (24/08/2015 low) is attainable. Key support remains at 0.9072 (07/05/2015 low) while resistance at 1.0344 (15/12/2016 high) is distanced. The technical structure favours a long term bullish bias since the unpeg in January 2015.