
Sample Category Title
Is The 37 Year Bullish Bond Market Ending?
The bond market has enjoyed a strong bull market for nearly four decades with yields continuing to go lower. The bull market has been going on for so long that no current active fund manager can imagine what it looks like when interest rates were to be like the 1980s at 20%. If people in the 1980s started trading in their early thirties, they would have been almost 70 years old by now, so chances are they are not active in the market anymore.
The dot com bubble and 2008 financial crisis continue to turbocharge the great bond bull rally with central banks cutting interest rates around the world and multitrillion-dollar-bond-buying programmes. However, the period of easy money could be ending this year. The Fed, ECB, Bank of Japan have all started to taper their bond purchase program. The Fed is the first one to stop the bond buying program and it's also the first to embark in balance sheet normalization, or QT (Quantitative Tightening). As Central Banks have been big buyers of bonds for the past decade, questions arise as to whether this shift to tapering would finally prompt the great bull market to end.
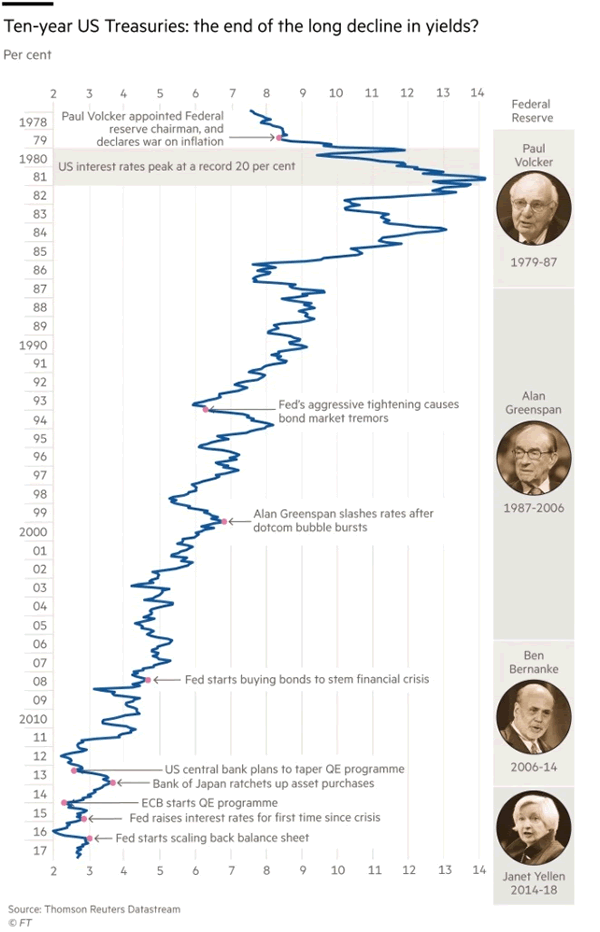
The markets have enjoyed monetary support from global central banks for the past 10 years. When the Federal Reserve stopped its quantitative easing programme in 2014, the Bank of Japan took the baton with an even bigger scheme. When the Fed started raising rates in 2015, the European Central Bank (ECB) started a new quantitative easing programme. Last year, Central Banks bought $1.5 trillion of bonds.
But this year investors for the first time in a decade, central banks can be withdrawing money from the market. The Fed has started to slowly shrink its balance sheet last year. This month, the ECB's bond buying reduced by half to €30 billion a month and the programme would likely end this year. Bank of Japan's purchase of long-dated bonds had also slowed.
Indeed the bond market has started to decline and as a result the yields have been going up as the charts below show:
Weekly Chart of 10 Year Notes (ZN_F)
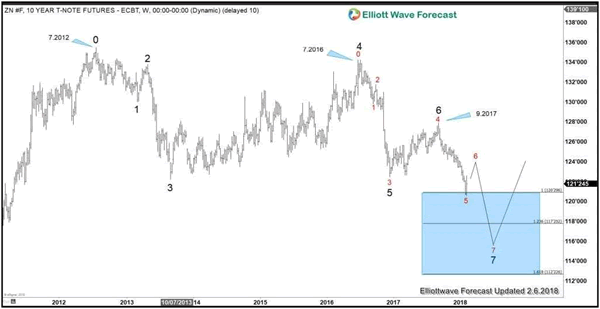
Ten Year Note (ZN_F) shows a bearish sequence from 7.2012 high (135.15) as well as from 7.2016 high (131.35). The instrument shows 7 swing sequence (in black color) from 7.2012 high and the minimum 100% target at 120.3 has been reached. However, there is another sequence (red color) starting from 7.2016 high and this sequence only shows 5 swing, thus another leg lower is expected to end 7 swing from 7.2016 high and also 7 swing from 7.2012 high.
TNX (10 Year Yields) Daily Chart
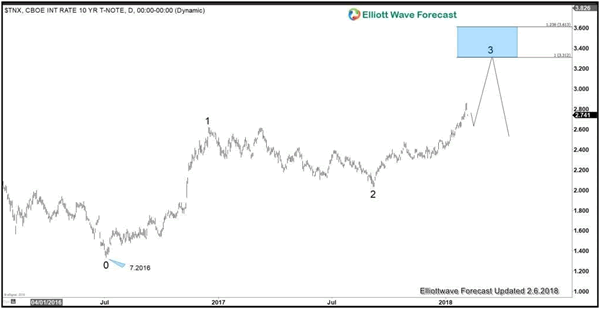
10 Year Yields (TNX) is the inverse of ZN_F (10 Year Notes) and the yield shows 3 swing bullish sequence (higher high) from 7.2016 low. 10 year yields potentially can target 3.31 - 3.61% this year to end the third swing. Thus the charts above suggest that 10 Year Notes will continue to sell and 10 year yields will continue to rise this year.
But the bigger question is whether the 38 year bull market in the bonds has ended. We will look at the two long term charts of TNX below: One using linear scale and another one using logarithmic scale
Long Term Charts of 10 Year Yields (TNX) Linear Scale
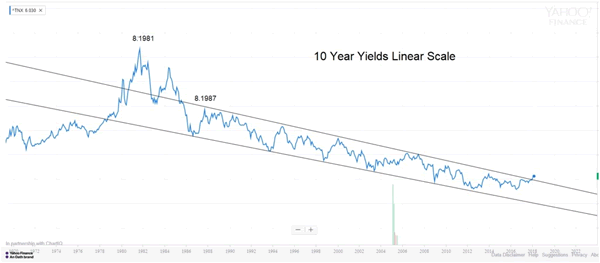
Looking at the long term charts of 10 year Yields since the 8.1981 high (15.84)%, we can see that the yields have broken above the parallel channel drawn from 8.1987 high. At first glance, this suggests the possibility that the yields may have ended cycle from 8.1987 high and possibly from 8.1981 high as well. However, since we are looking at very long term chart, it's useful to also look at it using logarithmic scale, which is usually more accurate for a long term chart
Long Term Charts of 10 Year Yields (TNX) Logarithmic Scale
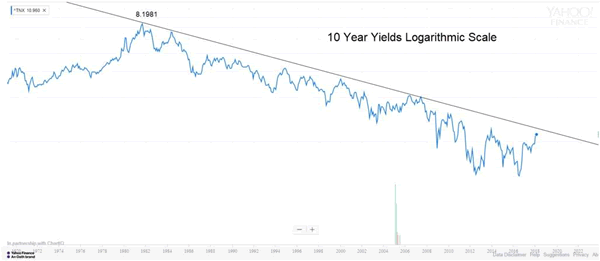
Looking at 10 year yields with logarithmic scale, we can draw a trend line from 8.1981 high and so far the yields have not broken and closed above it which comes around 3.05 - 3.10% and descending by 0.05% every month approximately.
Since usually logarithmic scale is more relevant in long term charts, the 10 year yields need to break and close above 3.1% with conviction before the 38 year bull market in the bond could be considered ending.
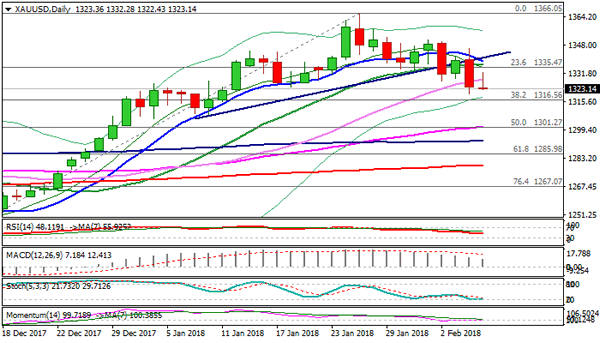
Spot Gold – Tuesday’s Bearish Outside Day Maintains Pressure and Signals Further Easing
GOLD
Spot Gold stands at the back foot on Wednesday, following limited recovery after strong fall previous day, which hit new three-week low at $1320. Bearish outside day on Tuesday was negative signal and bear-leg from $1366 (25 Jan peak) could extend towards next target at $1316 (Fibo 38.2% of $1236/$1366), as daily techs are bearishly aligned. Performance of global stocks, as the source of recent turbulent movements in the markets, remains in focus. Further recovery of stock prices could pressure gold price for stronger retracement of $1236/$1366 rally. Completion of asymmetric H&S pattern on daily chart was strong bearish signal which could be boosted by break below $1316 Fibo support for extension towards $1301 (50% of $1236/$1366/55SMA) and $1293 (100SMA) in extension). Broken 30SMA marks initial barrier at $1328, with extended upticks expected to stay below $1337 (broken 20SMA) to keep bearish near-term structure intact.
Res: 1328; 1332; 1337; 1340
Sup: 1322; 1320; 1316; 1308
Canadian Dollar Steady, Building Permits Crushes Estimate
The Canadian dollar has posted small losses in the Wednesday session. Currently, the pair is trading at 1.2515, up 0.17% on the day. On the release front, Canadian Building Permits posted an excellent gain of 4.8%, compared t0 the estimate of 2.1%. There are no key releases out of the US. On Thursday, the US publishes unemployment claims.
It's been a volatile week on the stock markets, and the US dollar has taken advantage, posting broad gains. The Canadian dollar has lost ground this week, down close to 1.0%. On Monday, the Dow Jones posted its biggest one-day loss on Monday. The markets were back in green territory on Tuesday. A key factor in the stock market slide was strong employment numbers on Friday, as nonfarm payrolls and wage growth reports beat their estimates. Investors shied away from the stock markets, concerned that the sharp data could lead to higher inflation, which in turn would result in more rate hikes this year. Higher interest rates make the US dollar more attractive for investors, at the expense of other currencies.
Canadian indicators disappointed on Tuesday. Canada's trade deficit widened from C$2.5 billion to C$3.2 billion, well above the estimate of C$2.3 billion. The export sector has been steady, but uncertainty over NAFTA is a dark cloud over the economy, and exports could suffer if the trilateral free trade pact is not renewed. The US has threatened to leave the pact if the Canada and Mexico do not agree to major concessions, such as increasing the percentage of US content in auto parts produced under NAFTA. Elsewhere, Canadian Ivey PMI continues to point to expansion, but slowed to 55.2, down from 60.4 in the previous release. This was well off the forecast of 60.7 points.
The Janet Yellen era is over at the Federal Reserve. On the weekend, Jerome Powell took over as chair, replacing Yellen. On Friday, Yellen waxed optimistic about the economy, saying that strong growth, a red-hot labor market and increased wage growth would require the Fed to gradually raise interest rates. Powell is expected to continue to Yellen's policies, so the markets are not expecting any dramatic shifts. However, the massive US tax cut will have a strong impact on the US economy, and the markets will be looking to the Fed for guidance. If the Fed sounds optimistic about the tax reform package, the US dollar could move higher.
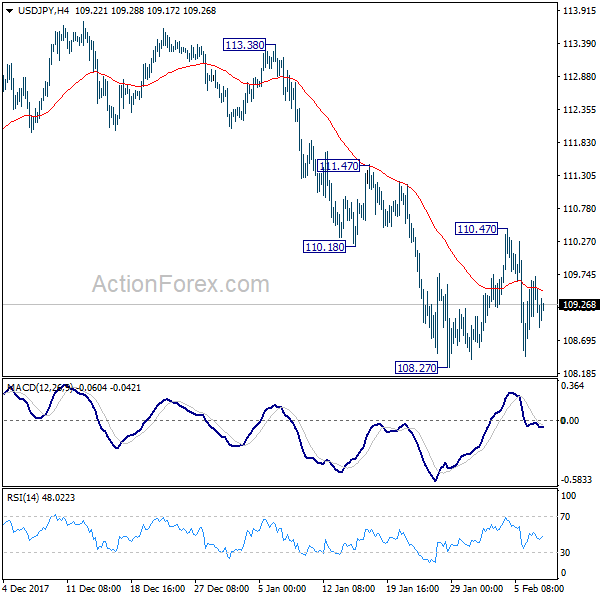
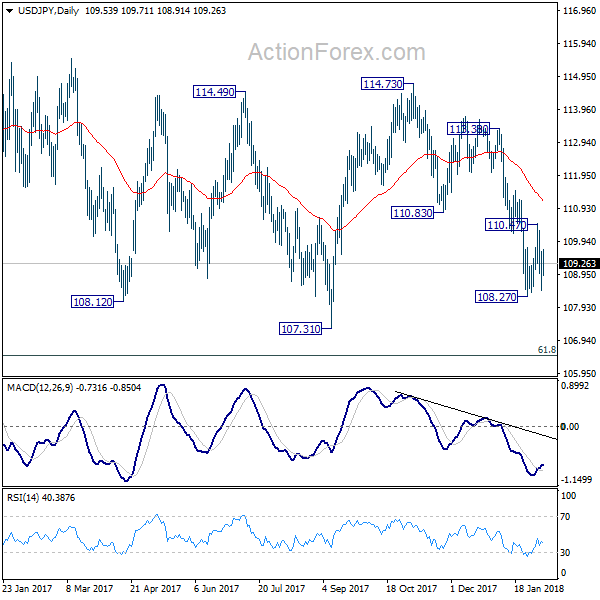
USD/JPY Mid-Day Outlook
Daily Pivots: (S1) 108.78; (P) 109.22; (R1) 109.98; More...
Intraday bias in USD/JPY remains neutral at this point. As noted before, larger decline from 114.73 is possibly still in progress. Break of 108.27 will also resume the medium term correction from 118.65. That will send USD/JPY through 107.31 to 106.48 fibonacci level. Nonetheless, above 110.47 will turn intraday bias back to the upside and bring stronger rebound.
In the bigger picture, current development argues that the corrective pattern from 118.65 is extending. There is risk of dropping further to 61.8% retracement of 98.97 to 118.65 at 106.48. But this level should provide strong support to contain downside and bring resumption of rise from 98.97. However, sustained break of 106.48 will now likely send USD/JPY through 98.97 to resume the corrective fall from 125.85 (2015 high).
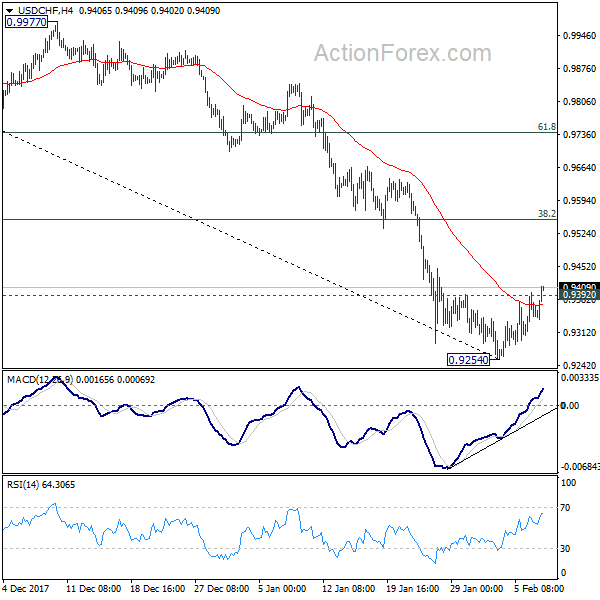
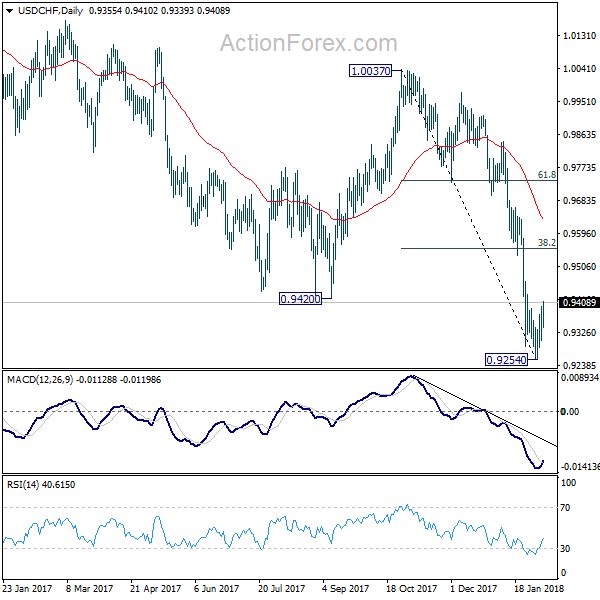
USD/CHF Mid-Day Outlook
Daily Pivots: (S1) 0.9259; (P) 0.9298; (R1) 0.9345; More...
The break of 0.9392 minor resistance suggests short term bottoming in USD/CHF. Intraday bias is turned back to the upside for recovery to 38.2% retracement of 1.0037 to 0.9254 at 0.9553 first. At this point, there is no clear sign of trend reversal yet. We'd be cautious on strong resistance from 0.9553 to limit upside and bring decline resumption. ON the downside, break of 0.9254 will resume larger down trend from 1.0342.
In the bigger picture, the strong break of 0.9420 support suggests that fall from 1.0342 is developing into a medium term down trend. Deeper fall should be seen to 100% projection of 1.0342 to 0.9420 from 1.0037 at 0.9115. Break will target 161.8% projection at 0.8545. In any case, break of 0.9640 resistance is needed to be the first sign of medium term bottoming. Otherwise, outlook will stay bearish even in case of strong rebound.
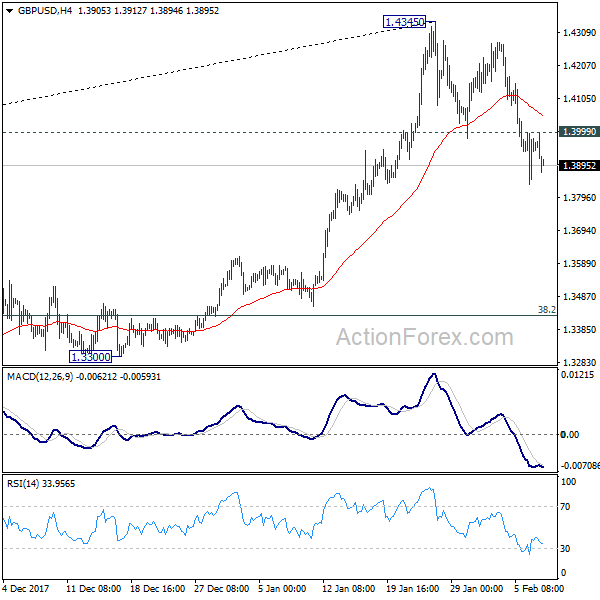
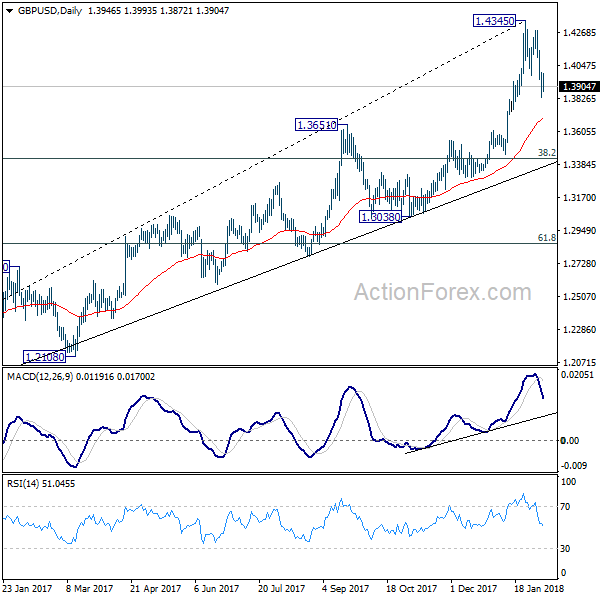
GBP/USD Mid-Day Outlook
Daily Pivots: (S1) 1.3856; (P) 1.3927; (R1) 1.4020; More.....
With 1.3999 minor resistance intact, intraday bias in GBP/USD remains on the downside. The decline from 1.4345 short term top would extend to 1.3651 resistance turned support. For the moment, it's unsure whether the decline is correcting rise from 1.3038, or that from 1.1946, or it's reversing the trend. Break of 1.3651 will turn focus to key fibonacci level at 1.3429. On the upside, above 1.3999 minor resistance will turn intraday bias neutral first.
In the bigger picture, sustained break of 1.3835 key resistance level indicates that rebound from 1.1946 is at least correcting the long term down from from 2007 high at 2.1161. Further rise should now be seen back to 38.2% retracement of 2.1161 (2007 high) to 1.1946 (2016 low) at 1.5466. Medium term outlook will stay bullish 38.2% retracement of 1.1946 to 1.4345 at 1.3429, in case of deep pull back.
EUR/USD Mid-Day Outlook
Daily Pivots: (S1) 1.2315; (P) 1.2374 (R1) 1.2436; More....
EUR/USD weakens mildly in early US session. But after all, it's staying in consolidation pattern from 1.2537 and intraday bias remains neutral. As long as 1.2222 support holds, further rise is in favor. Sustained break of 1.2494/2516 will target 100% projection of 1.0569 to 1.2091 from 1.1553 at 1.3075 next. However, break of 1.2222 will indicate rejection from 1.2494/2516, on bearish divergence condition in 4 hour MACD, and turn near term outlook bearish for 1.1915 support first.
In the bigger picture, rise from 1.0339 medium term bottom is still seen as a corrective move for the moment. But key fibonacci level at 38.2% retracement of 1.6039 (2008 high) to 1.0339 (2017 low) at 1.2516 is looking vulnerable. Sustained break of 1.2516 will carry larger bullish implication and target 61.8% retracement of 1.6039 to 1.0339 at 1.3862. Nonetheless, rejection from 1.2516 will maintain long term bearish outlook and keep the case for retesting 1.0039 alive.


Dollar Generally Higher as Stocks Markets Recovered
Dollar is generally firmer today, except versus Yen as global markets stabilized. At the time of writing, DAX is trading up 0.8%, CAC 40 up 0.6% and FTSE up 0.8%. US futures point to a slightly lower open but loss will be limited initial trading. Euro is also mildly firmer as sup[ported by positive news from EU. On the other hand, Aussie and Kiwi are trading as the weakest ones. In particular, Kiwi is back under some pressure ahead of tomorrow's RBNZ rate decision.
EC upgrades Eurozone growth forecast
European Commission raised Eurozone growth forecast in today's report. 2018 GDP is projected to grow 2.3%, up from November forecast of 2.1%. 2019 GDP is projected to grow 2.0%. For EU excluding UK, GDP growth is seen at 2.5% in 2018 and 2.1% in 2019. UK is projected to grow 1.4% in 2018. Eurozone inflation is projected to be at 1.5% in 2018 and 1.6% in 2019. Both figures are below ECB's 2% target. EU economic affairs commissioner Pierre Moscovici said that "Europe's economy has entered 2018 in robust health" and "growth is also more balanced than it was a decade ago."
Germany: Grand coalition deal finally agreed
German Chancellor's CDU/CSU finally closed the deal with the SPD to reform the grand coalition government. That came after three days of "extra time" negotiations. A formal announcement will be made later today, including the details of the coalition. Next, SPD members are expected to vote on whether to accept the coalition agreement. The results of the vote are expected by March 4.
ECB Lautenschlaeger: Banks must be ready for Brexit
ECB Executive Board member Sabine Lautenschlaeger urged that "banks must be ready for Brexit; it will happen." And, "any bank that wishes to relocate from the UK to the euro area should really have submitted its license application already." Also, "if it hasn't, it should do so by the end of the second quarter of 2018 at the latest." Regarding the so called transition period, Lautenschlaeger noted that "we cannot be sure whether the transition period will really happen".
On the data front
Canada building permits rose 4.8% mom in December. Swiss foreign currency reserves dropped to CHF 731b in January. German industrial production dropped -0.5% mom in December. Japan leading indicator dropped to 107.9 in December, labor cash earnings rose 0.7% yoy.
New Zealand job data won't change RBNZ neutral stance
New Zealand employment rose 0.5% qoq in Q4, slowed from Q3's 2.2% qoq but beat expectation of 0.4% qoq. Unemployment rate dropped to 4.5%, down from 4.6% and was better than expectation of 4.7%. The unemployment rate was also the lowest in 9 years since 2008. The news is certainly welcomed by RBNZ ahead of the rate decision on Thursday. Nonetheless, no one is expecting any change to the 1.75% official cash rate. There is however a risk that RBNZ would try to talk down the exchange rate after recent appreciations.
EUR/USD Mid-Day Outlook
Daily Pivots: (S1) 1.2315; (P) 1.2374 (R1) 1.2436; More....
EUR/USD weakens mildly in early US session. But after all, it's staying in consolidation pattern from 1.2537 and intraday bias remains neutral. As long as 1.2222 support holds, further rise is in favor. Sustained break of 1.2494/2516 will target 100% projection of 1.0569 to 1.2091 from 1.1553 at 1.3075 next. However, break of 1.2222 will indicate rejection from 1.2494/2516, on bearish divergence condition in 4 hour MACD, and turn near term outlook bearish for 1.1915 support first.
In the bigger picture, rise from 1.0339 medium term bottom is still seen as a corrective move for the moment. But key fibonacci level at 38.2% retracement of 1.6039 (2008 high) to 1.0339 (2017 low) at 1.2516 is looking vulnerable. Sustained break of 1.2516 will carry larger bullish implication and target 61.8% retracement of 1.6039 to 1.0339 at 1.3862. Nonetheless, rejection from 1.2516 will maintain long term bearish outlook and keep the case for retesting 1.0039 alive.
Economic Indicators Update
| GMT | Ccy | Events | Actual | Forecast | Previous | Revised |
|---|---|---|---|---|---|---|
| 21:45 | NZD | Employment Change Q/Q Q4 | 0.50% | 0.40% | 2.20% | |
| 21:45 | NZD | Unemployment Rate Q4 | 4.50% | 4.70% | 4.60% | |
| 00:00 | JPY | Labor Cash Earnings Y/Y Dec | 0.70% | 0.60% | 0.90% | |
| 05:00 | JPY | Leading Index CI Dec P | 107.9 | 108.1 | 108.3 | |
| 07:00 | EUR | German Industrial Production M/M Dec | -0.60% | -0.50% | 3.40% | 3.10% |
| 08:00 | CHF | Foreign Currency Reserves Jan | 731B | 744B | ||
| 13:30 | CAD | Building Permits M/M Dec | 4.80% | 2.00% | -7.70% | |
| 15:30 | USD | Crude Oil Inventories | 6.8M |
GOLD: Bearish, Remains Vulnerable
GOLD: The commodity turned lower on sell on Tuesday and was seen following through on Wednesday. On the downside, support comes in at the 1,320.00 level where a break will turn attention to the 1,310.00 level. Further down, a cut through here will open the door for a move lower towards the 1,300.00 level. Below here if seen could trigger further downside pressure towards the 1,290.00 level. Conversely, resistance resides at the 1,350.00 level where a break will aim at the 1,360.00 level. A turn above there will expose the 1,370.00 level. Further out, resistance stands at the 1,380.00 level. All in all, GOLD looks to weaken further.

DAX Recovers After Falling to 5-Month Low
The DAX index has posted gains in the Wednesday session. Currently, the index is trading at 12,490.00, up 0.79% on the day. On the release front, German Industrial Production declined 0.6%, close to the estimate of -0.7%. This marked the third decline in four months. On Thursday, Germany releases Trade Balance.
It's been a volatile week for global stock markets, and the DAX has not been immune. The index declined 4.2% last week, as a sharp decline in Deutsche Bank shares sent European stock markets lower on Friday. The slide continued this week, as strong US employment numbers raised concerns of higher inflation and additional rate hikes by the Federal Reserve. Higher US rates would be bad news for European stock markets, as investors would be attracted to dollar-denominated assets. US stock markets were in red territory on Monday, and the Dow Jones posted its biggest one-day loss ever. However, US stock markets rebounded on Tuesday and the trend has continued in the Asian and European markets on Wednesday.
Germany is close to a new government, as the socialist SDP and Angela Merkel's conservatives are expected to announce an agreement later on Wednesday. Merkel has made major concessions in order to reach a deal, including giving the SDP the powerful finance ministry. This would likely mark a shift in Germany's eurozone policy, which had been marked by a conservative stance under former finance minister Wolfgang Schaeuble. Members of the eurozone that have been struggling, such as Greece, will likely get a more sympathetic ear from the SDP than they did from Schauble. The coalition agreement still requires the consent of a majority of the 464,000 members of the SDP.
The German economy continues to shine, despite the ongoing coalition negotiations, which have dragged on since September. A spokesman for the SPD party, which is negotiating with Angela Merkel's conservative bloc, said on Tuesday that a deal is "90-95%" done. For her part, Merkel has said that she is willing to make painful concessions in order to form a government. Both parties have stated that they want to reach an agreement on Tuesday. If there is an announcement later in the day, the euro could move higher.