Sample Category Title
Market Jitters Remain
Market Jitters Remain
US stocks toppled again on Wednesday in choppy and messy fashion after a dispirited US Treasury auction revived concerns about a hawkish Fed, unnerving investors already spooked after the rapid climb in US Treasuries apparently ignited a jump in the Cboe Volatility index.
A deplorable auction with meek demand pushed yields on 10-year US Treasuries to 2.84 percent, up four basis points, with traders now eyeing Monday’s a four-year high of 2.88 percent.
The market is now hedging against the Fed potentially leaning more hawkish which is explaining the uptick in USD and US yields.
There was a glimmer of hope earlier in the NY session that equities markets were finding a happy medium, but the equilibrium shattered as optimism gave way to more selling when Federal Reserve Doves see the inflationary lightbulb flicker.
Fed Evans, who dissented along with Kashkari on the December rate hike, has also embraced Kashkari’s new hawkish tone post-Friday’s earnings data. While his baseline remains a hold in rates until mid-year but with on crucial commonition: “In contrast, suppose inflation picks up more assuredly, as many expect. Then, we still could easily raise rates another three or even four times in 2018 if that were necessary. And I would support such a faster pace if the data point convincingly in this direction.”
Of course, this hawkish Fed discourse has elevated market chatter this morning centring on how the Trump Administration could react if the USD parades higher on a more hawkish Fed. It certainly makes for exciting international intrigue to the debate in the wake of comments from ECB member Nowotny who charged that the US Treasury is deliberately putting pressure on the USD
Oil Prices
Oil prices have been getting battered by forces beyond the nodding donkey of late. The weaker narrative has been underpinning prices, but with the market shifting to a more hawkish fed description the US dollar slide has come to a blunt halt is now weighing negatively on oil prices. Notwithstanding the unforeseen disorder in the broader financial system has seeped into the oil markets.
With Oil prices ones WTI fell abruptly after the U.S. government reported crude stockpiles rose by 1.9 million barrels. But its the deluge US production that remains the most significant menace to OPEC production cuts. The bottom line is the US crude production should keep hitting new highs throughout 2018 after reaching an all-time higher of 10.25 m barrels per day. 11’s are not that far away.
Gold Prices
Stronger US dollar and higher US Treasury yields have depressed demand for Gold overnight. And with equities souring and with prices continuing to melt away, gold markets could be susceptible to a stock market rebound.
The shifting Fed narrative that is gathering hawkish following could be the most significant thorn in the Gold Bulls side.
Currency Markets
Japanese Yen
The Yen will be traded like a puppet whose strings are manipulated by equities and fixed income price movements.
Australian Dollar
The risk-off moves from Monday’s equity plunge were enough to liquidate short USD and with continued broad de-risking assignments still being played out. I suspect the Aussie bulls with remain in time out corner until we get back above .7850 and a fraction of risk appetite returns. When you view every possible trade scenario as an ambush, probably best to tread cautiously.
The Malaysian Ringgit
The re-emergence of the Federal Reserve Board Hawks and Oil prices looking very susceptible to ramped up US shale oil production continues to weigh negatively on the MYR.
But indeed, the uptick in market volatility has tamed investors appetite, so bullish signals are far and few between
Are BoE Interest Rate Expectations Too Bullish?
BoE to Release New Economic Forecasts Alongside Rate Decision
The Bank of England holds its first monetary policy meeting of the year this week, after which it will release the quarterly inflation report alongside its monetary policy decision and hold a press conference with Governor Mark Carney.
The event - which is often referred to as 'Super Thursday' - is one of the most hotly anticipated of the UK calendar as it offers significant insight into the thoughts of the Monetary Policy Committee, something that's become increasingly sought after since it started raising interest rates in November.
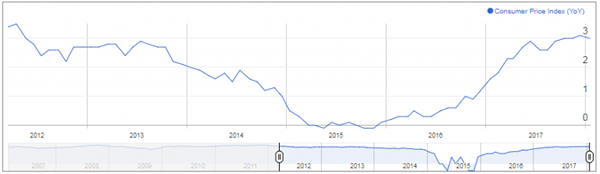
BoE policy makers took the decision to raise interest rates after inflation surpassed 3% in November, a level deemed by many to be too high despite being driven by one-off currency moves in the aftermath of Brexit. This is led many economists to forecast another hike this year and two more over the three forecasting period, but have they and others been misled by the central bank?
In many ways, the dilemma facing the BoE is no different than that facing other central banks - the economy is growing, unemployment is very low, labour market slack appears low and yet inflation is stubbornly low - but one very important difference exists, Brexit.
The sheer amount of uncertainty that exists because of Brexit has resulted in low growth compared to its peers and its pre-referendum levels, businesses are reluctant to invest and the consumer squeeze is taking its toll. The economy may well have shown more resilience than many feared prior to the referendum but is this really the kind of environment that the central bank should be raising rates in? If not, why did they raise by 25 basis points in November?
The central bank will naturally point to the above target inflation as warranting a hike which would be fair, assuming they believed it would remain at those levels of exceed it, which is debatable. This would also indicate a willingness to raise more if inflation remains well above target. While it's likely to have peaked, it's not expected to fall very far for a while which is why people may be anticipating further hikes.
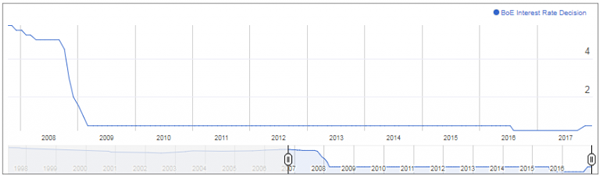
Another possibility could be that they wanted to reverse the emergency post-Brexit rate cut which many Brexiteers criticized at the time and some others have questioned the need for since. Especially when you consider that the central bank was reluctant to move below 0.5% throughout the aftermath of the global financial crisis and eurozone debt crisis. If lower rates were seen as risky or unnecessary then, can they possibly be warranted now? If not and this was behind November's decision, are the markets wrong in anticipating another hike this year and more after?
This could become a lot clearer in the coming meetings and Thursday should offer some early insight, particularly as the inflation report includes growth and inflation forecasts. Any indication that policy makers are in no rush to raise again could see markets pare back expectations resulting in lower yields on UK debt which could in turn weigh on the pound. We may not get this on Thursday though, assuming we do at all, as they may opt to gradually soften their stance over a number of meetings, particularly if Brexit negotiations aren't progressing as planned. Ultimately, these will have a major bearing on how interest rates move over the three year forecast period.
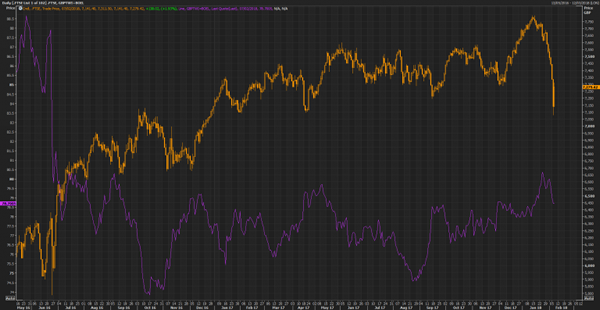
The FTSE 100 may also be sensitive to the BoE event on Thursday, given its inverse relationship with the pound. A stronger pound has typically weighed on the index due to the external exposure of the companies that make up the index, while a weaker pound has been positive for it, as seen in the aftermath of the referendum. It's been a rough couple of weeks for the FTSE, the last couple of days in particular as volatility has returned in force and equities have been sent into a tailspin lower. A strengthening pound - should the BoE release bullish forecasts and adopt a hawkish tone - may not help matters.
Gold Slides To 4-Week Low As Stock Markets Settles Down
Gold has posted losses in the Wednesday session. In North American trade, the spot price for an ounce of gold is $1318.19, down 0.47% on the day. On the release front, there are no major US events on the schedule.
It's been a volatile week for stock markets across the world, and this has triggered strong movement in gold prices. A massive sell-off on Monday sent spooked investors looking for safe assets, boosting gold prices. A key factor in the stock market slide was strong employment numbers on Friday, as nonfarm payrolls and wage growth reports beat their estimates. Investors shied away from the stock markets, concerned that the sharp data could lead to higher inflation. This in turn would result in more rate hikes this year, making the dollar more attractive at the expense of gold and other currencies. However, US markets quickly recovered, posting gains on Tuesday and Wednesday. With risk appetite returning, gold has become less attractive, and is trading at its lowest level since January 11.
Jerome Powell was probably hoping for a quiet start at his new job as chair of the Federal Reserve, but the stock markets had other plans. Powell, who took over on Saturday, was greeted by the largest one-day drop ever on the Dow Jones on Monday, as US stock markets nosedived. Some analysts went as far as attributing some of the losses on the changing of the guard at the Fed, but this appears unlikely, given that Powell is expected to follow Janet Yellen's policies. This sentiment was echoed by on Tuesday by St. Louis Federal Reserve President James Bullard, who said that he does not think that policy will change appreciably under Powell.
Pound Under Pressure, BoE Rate Decision Next
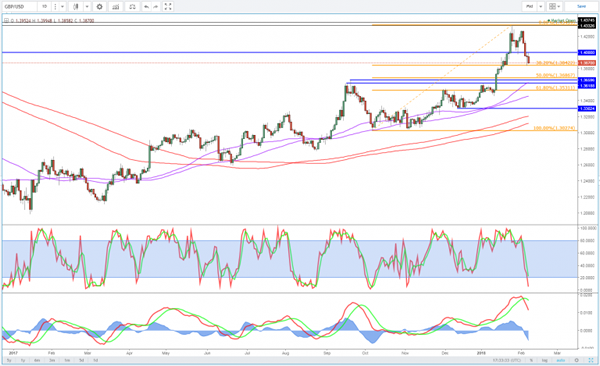
The British pound is lower on Wednesday, as the currency has been under pressure for most of the week. In the North American session, GBP/USD is trading at 1.3883, down 0.48% on the day. On the release front, British Halifax HPI declined 0.6%, below the estimate of +0.2%. This marked the first decline since June. There are no US releases on the schedule. On Thursday, the US releases unemployment claims.
It’s been a rough week for the pound, which started the week with losses and has shed 1.6%. The US dollar has posted gains against the pound and the other majors, after a massive sell-off on global stock markets on Monday. The sell-off was precipitated by strong US nonfarm payrolls and wage growth reports on Friday. This triggered concerns that higher inflation was on the way, which in turn would result in more rate hikes this year. Higher interest rates make the dollar more attractive for investors, at the expense of other currencies. Although global stock markets have settled down, concerns remain that inflation could move higher after years of being AWOL across industrialized countries, and could again spook the markets.
The spotlight will be on the Bank of England on Thursday, as the bank sets the benchmark rate and releases the Inflation Report. The markets will be also be keeping a close eye on the Inflation Letter, which Governor Mark Carney is required to write due to inflation being more than 1% off the target of 2.0% (CPI is currently running at a 3.1% clip). Carney will address what the Bank is doing to lower inflation, and higher interest rates is one remedy, but one that Carney will hope to avoid, given the economic uncertainty surrounding Brexit. The BoE is expected to hold current rates at 0.50%, and all nine members of the Monetary Policy Committee are expected to support this move. If some members vote in favor of a rate hike, the pound could respond with gains.
(RBNZ) Official Cash Rate Unchanged at 1.75 percent
Statement by Reserve Bank Governor Grant Spencer:
The Reserve Bank today left the Official Cash Rate (OCR) unchanged at 1.75 percent.
Global economic growth continues to improve. While global inflation remains subdued, there are some signs of emerging pressures. Commodity prices have increased, although agricultural prices are relatively soft. International bond yields have increased since November but remain relatively low. Equity markets have been strong, although volatility has increased recently. Monetary policy remains easy in the advanced economies but is gradually becoming less stimulatory.
The exchange rate has firmed since the November Statement, due in large part to a weak US dollar. We assume the trade weighted exchange rate will ease over the projection period.
GDP growth eased over the second half of 2017 but is expected to strengthen, driven by accommodative monetary policy, a high terms of trade, government spending and population growth. Labour market conditions continue to tighten. Compared to the November Statement, the growth profile is weaker in the near term but stronger in the medium term.
The Bank has revised its November estimates of the impact of government policies on economic activity based on Treasury's HYEFU. The net impact of these policies has been revised down in the near term. The Kiwibuild programme contributes to residential investment growth from 2019.
House price inflation has increased somewhat over the past few months but housing credit growth continues to moderate.
Annual CPI inflation in December was lower than expected at 1.6 percent, due to weakness in manufactured goods prices. While oil and food prices have recently increased, traded goods inflation is projected to remain subdued through the forecast period. Non-tradable inflation is moderate but expected to increase in line with increasing capacity pressures. Overall, CPI inflation is forecast to trend upwards towards the midpoint of the target range. Longer-term inflation expectations are well anchored at 2 percent.
Monetary policy will remain accommodative for a considerable period. Numerous uncertainties remain and policy may need to adjust accordingly.
USDCHF Near 2-Week Peaks; Bulls Take Control in Short Term
USDCHF bears have been leading the market since November, driving the pair to a 2½-year trough of 0.9246 last week. This week, however, bulls seem to be taking back control, with prices being on track to break two-week highs.
In the 4-hour chart, technical indicators suggest that the recent uptrend could be in play in the near-term. The pair managed to enter the Ichimoku cloud for the first time after a month, surpassing the 50-period simple moving average (SMA) which acted as a strong support during that timeframe. Today's bullish (golden) crossover between the 20- and the 50-period SMAs also enhances the bullish signals. Besides that, momentum indicators show that an advance is getting ahead. The RSI increased speed and is currently a breath below 70, hinting that upside movements might lose steam if it successfully breaks into oversold levels (above 70). The MACD has crawled back to positive territory, surpassing its signal line.
Should the pair head up, the Fibonacci retracement levels of the downleg from 0.9639 to 0.9246 (January 22 – February 2) could provide resistance. The 50% Fibonacci of 0.9443 could come first into view and any violation of this long-term support could confirm the start of a bullish phase, extending the uptrend towards the 61.8% Fibonacci of 0.9488. Steeper increases could also test the 78.6% Fibonacci of 0.9556.
On the flip side, if prices decline instead, an immediate support could be found at the 38.2% Fibonacci of 0.9395 and then further below a stronger obstacle could be met at the 23.6% Fibonacci of 0.9336 which coincides with the 20- and the 50-period SMAs. However, only a leg below the previous low at 0.9246 would resume the underlying downtrend, reverting USDCHF back to bearish mode.
USDCAD Remains Tall after Recent Surge But Bulls Show Initial Signs of Stall
The USDCAD holds high levels on Wednesday and trading above 1.25 handle, after strong rally last Fri/Mon which stalled at 1.2566 on Tuesday. Subsequent dip was so far shallow and found footstep just under 1.25, with fresh bullish momentum building on daily chart and 10/20SMA's in bullish setup, continuing to support. Thick hourly cloud (spanned between 1.2515 and 1.2433) underpins near-term action and keeps the downside protected for now. On the other side, overbought slow stochastic on daily chart and converged 55/10 in attempt to form bear-cross, weigh and keep the downside at risk. Break below two-day base at 1.2490 will be initial bearish signal for extension towards pivotal 1.2445 support (Fibo 38.2% of 1.2248/1.2566 rally), loss of which would signal reversal. On the other side, lift above Tuesday's spike high at 1.2566 will be bullish signal, as daily cloud twists tomorrow (1.2699) and could attract for further advance.
Res: 1.2544; 1.2566; 1.2603; 1.2663
Sup: 1.2490; 1.2445; 1.2415; 1.2390
Sunset Market Commentary
Markets:
Global core bonds traded mixed today with German Bunds underperforming US Treasuries. The final German coalition agreement and upward revisions to EMU growth forecasts by the EC might be at play. Trading ranges in both contracts narrowed again following two volatile days. European stock markets and Brent crude recover some of this week's losses. NY Fed Dudley said that the stock market swoon won't alter the FOMC's thinking at the moment. At the time of writing, German yields add 0.6 bps (2-yr) to 2.8 bps (10-yr). Daily US yield changes range between -0.4 bps (2-yr) and -2.1 bps (10-yr). 10-yr yield spreads versus Germany narrow 2 bps with the periphery outperforming (up to -9 bps).
There was again no unequivocal theme to guide USD trading today. There were no market-relevant data in EMU or in the US. Risk sentiment was mixed; European equities rebounded, but US equity futures indicated modest losses. USD/JPY traded with a slightly negative bias holding in the low 109 area during most of the European session. At the same time, the dollar gained slightly ground against the euro with EUR/USD drifting lower in the 1.23 big figure. If anything, interest rate differentials between the US and Germany narrowed slightly, but this was of little significance for EUR/USD trading. The pair returned to the previous 1.2335/23 support, but for now there is still no break yet. Currency investors are still looking for a trigger/new market theme after this week's repositioning on the equity and interest rate markets EUR/USD trades in the 1.2335 area. USD/JPY is currently changing hands around 109.20. The trade-weighted dollar (DXY 89.85) is holding a cautious upward bias.
Sterling was captured in technical trading today. There were no important UK eco data. In its winter forecasts, the European Commission expects UK growth of 1.4% in 2018 and 1.1% in 2019, lagging well behind EMU growth. However, this assessment was no surprise. EUR/GBP drifted temporary higher in the 0.88 big figure, but a sustained break again didn't occur. The pair trades little changed at around 0.8870. Investors await tomorrow's BoE policy decision and the Bank's quarterly inflation report. Markets will look for clues whether Carney and Co are inclined to give more weight to containing inflation rather than to support growth further out in 2018. Cable (1.39 area) declined off the 1.40 barrier, but this move was mainly driven by relative USD strength.
News Headlines:
The EMU economy will expand faster than previously anticipated in 2018 and 2019, the European Commission said in its winter forecast. It sees growth of 2.3% in 2018 (up from 2.1%). The 2019 growth forecast was upwardly revised to 2% percent. Inflation is expected to remain subdued at 1.5% in 2018 and 1.6% in 2019.
German Chancellor Merkel's CDU/CSU and the Social Democrats (SPD) agreed to a coalition deal. According to media reports, Merkel's CDU will get five ministries, including defense and economy. CSU will take three. SPD leader Schulz is said to serve as foreign minister. Hamburg Mayor Scholz will oversee finance, replacing Wolfgang Schaeuble.
Oil prices are little changed today as the boost from a report showing a drop in US crude inventories last week is offset by evidence of growing US output. Brent crude hovers just below $67/b, off the $71/p top late January.
The National Bank of Poland (NBP) left its policy rate unchanged at a record low of 1.5%. Investors are looking out for a press briefing after this report was finished to see whether the NBP intends to change tactics this year or not.
Silver Dips Below 16.73; More Downside Move is Expected
Silver has come under pressure since Tuesday's session, in the short-term timeframe. The price slipped below the 16.73 barrier and continues the strong bearish movement. As a side note, the precious metal has been trading within a descending triangle since July 2016.
In the short-term timeframe, technically, the bias is bearish. Momentum indicators are also endorsing the decline. The MACD oscillator entered the negative territory, while the RSI indicator is heading lower below the 50 level.
If price action remains below 16.73 (immediate resistance), there is scope to test the lower boundary of the triangle at 15.60. This is considered to be a strong resistance area which has been rejected a few times in the past.
If the aforementioned resistance fails to prevail, then the focus would shift to the upside towards the 17.70 barrier. If price breaches that level, it could increase the bullish move above the descending triangle and it could be on path towards the 18.20 level.
EURJPY Bears Back into the Game; Uptrend Line Acts as Support
EURJPY has reversed back down again after finding resistance at the 135.80 barrier during yesterday's and today's trading sessions. The pair has been developing lower, reaching the ascending trend line, which has been standing since August 18. Additionally, over the last hours, prices broke below the 23.6% Fibonacci retracement level at 135.12 of the up-leg from 127.45 to 137.50.
The pair is recording a slightly upside movement and the short-term momentum indicators seem to be in confusion. In the 4-hour chart, the Relative Strength Index (RSI) is holding in the negative area but is pointing up, while the MACD oscillator is moving lower in the bearish area below its trigger line. Moreover, the 20-simple moving average is sloping to the downside, signaling further bearish movement.
On the downside, if prices continue the bearish rally, there is scope to test the 134.10 support level. Penetrating this key level and the uptrend line could see further downside correction towards the 38.2% Fibonacci mark at 133.65.
If prices reverse higher and climb above 23.6% Fibonacci level, immediate resistance should come at 135.80, which overlaps with the 40-SMA in the 4-hour chart.