
Sample Category Title
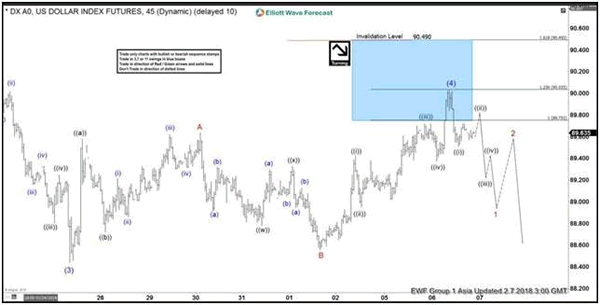
Elliott Wave View: DXY Ended Correction
DXY Short Term Elliott Wave view suggests that the decline to 88.44 ended Intermediate wave (3). Intermediate wave (4) bounce unfolded as a flat Elliott Wave structure. Up from 88.44, Minor wave A ended at 89.64, Minor wave B ended at 88.55, and Minor wave C of (4) appears complete at 90.03. Near term, while bounces stay below 90.03, expect Index to resume lower or at least do a 3 waves pullback to correct cycle from 1/25 low. We don’t like buying the Index.
DXY 1 Hour Elliott Wave Chart
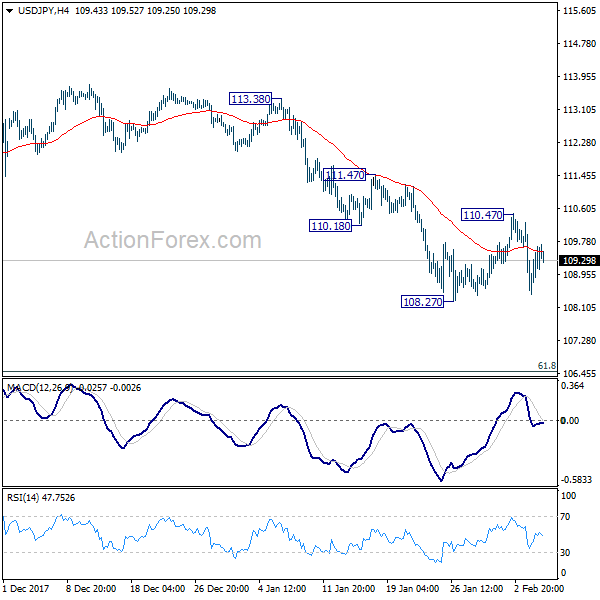
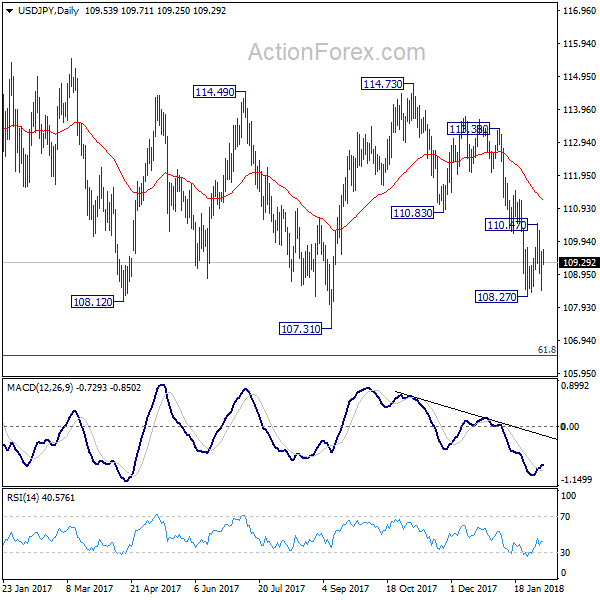
USD/JPY Daily Outlook
Daily Pivots: (S1) 108.78; (P) 109.22; (R1) 109.98; More...
Intraday bias in USD/JPY remains neutral at this point. As noted before, larger decline from 114.73 is possibly still in progress. Break of 108.27 will also resume the medium term correction from 118.65. That will send USD/JPY through 107.31 to 106.48 fibonacci level. Nonetheless, above 110.47 will turn intraday bias back to the upside and bring stronger rebound.
In the bigger picture, current development argues that the corrective pattern from 118.65 is extending. There is risk of dropping further to 61.8% retracement of 98.97 to 118.65 at 106.48. But this level should provide strong support to contain downside and bring resumption of rise from 98.97. However, sustained break of 106.48 will now likely send USD/JPY through 98.97 to resume the corrective fall from 125.85 (2015 high).
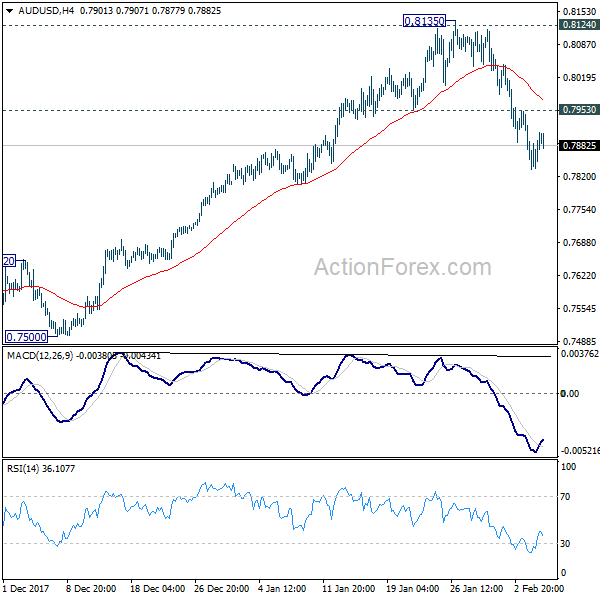
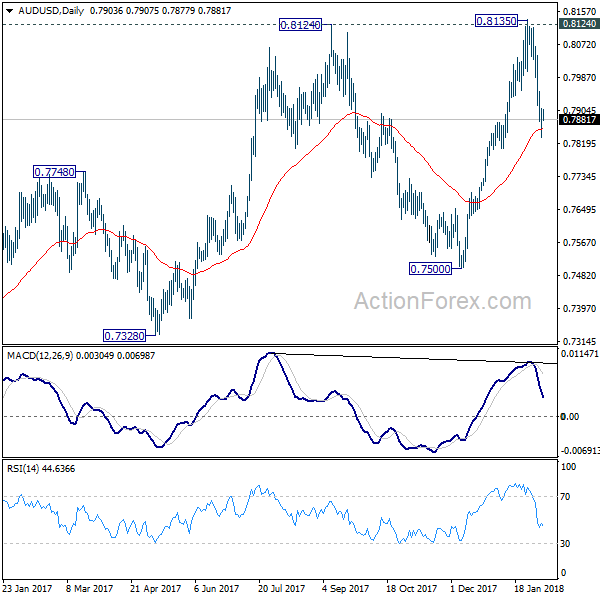
AUD/USD Daily Outlook
Daily Pivots: (S1) 0.7856; (P) 0.7883; (R1) 0.7930; More...
AUD/USD is drawing support from 55 day EMA and recovered Still, with 0.7953 minor resistance intact, intraday bias stays on the downside. Sustained trading below 55 day EMA will argue that rise from 0.7500 has totally completed and will pave the way to retest this support level. Nonetheless, break of 0.7953 will turn bias back to the upside for retesting 0.8135 high.
In the bigger picture, medium term rebound from 0.6826 is seen as a corrective move. It might still extend higher but we'd expect strong resistance from 38.2% retracement of 1.1079 to 0.6826 at 0.8451 to limit upside to bring long term down trend resumption. On the downside, break of 0.7500 support will now be an important signal that such corrective rebound is completed.
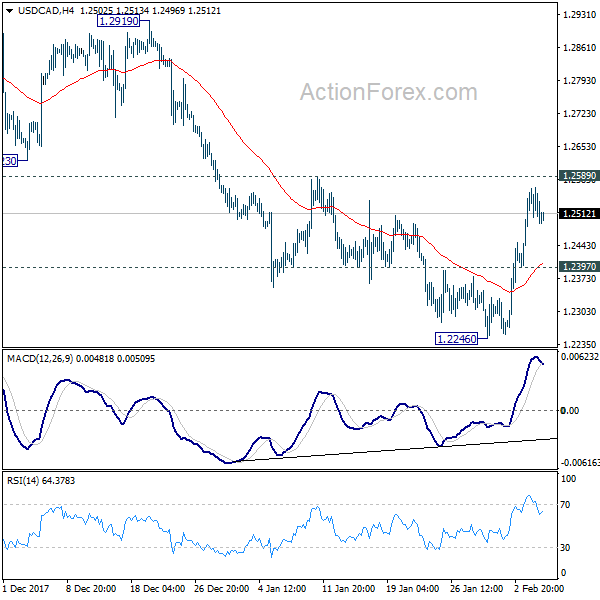
USD/CAD Daily Outlook
Daily Pivots: (S1) 1.2469; (P) 1.2517; (R1) 1.2543; More...
USD/CAD lost some upside momentum ahead of 1.2589 resistance and intraday bias is turned neutral first. On the upside, firm break of 1.2589 will indicate that pull back from 1.2919 has completed and and would bring retest of this resistance. On the downside, below 1.2397 minor support will turn focus back to 1.2246 instead.
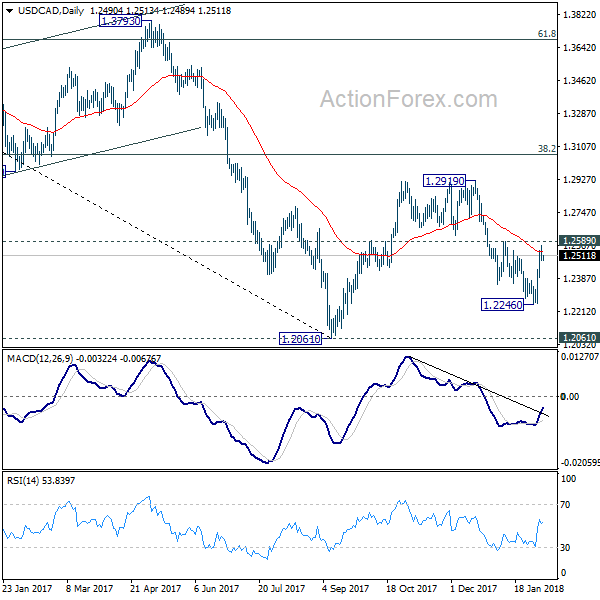
In the bigger picture, rebound from 1.2061 is likely completed completed at 1.2919, rejected by 55 week EMA and kept below 38.2% retracement of 1.4689 to 1.2061 at 1.3065. The development also suggests that long term fall from 1.4689 is not completed yet. Decisive break of 1.2061 low will target 61.8% retracement of 0.9406 to 1.4689 at 1.1424. This will now be the favored case as long as 1.2919 resistance holds.
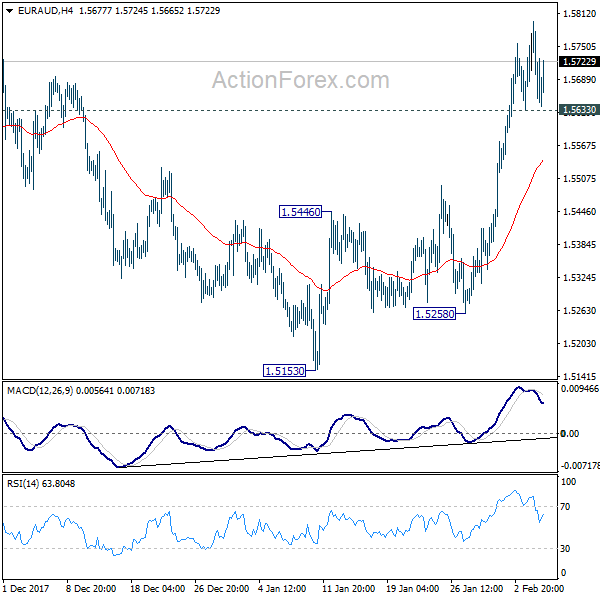
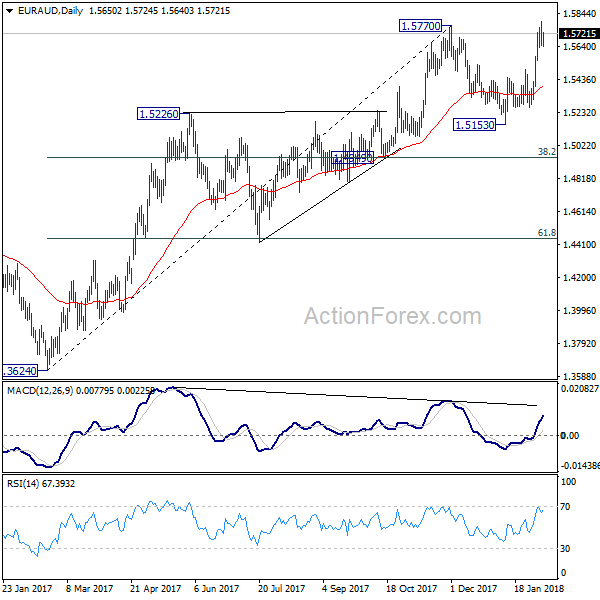
EUR/AUD Daily Outlook
Daily Pivots: (S1) 1.5600; (P) 1.5697; (R1) 1.5749; More....
As long as 1.5633 minor support holds, further rise is expected in EUR/AUD. The breach of 1.5770 resistance suggests that medium term rise from 1.3264 is resuming. Sustained trading above 1.5770 will pave the way to 1.6587 key long term support. Nonetheless, below 1.5633 minor support will dampen this bullish case and turn intraday bias neutral first.
In the bigger picture, medium term rise from 1.3624 is not completed yet. Break of 1.5770 will extend the rise to retest 1.6587 (2015 high). However, considering bearish divergence condition in daily MACD, sustained break of 1.4949 cluster support (38.2% retracement of 1.3624 to 1.5770 at 1.4950) will indicate medium term reversal. And there is prospect of retesting 1.3624 low in that bearish case.
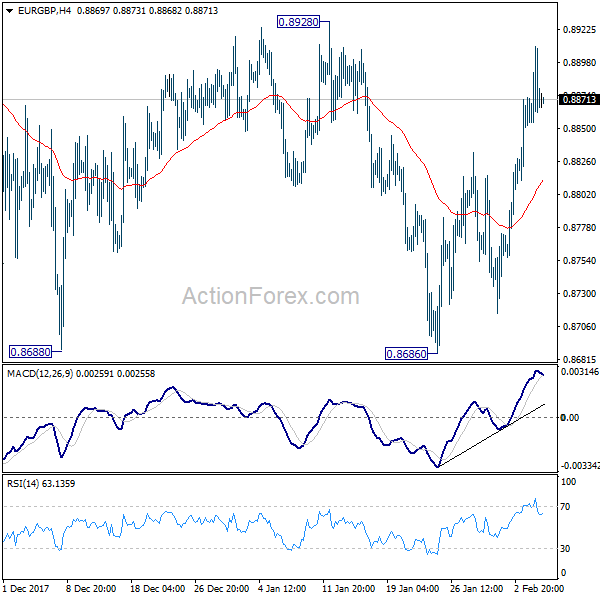
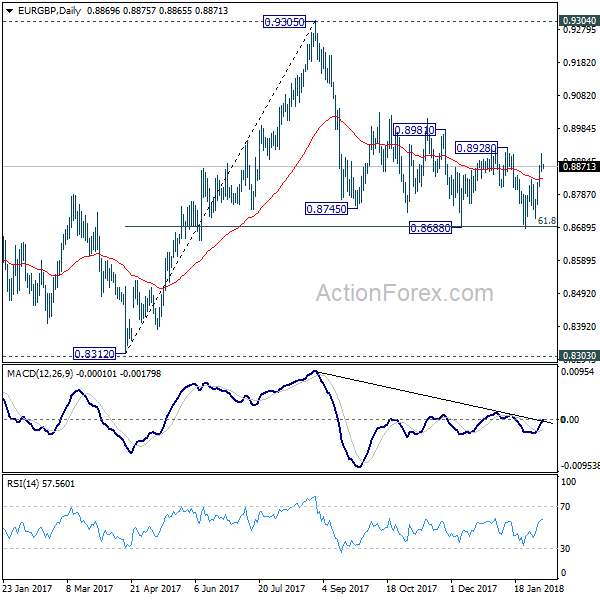
EUR/GBP Daily Outlook
Daily Pivots: (S1) 0.8821; (P) 0.8847; (R1) 0.8882; More...
While the rebound from 0.8686 looks strong, EUR/GBP is still bounded in range of 0.8686/8928. Intraday bias remains neutral first. And, near term outlook will remain mildly bearish as long as 0.8928 resistance holds. On the downside, firm break of 0.8686 will resume whole decline from 0.9305. As 61.8% retracement of 0.8312 to 0.9305 should then be taken out too. Deeper decline would be seen to retest 0.8303/8312 support zone. Nonetheless, on the upside, break of 0.8928 will indicate near term reversal and turn outlook bullish for 0.9304 resistance.
In the bigger picture, there are various ways to interpret price actions from 0.9304 high. But after all, firm break of 0.9304/5 is needed to confirm up trend resumption. Otherwise, range trading will continue with risk of deeper fall. And in that case, EUR/GBP could have a retest on 0.8303. But we'd expect strong support from 0.8116 cluster support (50% retracement of 0.6935 to 0.9304 at 0.8120) to contain downside.
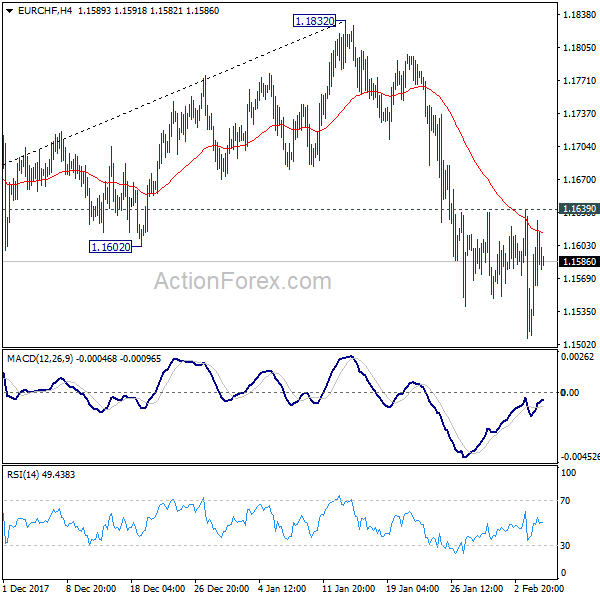
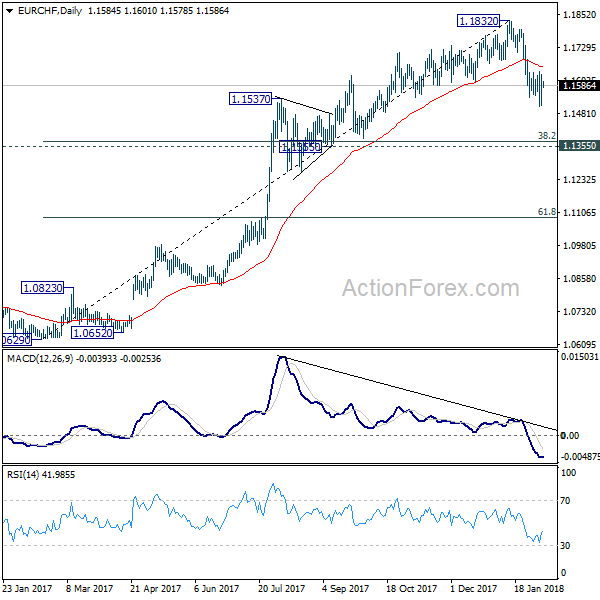
EUR/CHF Daily Outlook
Daily Pivots: (S1) 1.1521; (P) 1.1575; (R1) 1.1638; More...
As long as 1.1639 minor resistance holds, deeper decline is expected in EUR/CHF. Fall from 1.1832 is correcting medium term rise from 1.0629. Next target will be 1.1355 cluster support (38.2% retracement of 1.0629 to 1.1832 at 1.1372.) On the upside, though, above 1.1639 will indicate short term bottoming and bring stronger recovery first.
In the bigger picture, a medium term top should be in place at 1.1832 on bearish divergence condition in daily MACD. But there is no indication of long term reversal yet. As long as 1.1198 resistance turned support holds, we'd still expect another rise through prior SNB imposed floor at 1.2000.
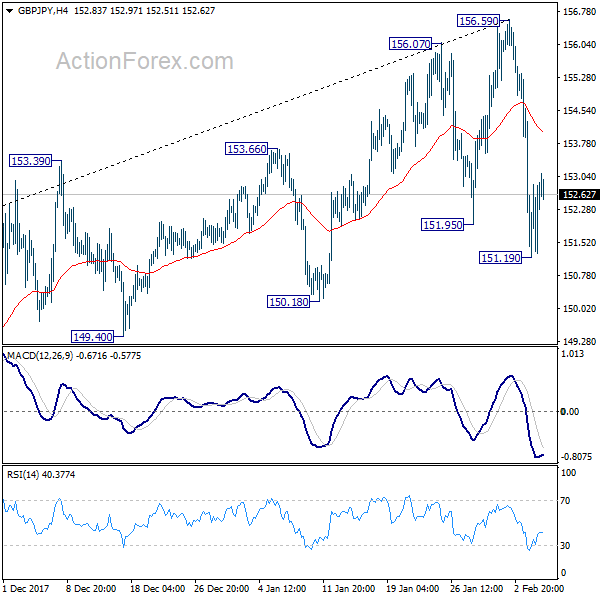
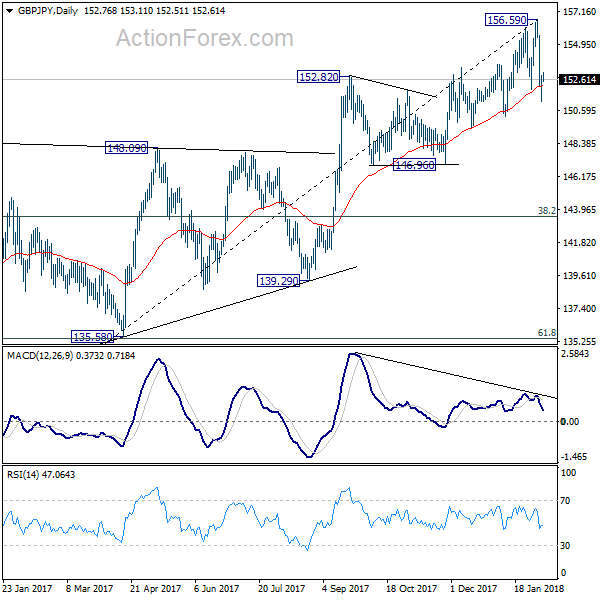
GBP/JPY Daily Outlook
Daily Pivots: (S1) 151.72; (P) 152.31; (R1) 153.42; More...
GBP/JPY recovered after forming a temporary low at 151.19 and intraday bias is turned neutral first. Considering bearish divergence condition in daily MACD, the near term trend could have reversed. Hence, deeper fall is in favor. Below 151.19 will target 150.18 support first. Break of 150.18 will affirm this case and target 146.96 key support level.
In the bigger picture, as long as 146.96 key support holds, medium term outlook remains bullish. Rise from 122.36 is in favor to extend to 61.8% retracement of 195.86 to 122.36 at 167.78. However, break of 146.96 support will indicate trend reversal. In that case, deeper fall would be seen to 38.2% retracement of 122.36 to 156.59 at 143.51 and then 61.8% retracement at 135.43.
Crude Oil Price Forming Short-Term Top?
Key Highlights
- Crude oil price struggled to break the $66.50-66.70 resistance area and declined against the US dollar.
- There was a break below a key contracting triangle with support at $64.30 on the 4-hours chart of XTI/USD.
- The $63.00 level is a crucial support on the downside followed by $62.60.
- The US Trade Balance in Dec 2017 posted a trade deficit of $-53.1B.
Crude Oil Price Technical Analysis
There were sharp gains in crude oil price in January 2018 as it moved above the $65.00 level against the US dollar. However, the price struggled to break the $66.50-66.70 resistance area and declined recently.
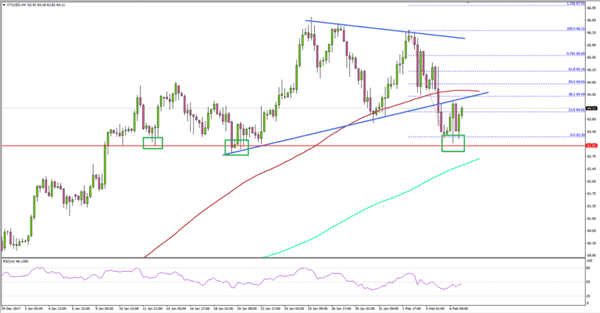
Looking at the 4-hours chart of XTI/USD, there was a downside wave initiated from the $66.31 high. The price fell below the $65.00 and $64.50 support levels to settle below the 100 simple moving average (red, 4-hours).
More importantly, there was a break below a key contracting triangle with support at $64.30 on the same chart. The price traded as low as $63.30 and is currently consolidating losses. On the upside, an initial resistance is around the 23.6% Fib retracement level of the last decline from the $66.31 high to $63.30.
On the downside, there is a crucial support near $63.00, which prevented declines on many occasions previously. If the price fails to stay above $63.00, it could test the $62.60 support and the 150 simple moving average (green, 4-hours).
Overall, it seems like the price has formed a short-term top near $66.30. The next move in XTI/USD depends on whether buyers can prevent a break below $63.00 or not in the near term.
US Trade Balance
Recently in the US, the Trade Balance report for Dec 2017 was released by the Bureau of Economic Analysis and the U.S. Census Bureau. The forecast was slated for a trade deficit of $-52.0B, compared with the last $-50.5B.
However, the actual reading was a bit lower as the trade deficit in Dec 2017 was $-53.1B. The last reading was revised to $-50.4B. The report added that:
The December increase in the goods and services deficit reflected an increase in the goods deficit of $2.6 billion to $73.3 billion and a decrease in the services surplus of $0.1 billion to $20.2 billion.
There was no negative impact on the greenback. On the contrary, it gained and pairs such as EUR/USD and GBP/USD extended their decline.
Market Morning Briefing: Euro Saw A Low Of 1.2314 Yesterday As The Dollar Index Tested 90
STOCKS
Dow (24912.77, +2.33%) recovered sharply, the fall seen yesterday and could attempt a rise above 25500 in the near term. While weekly support near 23600 holds, a bounce in the next few sessions is possible.
Dax (12392.66, -2.32%) traded down after a gap down opening but managed to recover a bit from levels near 12200. Note that 12200-12000 is an important support region and is likely to hold for the coming sessions, limiting further fall in the index just now.
Nikkei (22270.56, +3.06%) came down to almost test the support near 21000 before bouncing back sharply towards 22500. A rise above 22750 is needed to resume the uptrend; else there could be some range-trade below 22750 or a further fall towards 21000 again. For now some recovery is expected limiting the fall to 21000.
Shanghai (3339.07, -0.94%) fell sharply reacting to the fall in other major indices globally, testing 3360 as expected. Support is visible near 3340, below current levels and while that holds, the index could head back towards 3500 and higher in the near term.
Nifty (10498.25, -1.58%) and Sensex (34195.94, -1.61%) recovered yesterday in the second half of the sessions bouncing back from immediate support levels. While 10260 holds in Nifty and 33500 on the Sensex the indices could head back towards 10750 and 35000 respectively.
COMMODITIES
Brent (67.41) and WTI (63.95) have both moved up a bit, recovering from levels seen yesterday. But near term looks bearish while below 68 and 64 respectively. Need to see if the weekly support on Brent holds or take it lower in the near term.
Gold (1329.73) fell sharply yesterday and may test the lower limit of the 1320-1350 region mentioned earlier. While below 1350, we may negate a possible test of 1360-1370 levels. Need to see whether 1320 support holds or breaks in the near term.
Copper (3.2225) has moved up as expected and could remain in the 3.25-3.17 region for 2-3 sessions followed by a break on either side of the mentioned range which would indicate directional movement for the coming sessions.
FOREX
Dollar Index (89.602) touched resistance level on the 3 day candles near 90 yesterday as had been expected. It is currently below that resistance but could well test it again in this week. The next target on the upside could be resistance near 91 on the weekly line chart.
Euro (1.2386) saw a low of 1.2314 yesterday as the Dollar Index tested 90. It could now gradually move down towards 1.2275 by early next week (there is resistance near 1.2275 on the weekly candles – this resistance level had been earlier mentioned as 1.23).
Dollar-Yen (109.39) has again risen on back of Dollar strength after touching 108.5 yesterday. It would be interesting to see if the 21-day Moving Average on the daily line charts near 110.50 again provides it resistance on this upmove.
Euro Yen (135.47) touched a low near 134 yesterday as the Euro dipped close to 1.23 against the Dollar. It might move sideways for some time now or retest 134 if the Euro comes back down towards 1.2275-1.23 in the coming sessions.
Pound (1.3963) could test support near 1.36-1.37 on the daily candles in a week’s time as it has seen 3 days of continuous downmoves.
Dollar Rupee (64.05) has Support at 64.10-00. Can move up to 64.40-50 which is a good Resistance.
INTEREST RATES
US 10 Year Yield (2.7865), US 30 year Yield (3.0592), US 5 year yield (2.5227), US 2 year yield (2.0930) have again moved up after the dramatic fall yesterday. However we might see all of them stay below 2.85, 3.15, 2.6 and 2.2 respectively as there are long term resistances near those levels. The global equity selloff in favour of safer debt is still underway and we might have to wait and watch till we are certain of a narrower range in which US yields could move for the next few days. The volatility phase might just be ending for now. The next rate hike is supposed to be in March when the volatility could again return.
Japan 10 year yield (0.081) continues its oscillation between the broad 0.07 and 0.088 level which might continue for now.