Sample Category Title
EUR/JPY Daily Outlook
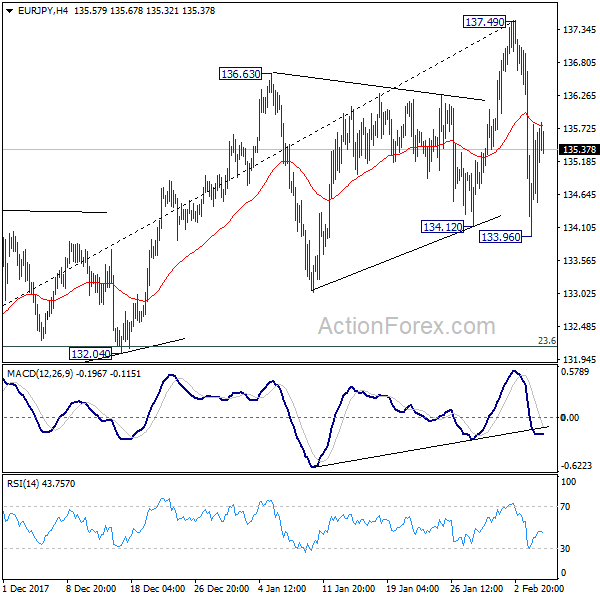
Daily Pivots: (S1) 134.45; (P) 135.11; (R1) 136.26; More....
EUR/JPY formed a temporary low at 133.96 and recovered. Intraday bias is turned neutral first. Still, the near term trend is likely reversed considering bearish divergence condition in daily MACD. Deeper decline will remain in favor. Below 133.96 will target 132.04 cluster support first (23.6% retracement of 114.84 to 137.49 at 132.14). Decisive break there will indicate larger reversal.
In the bigger picture, medium term rise from 109.03 (2016 low) is seen as at the same degree as the down trend from 149.76 (2014 high) to 109.03 (2016 low). It should be targeting 141.04/149.76 resistance zone. On the downside, break of 132.04 support, however, will be an early sign of trend reversal and will bring deeper fall back to 124.08 key medium term support.
Global Markets Stabilized, Yen Pared Gains But Stays Firm
Global market sentiments stabilized after steep early selloff. DOW initially dived to 23778.74 but rebounded to close up 567.02 pts or 2.33% at 24912.77. S&P 500 recovered 46.2 pts or 1.74% to 2695.14. NASDAQ also regained 148.35 pts or 2.13% to 7115.88. Asian markets followed with Nikkei trading up 660 pts or 3% at the time of writing. In the currency markets, Yen remains the strongest one for the week so far despite paring back some gains. Yen is followed by Kiwi and Dollar. Meanwhile, European majors remain the weakest, with Sterling leading the way down.
If our view is right that DOW's fall from 26616.71 is correcting the whole up trend from 15450.56, then the decline is far from finished. 38.2% retracement of 15450.56 to 26616.71 at 22351.24 is the first target. Whether this bearish case will realize will depend on the strength and duration of the current rebound. Reactions to 25197.72/25532.60 fibonacci resistance zone will be crucial. The 55 hour EMA also lies inside this zone. For the moment, we don't expect a clean break of this zone and DOW would likely revisit 23778.74 low soon.
EU toughens up Brexit transition demand
According to a draft document, the European Commission might ask UK to pay a higher Brexit bill than agreed last year. There would be demand to "cover the financing, during the transition period, of the relevant Common Foreign and Security Policy and Common Security and Defense Policy agencies or operations on the basis of the same contribution key as before the withdrawal date". The most important thing is that, during the transition period, UK will have no say in EU decisions.
In addition, UK "shall abstain, during the transition period, from any action or initiative which is likely to be prejudicial to the [European] Union's interests in the framework of any international organization, agency, conference or forum of which the United Kingdom is a party in its own right."
New Zealand job data won't change RBNZ neutral stance
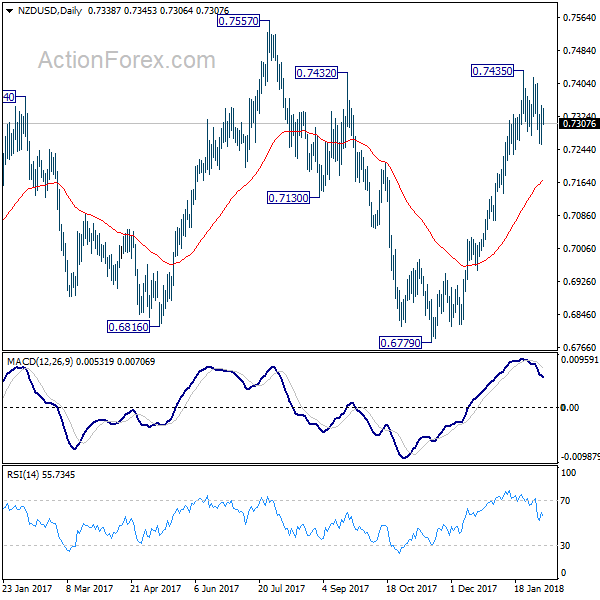
New Zealand employment rose 0.5% qoq in Q4, slowed from Q3's 2.2% qoq but beat expectation of 0.4% qoq. Unemployment rate dropped to 4.5%, down from 4.6% and was better than expectation of 4.7%. The unemployment rate was also the lowest in 9 years since 2008. The news is certainly welcomed by RBNZ ahead of the rate decision on Thursday. Nonetheless, no one is expecting any change to the 1.75% official cash rate. There is indeed a risk that RBNZ would try to talk down the exchange rate after recent appreciations.
Technically, NZD/USD should have topped out in near term at 0.7435 after breaching 0.7432 resistance. Deeper pull back would likely be seen back to 55 day EMA (now at 0.7172). Sustained break there will pave the way to retest 0.6779 low. On the upside, in case of another rise, there is likely strong resistance in zone of 0.7432/7557, to limit any rally attempt. Overall, medium term range trading is expected to continue inside 0.6779/7557 for a while.
Looking ahead
The economic calendar is light today. German industrial production and Swiss foreign currency reserves will be released in European session. Canada will release building permits later in the day.
EUR/JPY Daily Outlook
Daily Pivots: (S1) 134.45; (P) 135.11; (R1) 136.26; More....
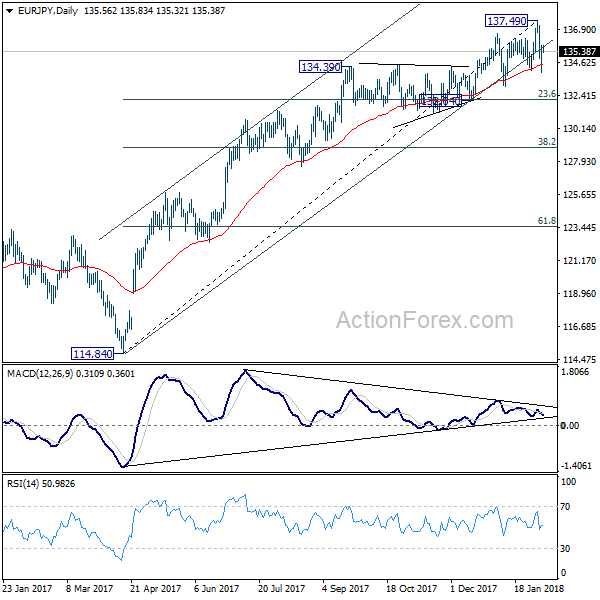
EUR/JPY formed a temporary low at 133.96 and recovered. Intraday bias is turned neutral first. Still, the near term trend is likely reversed considering bearish divergence condition in daily MACD. Deeper decline will remain in favor. Below 133.96 will target 132.04 cluster support first (23.6% retracement of 114.84 to 137.49 at 132.14). Decisive break there will indicate larger reversal.
In the bigger picture, medium term rise from 109.03 (2016 low) is seen as at the same degree as the down trend from 149.76 (2014 high) to 109.03 (2016 low). It should be targeting 141.04/149.76 resistance zone. On the downside, break of 132.04 support, however, will be an early sign of trend reversal and will bring deeper fall back to 124.08 key medium term support.
Economic Indicators Update
| GMT | Ccy | Events | Actual | Forecast | Previous | Revised |
|---|---|---|---|---|---|---|
| 21:45 | NZD | Employment Change Q/Q Q4 | 0.50% | 0.40% | 2.20% | |
| 21:45 | NZD | Unemployment Rate Q4 | 4.50% | 4.70% | 4.60% | |
| 00:00 | JPY | Labor Cash Earnings Y/Y Dec | 0.70% | 0.60% | 0.90% | |
| 05:00 | JPY | Leading Index CI Dec P | 108.1 | 108.3 | ||
| 07:00 | EUR | German Industrial Production M/M Dec | -0.50% | 3.40% | ||
| 08:00 | CHF | Foreign Currency Reserves Jan | 744B | |||
| 13:30 | CAD | Building Permits M/M Dec | 2.00% | -7.70% | ||
| 15:30 | USD | Crude Oil Inventories | 6.8M |
Plop Plop Fizz Fizz Oh What A Relief It Is
A case of turnaround Tuesday or merely the eye of the storm?
What a wild ride the past 48 hours !! and of course the downward correction in equity market was always on the cards as a combination of multi-year high bond yields, and record highs in US equity markets were foolishly unsustainable. And with interest rates sure to be on the move, equity markets were first to blink. But the voraciousness of the purge is what had many scratching their head, but in reality, in this day of computer-driven algorithmic trading this is not the first nor will it be the last mini flash crash to come.
There was nothing that particularly stood out other than an abundance of inflationary wood chips that formed into combustible markets resulting in the sudden repricing of risk.
But at the end of day bargain hunters reemerged as S&P closed +1.74% with levels marking the area from which Mondays late NY session sell-off begun.But with so much volatility lingering, equity market will have lot’s of wood to chop to restore investors confidence
Adding some calm to the proceedings St. Louis Fed President James Bullard, a non-voting member of the Federal Open Market Committee, attempted to dampen US rate hike euphoria stemming from Friday’s spike in average hourly earnings. He said, “I caution against interpreting good news from labour markets as translating directly into higher inflation.”
OIL
WTI oil prices recovered most of the afternoon losses, rising from $63.45/barrel at the close just shy of 64.0/ barrel in after-hours trading. API weekly crude inventories did not raise as much as forecast.
But near-term sentiment remains tethered to yo-yo strings with equities and the dollar providing the counterweights. Risk aversion does not bode well for oil prices and with all the chatter( including the November EIA report) about US production ramping up there could be a growing propensity to move lower near-term
Gold
Gold prices hit session lows late Tuesday afternoon as U.S. stocks bounced back up. But with asset rotation from equity to bonds, gold prices did not benefit from this uptick in volatility as investors are erring on the more conservative Bond route given the market volatility. Equity gold hedged unwound in favour a more traditional bond market approach as investors opt to sit out this Volatility ( VIX) driven storm
Far too much volatility in the market and investors across all asset classes remain spooked
Currency Markets
The Japanese Yen
Traditional correlations are finally beginning to assert so we should look for shifting risk sentiment to dominate the forthcoming sessions.
The Euro
EURUSD is entering a period of consolidation in the short term and yesterday certainly matched that argument. But Reuters reports that a final coalition deal is expected at some point late Tuesday in Europe.
The Australian Dollar
The AUD bulls are still licking their wounds after, with the RBA’s dovish twist to guidance feeble retail sales and trade data. However, if you adhere to the Yuan -AUD correlations proxy, one should not exclude the Aussie dollar just yet as the currency is nowhere near down for the count.
The Chinese Yuan
Acting as a haven and rightly so as the CNH remains very resilient to broader US moves. The Pboc 2018 working conference statement has cemented the view that the Mainland is putting more emphasis on opening up Bond markets while promoting the liberalisation of the Yuan. A real win for foreign investors who are finally seeing the barrier to enter China capital markets gradually fall by the wayside.
The Malaysian Ringgit
We should not lose sight of the great strides that the Ringgit has made over the past 12 months and while investors confidence will be tested during this sudden uptick in volatility the Ringgit will be more than up for the task.
Malaysia economy remains robust; OIL prices remain firm.With that in mind, Equity and bond markets will continue to attract investors who want exposure in the Ringgit. AS we still hold the view that the Ringgit will be less susceptible to other regional currencies as the BNM could increase interest rates again, Malaysia is the most significant oil exporter, and the central bank welcomes a stronger MYR
Gold Drops As US Stock Markets Recover
Gold has posted strong losses in the Tuesday session. In North American trade, the spot price for an ounce of gold is $1328.04, down 0.86% on the day. On the release front, JOLTS Jobs Openings slowed to 5.81 million, well off the estimate of 5.95 million.
Gold prices moved higher on Monday, following a massive sell-off on global stock markets. A key factor in the stock market slide was strong employment numbers on Friday, as nonfarm payrolls and wage growth reports beat their estimates. Investors shied away from the stock markets, concerned that the sharp data could lead to higher inflation, which in turn would result in more rate hikes this year. Higher interest rates make the dollar more attractive for investors, at the expense of the stock markets. However, US stock markets are back in green territory on Tuesday, which has stemmed the gold rally.
The Janet Yellen era is over at the Federal Reserve. On the weekend, Jerome Powell took over as chair, replacing Yellen. On Friday, Yellen waxed optimistic about the economy, saying that strong growth, a red-hot labor market and increased wage growth would require the Fed to gradually raise interest rates. Powell is expected to continue to Yellen’s policies, so the markets are not expecting any dramatic shifts. However, the massive US tax cut will have a strong impact on the US economy, and the markets will be looking to the Fed for guidance. If the Fed sounds optimistic about the tax reform package, the US dollar could move higher.
Pound Drops To 2-Week Low After Global Sell-Off Boosts Dollar
The British pound remains under pressure this week. In Tuesday's North American session, GBP/USD is trading at 1.3951, down 0.15% on the day. On the release front, there are no British events on the schedule. The US trade deficit widened, climbing to $53.1 billion and missing the forecast of $52.1 billion. In the US, JOLTS Jobs Openings slowed to 5.81 million, well off the estimate of 5.95 million.
PMI indicators are important gauges of the British economy, and the January reports have all disappointed. Last week, Manufacturing and Construction PMIs slowed in January and missed their estimates. Construction PMI dropped to 50.2, pointing to stagnation in the construction sector. On Monday Services PMI continued to the trend, as the pace of expansion slowed in January. These weaker numbers across the economy are sure to trigger concerns that Brexit is taking its toll on the economy, and the pound is trading below the symbolic 1.40 level.
It's been a rough week for the pound, which started the week with losses. The US dollar has posted broad gains this week, after a massive sell-off on global stock markets. The sell-off can be attributed to strong US nonfarm payrolls and wage growth reports, which were released on Friday. Investors fear that the sharp data could lead to higher inflation, which in turn would result in more rate hikes this year. Higher interest rates make the dollar more attractive for investors, at the expense of the stock markets. Adding to investors' concerns, there are expectations that the ECB and possibly the Bank of Japan could raise rates late in 2018, which would push up the euro and yen and weigh on the stock markets.
The Janet Yellen era is over at the Federal Reserve. On the weekend, Jerome Powell took over as chair, replacing Yellen. On Friday, Yellen waxed optimistic about the economy, saying that strong growth, a red-hot labor market and increased wage growth would require the Fed to gradually raise interest rates. Powell is expected to continue to Yellen's policies, so the markets are not expecting any dramatic shifts. However, the massive US tax cut will have a strong impact on the US economy, and the markets will be looking to the Fed for guidance. If the Fed sounds optimistic about the tax reform package, the US dollar could move higher.
Yen Edges Lower After Strong Gains
The Japanese yen has steadied in the Tuesday session, after posting gains on Monday. In North American trade, USD/JPY is trading at 109.36, up 0.22% on the day. In the US, JOLTS Jobs Openings slowed to 5.81 million, well off the estimate of 5.95 million. Later in the day, Japan releases Average Cash Earnings, which is expected to soften to 0.7%.
The Japanese yen had a strong start to the week, gaining 1.0% on Monday. The safe-haven yen took advantage of the massive sell-off on global stock markets, as risk appetite was nowhere to be found. The Dow Jones dropped 4.6% on Monday, and the downward trend has continued in the Asian and European markets on Tuesday. As investors head for the hills, analysts are scrambling to find the reasons behind the massive sell-off in the stock markets. Some experts are pointing to the changing of the guard at the Federal Reserve, with Jerome Powell replacing outgoing chair Janet Yellen on Saturday. However, Powell is not expected to change current monetary policy, so it’s unclear how Powell would have rubbed the markets the wrong way after just one day on the job.
A more likely explanation for the sell-off can be attributed to strong US nonfarm payrolls and wage growth reports, which were released on Friday. Investors fear that the sharp data could lead to higher inflation, which in turn would result in more rate hikes this year. Higher interest rates make the dollar more attractive for investors, at the expense of the stock markets. Adding to investors’ concerns, there are expectations that the ECB and possibly the Bank of Japan could raise rates late in 2018, which would push up the euro and yen and weigh on the stock markets.
The Bank of Japan continues to insist that it has no plans to raise interest rates in the near future. On Tuesday, BoJ Governor Haruhiko Kuroda reiterated this stance, saying that although economic conditions had improved, inflation levels were too low to justify reducing the stimulus program. Inflation is running at 1.0%, well below the BoJ target of just below 2%. Kuroda added that it would be “inappropriate” to raise the 10-year government bond yield target. Until inflation moves significantly higher, it’s a safe bet that the BoJ will not reduce stimulus or raise interest rates.
Clarity The Catalyst
The turnaround in stock markets Tuesday was a demonstration of how a clear narrative can help market participants take risk. The New Zealand dollar was the top performer while the Swiss franc lagged. Japanese earnings data is due up next. A new Premium trade has been posted to subscribers on a pair not approached since October.
We highlighted the implosion of the short-volatility ETF/ETNs yesterday as the event was unfolding. The worries continued into the start of European trading and the US equity open but the fears faded late and the S&P 500 added 46 points to 2695.
A big reason for the bounce back is that the VIX narrative helped market participants understand what happened. The only thing scarier than a market selloff on news is a selloff on a mystery. The unknown could be anything.
Short of nuclear war, the market is more comfortable once it has a sense of what happened. That immediately helps to limit contagion and highlight which areas of the market are safe. That's what slowly continues to unfold and it's good news for a continued to rebound in risk trades.
At the same time, the rout was also an opportunity to test virtually every market. One trend that stands out is how quickly Treasury yields rebounded. US 10s finished up 9.6 bps to 2.80% Tuesday and is now just 8 bps from the cycle high. That highlights a high risk of climbing to 3% in short order.
In FX, EUR/USD held up well through the storm in a signal of continuing strong demand.Looking ahead, the main data point in Asia is December Japanese labor cash earnings at 0000 GMT. The consensus is for a 0.5% y/y rise and it will take a big miss to generate any market moves.
Canada’s Trade Deficit Widened to $3.2 Billion December
Highlights:
- Canada's nominal merchandise trade deficit widened to $3.2 billion in December from $2.7 billion in November.
- Exports increased 0.6% but that was outpaced by a 1.5% jump in imports that built on the already large 6.3% gain in November.
Our Take:
The widening in the trade deficit was unexpected - markets were looking for a small improvement in December. The deterioration, though, was driven by increased domestic demand unexpectedly sending imports up 1.5% to build on the whopping 6.3% increase in November. Industrial equipment imports were particularly strong in December - and indeed in all of Q4 - suggesting that part of the deterioration in the trade balance was due to increased business investment. Statistics Canada noted that an outsized surge in logging, mining, and construction equipment probably was due to companies importing equipment ahead of new emissions regulations that began in January 2018 - although industrial equipment imports were still up 3% excluding that component. A 0.6% increase in exports was entirely due to higher prices but a 0.2% dip in volume terms nonetheless only partially retraced increases over the prior two months. Ex-energy exports fell more in December, declining about half a percent in volume terms by our calculation. That followed a big 2% increase in November but ex-energy export volumes were still modestly below year-ago levels in December.
Admittedly, underlying export growth has remained modest and there was little sign of acceleration in December. That is not really new, though, and the import strength continues to point to further firming in domestic demand. In an accounting sense, net trade is likely to be a larger drag on Q4 GDP growth than we previously expected. Because the import strength should show up as offsetting strength in domestic demand, though, we continue to expect an above-potential gain of close to 2% in overall GDP in the fourth quarter.
US: Strength in Consumer Demand Pushes Trade Deficit Higher
The U.S. trade deficit deteriorated further, to $53.1 billion compared to market expectations of $52.1 billion. For the whole of 2017, exports increased a healthy 5.5 percent while imports increased 6.7 percent.
Deficit Continued to Increase in December
The U.S. trade deficit in goods and services increased to a higher-thanexpected $53.1 billion in the last month of 2017 from a slightly downwardly revised deficit of $50.4 billion in November. Most of the difference in December was an increase in the deficit of goods, which went up $2.6 billion while there was a decline of $0.1 billion in the surplus for services. Exports of goods increased $3.4 billion while imports of goods increased $6.0 billion during December. In real terms, exports of goods increased $3.3 billion while imports of goods increased $5.3 billion during the month. Both real exports and imports of goods were revised down for November, by $0.5 billion and $0.6 billion, respectively, while real exports of services were revised up $0.1 billion. The increase in exports of food, feeds, and beverages was $448 million while industrial supplies and materials' exports were up $1.5 billion. On the other hand, capital goods except automotive exports were up $1.2 billion. Automotive vehicles, parts, and engines exports were down $75 million in the month while consumer goods exports were down $208 million. On the imports of goods side, foods, feeds and beverages were up $249 million while industrial supplies and materials' imports were up $567 million. Meanwhile, capital goods except automotive were up $837 million. The biggest component of the increase in the goods deficit was an increase of $1.1 billion in automotive vehicles, parts and engines and a $3.2 billion increase in consumer goods imports.
Signs of Good Times for the U.S. Economy
The improvement in growth in the United States and global economies also has its downside risks as higher economic growth across the world leads to a deterioration in the trade balance for some countries and an improvement of the trade balance for other. Although trade must balance at the overall world level every time, this does not mean that trade must balance for each particular country every time. Some countries across the world are net exporters, while others are net importers. For many decades, the U.S. economy has been a net importer, which means that as the economy improves the country's trade deficit also increases (for more on this please see "U.S. Trade Deficit Widening: Trouble Brewing?," which is available on our website). Although there are negative implications about a deterioration in the trade balance, i.e., a higher current account deficit which needs to be financed by higher capital inflows from the rest of the world, the short to medium term implications are positive. Consumers who are feeling positive about the future tend to consume at a faster pace, propping up economic growth as well as import growth. But it is not only consumers who tend to overspend in good times. Tax reform is probably going to put further pressure on the trade and current account deficit as firms invest in more capital equipment to increase productive capacity.
WTI Crude Oil Futures Hold Below 23.6% Fibonacci Level, Near 3-week Low
WTI crude oil futures have been trading slightly lower over the last few hours and created a 3-week low of 63.10. Having a look at the bigger picture the price is endorsing the scenario for further losses, while the short-term timeframe indicates an upward tendency.
In the 4-hour chart, the price dropped below the 23.6% Fibonacci retracement level at 63.84 of the last big upward movement with the low of 54.80 and high of 66.60. The RSI indicator is pointing to the upside above the 30 level. Additionally, the MACD oscillator is weakening in the negative territory and has fallen below the trigger line.
In case of a run below the 63.25 key level, then the focus could shift to the downside towards the 62.70 support barrier. Moreover, if the latter level is breached, this could increase the bearish pressure and extend the losses towards the next critical level of 62.20, which holds near the 38.2% Fibonacci mark.
On the flip side, if the price fails to create a bearish movement, then it could hit the 20 and 40 simple moving averages in the near-term at 64.88. Rising above them could see prices testing 65.40.