
Sample Category Title
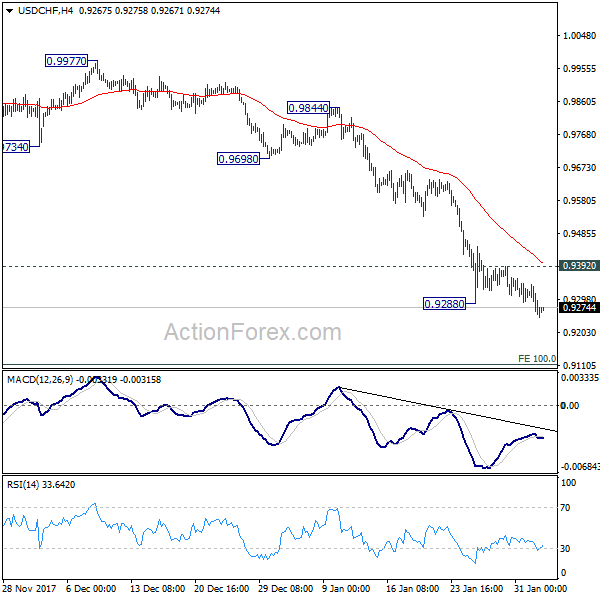
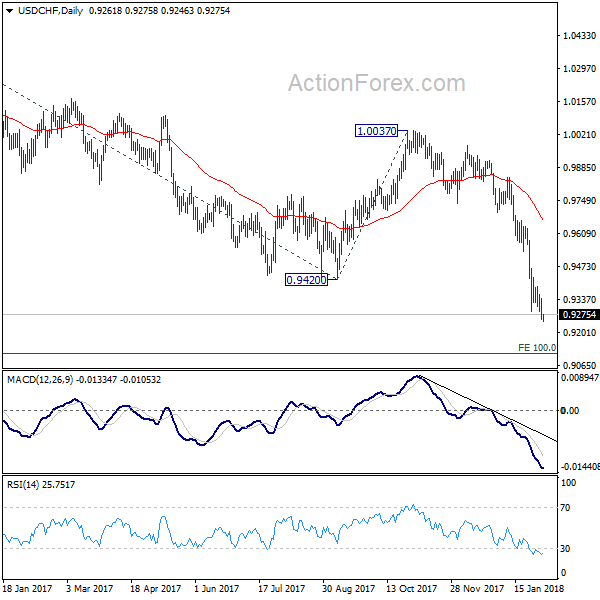
USD/CHF Daily Outlook
Daily Pivots: (S1) 0.9232; (P) 0.9287; (R1) 0.9317; More...
USD/CHF's break of 0.9288 indicates recent decline has resumed. Intraday bias is back on the downside. Current fall from 1.0037 should now extend to next key fibonacci level at 0.9115. On the upside, break of 0.9392 minor resistance is needed to indicate short term bottoming. Otherwise, outlook will remain bearish in case of recovery.
In the bigger picture, the strong break of 0.9420 support suggests that fall from 1.0342 is developing into a medium term down trend. Deeper fall should be seen to 100% projection of 1.0342 to 0.9420 from 1.0037 at 0.9115. Break will target 161.8% projection at 08545. In any case, break of 0.9640 resistance is needed to be the first sign of medium term bottoming. Otherwise, outlook will stay bearish even in case of strong rebound.
Dollar Mixed ahead of NFP, Sterling Remains Strongest on Rate Bets
Dollar is trading generally higher in early US session as markets await job data from US. But for the week, Dollar is clearly mixed. In particular, the greenback is under some selling pressure against European majors and Canadian Dollar. EUR/USD, with yesterday's rebound, is back pressing 1.25 handle. Markets are expecting 180k growth in NFP in January. Other employment related data supports this healthy NFP number. Focus will again be on wage growth as average hourly earnings are expected to rise 0.3% mom.
Atlanta Fed predicts 5.4% annualized growth in Q1
According to Atlanta Fed's latest forecast, US GBP is set to rise at a stellar 5.4 annualized rate in Q1. If realized, that will be the best quarter since the global financial crisis. However, the accuracy of the forecast model is always under criticism. For example, back in 2017, Atlanta Fed's tracker predicted 3.4% growth in Q1 but it eventually turned out to be just 1.2% in the final reading. Some economists pointed to the 3.1% prediction of New York Fed's model as a more realistic, yet optimistic forecast.
UBS predicts May BoE hike, conditional on Brexit deal
Sterling continues to trade as the strongest one for the week as supported by rate hike bets. UBS brought forward their forecasts of next BoE hike to May, subject to Brexit transition deal. In a report published earlier this week, strategist John Wraith noted that the new forecast is "explicitly conditional". Also, he warned that "to be clear, while we are now revising our forecast to incorporate another rate hike we did not previously anticipate, we continue to believe the MPC took a risk with the U.K. economy by raising rates in November, and would be compounding this by doing so again in May."
BoJ offered to buy unlimited JGBs
BoJ conducted a special bond purchase operation today, offering to buy an "unlimited" amount of long-term JGBS. That's the first time in six months that such special operations were conducted. On the top of that, the purchase of 5- to 10- years JGBs was also raised from PY 410b to JPY 450b. It's seen by the markets as a pre-emptive move to fend off rise in JGB yields, which was taken higher by global counterparts in recent weeks.
On the data front
New Zealand building permits dropped -0.6% mom in December. Japan monetary base rose 9.7% yoy in January. Australia PPI rose 0.6%, 1.7% yoy in Q4. UK will release construction PMI while Eurozone will release PPI in European session. US will release non-farm payrolls, factor orders and U of Michigan sentiment final.
USD/CHF Daily Outlook
Daily Pivots: (S1) 0.9232; (P) 0.9287; (R1) 0.9317; More...
USD/CHF's break of 0.9288 indicates recent decline has resumed. Intraday bias is back on the downside. Current fall from 1.0037 should now extend to next key fibonacci level at 0.9115. On the upside, break of 0.9392 minor resistance is needed to indicate short term bottoming. Otherwise, outlook will remain bearish in case of recovery.
In the bigger picture, the strong break of 0.9420 support suggests that fall from 1.0342 is developing into a medium term down trend. Deeper fall should be seen to 100% projection of 1.0342 to 0.9420 from 1.0037 at 0.9115. Break will target 161.8% projection at 08545. In any case, break of 0.9640 resistance is needed to be the first sign of medium term bottoming. Otherwise, outlook will stay bearish even in case of strong rebound.
Economic Indicators Update
| GMT | Ccy | Events | Actual | Forecast | Previous | Revised |
|---|---|---|---|---|---|---|
| 21:45 | NZD | Building Permits M/M Dec | -9.60% | 10.80% | 9.60% | |
| 23:50 | JPY | Monetary Base Y/Y Jan | 9.70% | 11.00% | 11.20% | |
| 0:30 | AUD | PPI Q/Q Q4 | 0.60% | 0.40% | 0.20% | |
| 0:30 | AUD | PPI Y/Y Q4 | 1.70% | 1.20% | 1.60% | |
| 9:30 | GBP | Construction PMI Jan | 52 | 52.2 | ||
| 10:00 | EUR | Eurozone PPI M/M Dec | 0.20% | 0.60% | ||
| 10:00 | EUR | Eurozone PPI Y/Y Dec | 2.30% | 2.80% | ||
| 13:30 | USD | Change in Non-farm Payrolls Jan | 180K | 148K | ||
| 13:30 | USD | Unemployment Rate Jan | 4.10% | 4.10% | ||
| 13:30 | USD | Average Hourly Earnings M/M Jan | 0.30% | 0.30% | ||
| 15:00 | USD | Factory Orders Dec | 0.90% | 1.30% | ||
| 15:00 | USD | U. of Mich. Sentiment Jan F | 95 | 94.4 |
Aussie Trading On A Weaker Footing This Morning
For the 24 hours to 23:00 GMT, the AUD declined 0.06% against the USD and closed at 0.8037.
LME Copper prices declined 1.0% or $73.5/MT to $7027.0/MT. Aluminium prices declined 0.3% or $6.5/MT to $2218.0/MT.
In the Asian session, at GMT0400, the pair is trading at 0.8006, with the AUD trading 0.39% lower against the USD from yesterday's close.
In economic news, Australia's producer price index (PPI) climbed 0.6% QoQ in the three months to December 2017, after recording a rise of 0.2% in the previous quarter.
The pair is expected to find support at 0.7978, and a fall through could take it to the next support level of 0.7950. The pair is expected to find its first resistance at 0.8044, and a rise through could take it to the next resistance level of 0.8082.
Going forward, Australia's AiG performance of services as well as construction indices coupled with trade balance and retail sales data, all slated to release next week, would be on investors' radar.
The currency pair is trading below its 20 Hr and 50 Hr moving averages.

Euro-Zone’s Manufacturing Sector Growth Slowed As Initially Estimated In January, While Germany’s Manufacturing Activity Revised Lower In The Same...
For the 24 hours to 23:00 GMT, the EUR rose 0.73% against the USD and closed at 1.2506.
On the macro front, the Euro-zone final Markit manufacturing PMI eased to a level of 59.6 in January, confirming the preliminary print. In the previous month, the PMI had registered a reading of 60.6.
Separately, Germany's final Markit manufacturing PMI declined to a level of 61.1 in January, higher than a preliminary print indicating a fall to a level of 61.2. The PMI had registered a reading of 63.3 in the previous month.
In the US, data indicated that the ISM manufacturing PMI dropped less-than-anticipated to a level of 59.1 in January, compared to a revised level of 59.3 in the prior month. Markets were expecting the PMI to fall to a level of 58.6. Meanwhile, the nation's final Markit manufacturing PMI rose as initially estimated to a level of 55.5 in January, compared to a reading of 55.1 in the prior month.
Another set of data showed that construction spending in the US climbed 0.7% on a monthly basis in December, exceeding market expectations for an advance of 0.4%, as investment in private construction projects jumped to a record high. Construction spending had gained by a revised 0.6% in the prior month. Furthermore, the nation's initial jobless claims unexpectedly fell to a level of 230.0K in the week ended 27 January, confounding market estimates for a rise to a level of 235.0K and pointing to a vibrant labour market. In the prior week, initial jobless claims had registered a revised reading of 231.0K.
In the Asian session, at GMT0400, the pair is trading at 1.2498, with the EUR trading 0.06% lower against the USD from yesterday's close.
The pair is expected to find support at 1.2415, and a fall through could take it to the next support level of 1.2331. The pair is expected to find its first resistance at 1.2552, and a rise through could take it to the next resistance level of 1.2605.
With no key macroeconomic releases in the Euro-zone today, investors would turn their attention to the crucial US non-farm payrolls and unemployment rate data, both for January, scheduled to release later in the day. Additionally, the nation's final durable goods orders and factory orders for December as well as the final Michigan consumer sentiment index for January, will be eyed by traders.
The currency pair is trading above its 20 Hr and 50 Hr moving averages.

UK’s Manufacturing Sector Expanded At Its Weakest Pace Since June 2017 In January
For the 24 hours to 23:00 GMT, the GBP rose 0.49% against the USD and closed at 1.4263, brushing off data showing an unexpected drop in Britain's manufacturing sector.
Data showed that UK's Markit manufacturing PMI registered an unexpected drop to a level of 55.3 in January, hitting its lowest level in 7 months, indicating that the sector lost momentum after a strong performance in recent months. In the prior month, the PMI had registered a revised level of 56.2, while investors had envisaged for an advance to a level of 56.5.
Other data indicated that Britain's seasonally adjusted Nationwide house prices rose more-than-estimated by 0.6% MoM in January, compared to a similar rise in the prior month. Market participants had anticipated for a gain of 0.1%.
In the Asian session, at GMT0400, the pair is trading at 1.4272, with the GBP trading 0.06% higher against the USD from yesterday's close.
The pair is expected to find support at 1.4195, and a fall through could take it to the next support level of 1.4119. The pair is expected to find its first resistance at 1.4313, and a rise through could take it to the next resistance level of 1.4355.
Looking ahead, traders would keep a close watch on UK's Markit construction PMI for January, due to release in a few hours.
The currency pair is trading above its 20 Hr and 50 Hr moving averages.

Japanese Yen Trading On A Weaker Footing This Morning
For the 24 hours to 23:00 GMT, the USD rose 0.09% against the JPY and closed at 109.45.
In the Asian session, at GMT0400, the pair is trading at 109.54, with the USD trading 0.08% higher against the JPY from yesterday's close.
Overnight data indicated that Japan's monetary base climbed 9.7% on an annual basis in January, after recording a gain of 11.2% in the prior month.
The pair is expected to find support at 109.26, and a fall through could take it to the next support level of 108.99. The pair is expected to find its first resistance at 109.78, and a rise through could take it to the next resistance level of 110.03.
Going ahead, market participants would focus on Japan's Markit services PMI, (BOP basis) trade balance and the Eco-Watchers survey data, all set to release next week.
The currency pair is showing convergence with its 20 Hr moving average and trading above its 50 Hr moving average

Swiss Real Retail Sales Climbed In December, SVME-PMI Slightly Eased In January
For the 24 hours to 23:00 GMT, the USD declined 0.61% against the CHF and closed at 0.9262.
Data indicated that Switzerland's real retail sales climbed 0.6% on an annual basis in December, after registering a revised rise of 0.3% in the prior month. Moreover, the nation's SECO consumer climate index advanced more-than-estimated to a level of 5.0 in 1Q 2018, compared to market expectations for an increase to a level of 2.0. In the previous quarter, the index had registered a level of -2.0.
On the contrary, the nation's SVME–PMI registered a drop to a level of 65.3 in January, less than market anticipations for a fall to a level of 64.2. In the previous month, the PMI had registered a revised level of 65.6.
In the Asian session, at GMT0400, the pair is trading at 0.9265, with the USD trading marginally higher against the CHF from yesterday's close.
The pair is expected to find support at 0.9234, and a fall through could take it to the next support level of 0.9203. The pair is expected to find its first resistance at 0.9319, and a rise through could take it to the next resistance level of 0.9373.
Moving ahead, investors would look forward to Switzerland's unemployment rate data for January, the sole important release next week.
The currency pair is trading below its 20 Hr and 50 Hr moving averages.

Canada’s Manufacturing Sector Growth Notched A 9-Month High Level In January
For the 24 hours to 23:00 GMT, the USD declined 0.39% against the CAD and closed at 1.2266.
On the economic front, Canada's RBC manufacturing PMI increased to a level of 55.9 in January, surging to its highest level since April 2017, highlighting that manufacturing sector would likely be one of the bright spots for the Canadian economy. The PMI had registered a reading of 54.7 in the previous month.
In the Asian session, at GMT0400, the pair is trading at 1.2277, with the USD trading 0.09% higher against the CAD from yesterday's close.
The pair is expected to find support at 1.2245, and a fall through could take it to the next support level of 1.2212. The pair is expected to find its first resistance at 1.2321, and a rise through could take it to the next resistance level of 1.2364.
Next week, investors would closely monitor Canada's unemployment rate, housing starts and building permits data.
The currency pair is showing convergence with its 20 Hr moving average and trading below its 50 Hr moving average.

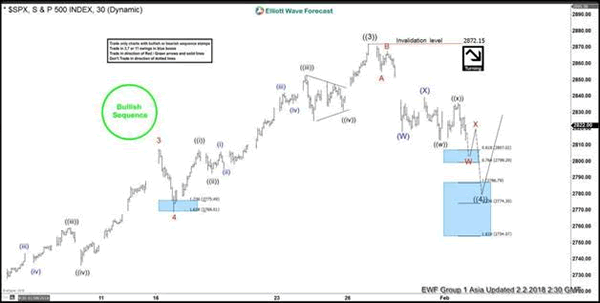
Elliott Wave View: SPX Correction Targets 2786
SPX Short Term Elliott Wave view suggests that Primary wave ((3)) ended with the rally to 2872.15. Decline from there in Primary wave ((4)) pullback is unfolding as a double three Elliott Wave structure where Intermediate wave (W) ended at 2818.27 and Intermediate wave (X) ended at 2839.26. While near term bounces stay below 2872.15, expect Index to extend lower in Intermediate wave (Y) of ((4)) towards 2774.3 - 2786.8 area. Afterwards, Index should resume the rally or at least bounce in 3 waves. We don't like selling the Index and expect buyers to appear from the above area for a 3 waves bounce at least.
SPX 1 Hour Elliott Wave Chart
USD/JPY Faces An Uphill Task, Focus Turns To US NFP
Key Highlights
- The US Dollar found support after trading as low as 108.28 against the Japanese Yen.
- There is a major bearish trend line forming with resistance at 110.30 on the 4-hours chart of USD/JPY.
- The US Initial Jobless Claims for the week ending Jan 27, 2018 declined from 231K to 230K.
- Today's US NFP release could impact USD/JPY and the next move in the near term (Forecast 180K versus 148K previous).
USD/JPY Technical Analysis
This past week was very bearish since the US Dollar declined below 110.00 against the Japanese Yen. Later, the USD/JPY pair found support near 108.30 and is currently recovering.
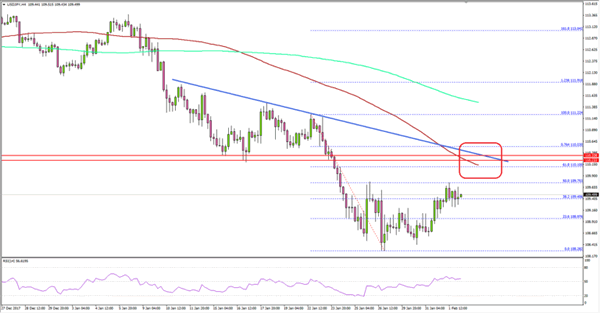
Looking at the 4-hours chart of USD/JPY, there was a sharp downside move once the pair broke the 110.40 and 110.30 support levels. It fell by around 200 pips and traded as low as 108.28.
Later, it started consolidating losses and slowly moved above the 23.6% Fib retracement level of the last decline from the 111.22 high to 108.28 low.
However, there are many barriers on the upside for buyers around the 110.00 level. There is also a major bearish trend line forming with resistance at 110.30 on the same chart.
More importantly, the mentioned 110.30 level was a support earlier, and now it is likely to act as a resistance. Furthermore, the 100 simple moving average (red, 4-hours) is also positioned at 110.25. Finally, the 61.8% Fib retracement level of the last decline from the 111.22 high to 108.28 low is at 110.10.
Therefore, there is a cluster of resistances starting with 110.00 up to 110.40. It won't be easy for the US Dollar buyers to gain momentum above the 110.00-110.40 levels.
On the downside, an initial support sits at 108.80. Below 108.80, the last low at 108.28 holds the key. Should the pair fail to move past 110.40, it could decline back to challenge 108.80.
US NFP and Possible Outcomes
Today, the US will see an important economic release since January's nonfarm payrolls figure will be reported by the US Department of Labor. The market is looking for an increase of 180K, more than the last 148K.
There could be three possible scenarios:
- The actual beats the forecast with a count of more than 180K. In this case, there are high chances of USD/JPY moving toward 110.40 and it could even break it.
- NFP comes around 165K-180K, and USD/JPY extends the current consolidation phase.
- NFP declines and the actual is around 140-160K. In this scenario, USD/JPY could start a fresh downside move.
- The overall market sentiment is stable heading into the stated high risk event (NFP). EUR/USD is slowly moving above 1.2400 and GBP/USD is consolidating gains above 1.4150.