Sample Category Title
Forex Technical Analysis: EUR/USD, USD/JPY, GBP/USD
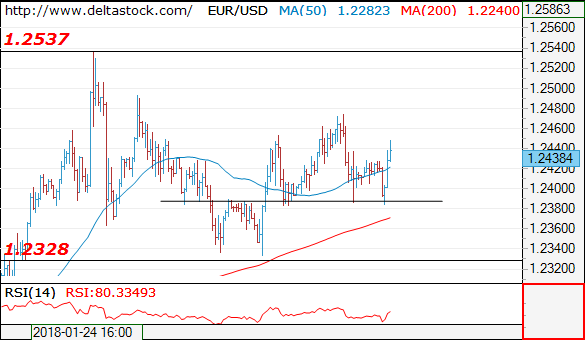
EUR/USD
Current level - 1.2438
The static support at 1.2390 is still intact and there is a risk of another upswing to 1.2500 area before next dip to 1.2330 major support.
| Resistance | Support | ||
| intraday | intraweek | intraday | intraweek |
| 1.2480 | 1.2540 | 1.2390 | 1.2330 |
| 1.2540 | 1.2870 | 1.2330 | 1.2220 |
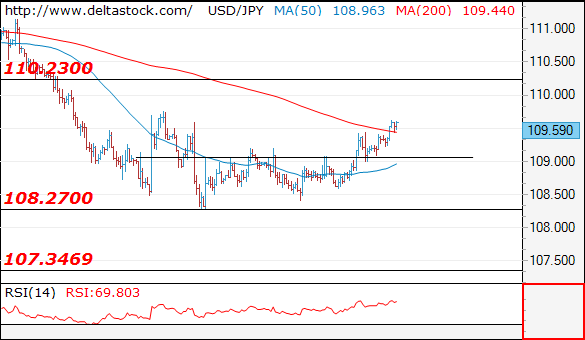
USD/JPY
Current level - 109.59
The intraday bias is positive above 109.00, for a rise towards 110.20 area.
| Resistance | Support | ||
| intraday | intraweek | intraday | intraweek |
| 109.80 | 110.20 | 108.25 | 108.50 |
| 110.20 | 112.00 | 108.25 | 107.30 |
GBP/USD
Current level - 1.4257
Current rise is expected to be limited below 1.4340 hurdle and the latter should provoke another sell-off towards 1.3910 support. Trigger on the downside is 1.4160.
| Resistance | Support | ||
| intraday | intraweek | intraday | intraweek |
| 1.4285 | 1.4340 | 1.4160 | 1.3910 |
| 1.4340 | 1.4730 | 1.4090 | 1.3730 |

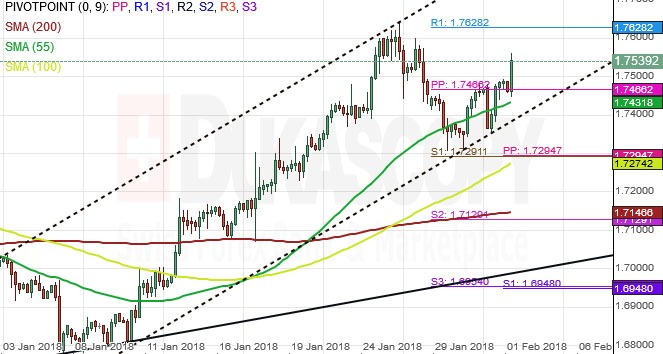
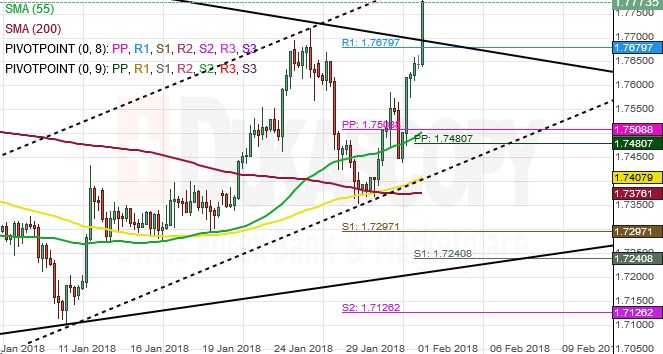
GBP/CAD 4H Chart: Ascending Channel Continues
The Pound has been steered by an ascending channel against the Aussie since early January. The movement started when the pair touched the lower boundary of the daily dominant channel.
The Bull movement is likely to continue for a short period of time until it reaches the weekly and the monthly PPs near the 1.7803 mark.
The overall market sentiment is bullish and it is might likely to continue for the following week until it reaches the upper boundary. If and when this happens, the GBP/CAD pair should retrace south for a brief period of time.
GBP/AUD 4H Chart: Possible Retracement
The British Pound has been bound by an ascending channel against the Australian Dollar since the beginning of January. The lower boundary of the dominant channel was reached on January 11 and the pair has since remained trading along the channel.
Meanwhile, a breakout from the upper boundary of the dotted triangle pattern can be observed on the chart.
Everything being equal, the pair is likely to continue its rally until it finds resistance at the combination of the weekly and monthly PPs near 1.7891 mark.
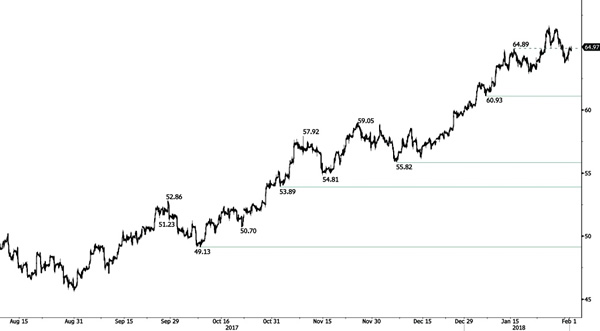
CRUDE OIL Increase
Crude oil is showing signs of recovery and ready to exceed 65. Strong support is given at 60.93 (05/01/2018 low). Expected to keep increasing as demand remains strong.
In the long-term, crude oil has recovered after its sharp decline last year. However, we consider that further weakness is very likely. For the time being the pair lies in an upside trend since June 2017. Support lies at 42.20 (16/11/2016) while resistance point is located at 77.83 (20/11/2014). Crude oil is trading largely above its 200 DMA.
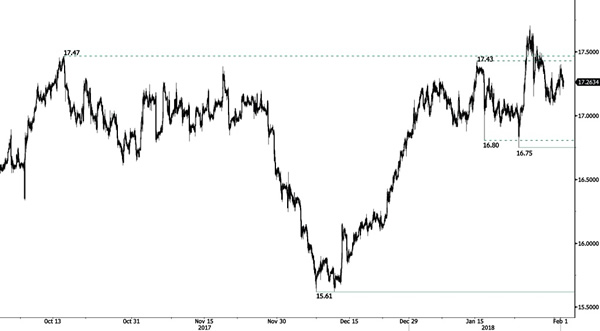
SILVER Flattening
Silver is stabilizing. Hourly support is at 16.75. The short-term technical structure remains positive as long as silver remains above 17. Hourly resistance lies at 18.21 (08/09/2017 high).
In the long-term, the trend remains negative/ sideways. Further downside is very likely. The pair is trading slightly above its 200 DMA. Resistance is located at 21.58 (10/07/2014 high). Strong support can be found at 11.75 (20/04/2009).
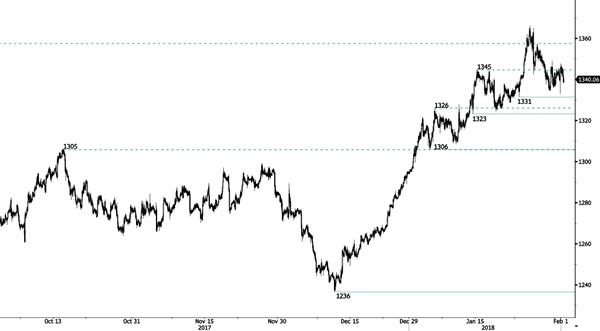
GOLD Slight Decrease
Gold is trading sideways after slight decrease of yesterday. Hourly support is at 1'331 (23/01/2018 low) while additional support is given at 1'323 (12/01/2018 low). The technical structure suggests further short-term upside moves.
In the long-term, the technical structure suggests that there is a growing upside momentum. A break of 1'392 (17/03/2014) is required to confirm it. A major support can be found at 1'045 (05/02/2010 low).
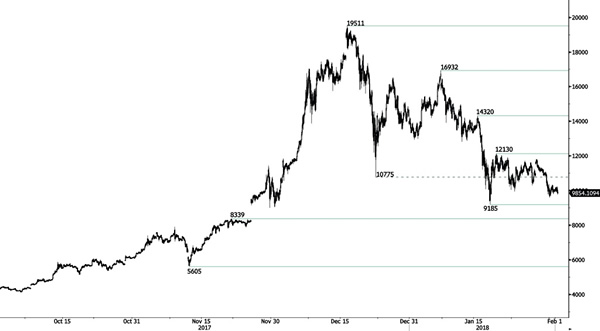
Bitcoin Weakening
Bitcoin is trading lower. Hourly support is at 9'185 (17/01/2018 low) while resistance is located at 12'130 (18/01/2018 high). The short-term technical structure suggests further decline.
In the long-term, the digital currency has had an exponential growth but also presented important downturns. There is decent likelihood that the currency could stabilize between 9'000 - 12'000 in 2018. Bitcoin is trading far above its 200 DMA (5K+ gap).
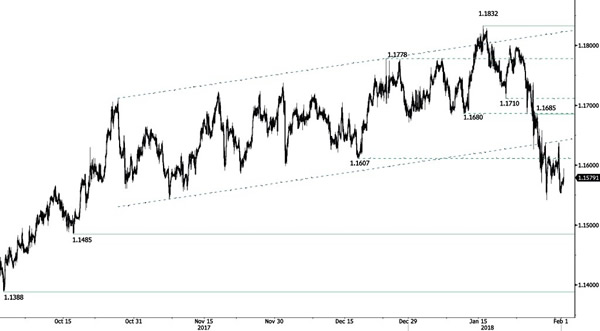
EUR/CHF Slight Recovery
EUR/CHF is trading higher after selling pressures of yesterday. Hourly resistance given at 1.1685 (26/01/2018 high) is getting distanced. Expected to show further short-term downside moves.
In the longer term, the technical structure has reversed. Strong resistance is given at 1.20 (level before the unpeg). Yet, the ECB's slowing QE program is likely to cause buying pressures on the euro, which should weigh in favour of the EUR/CHF. Supports can be found at 1.0184 (28/01/2015 low) and 1.0082 (27/01/2015 low).
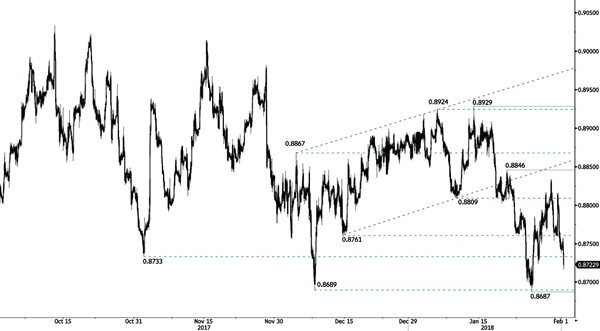
EUR/GBP Bearish Breakout
EUR/GBP is trading lower and is heading towards hourly support at 0.8687 (25/01/2018 low). Hourly resistance is given at 0.8846 (19/02/2018) while further resistance remains at 0.8929 (12/01/2018). The technical structure suggests further short-term downside move.
In the long-term, the pair has largely recovered from lows in 2015. The technical structure suggests an upside momentum. The pair is trading below the range of its 200 DMA. Strong resistance can be found at 0.9500 (psychological level).
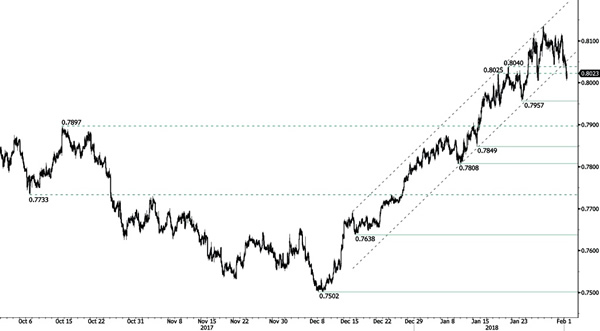
AUD/USD Skewed To The Downside
AUD/USD is weakening. Support stands at 0.7957 (23/01/2018 low) and is slowly nearing. The technical structure suggests further shortterm decrease.
In the long-term, the trend is turning positive. Key support stands at 0.6009 (31/10/2008 low). A break of the key resistance at 0.8164 (14/05/2015 high) is needed to invalidate our long-term bearish view.