Sample Category Title
USD/CAD Rising
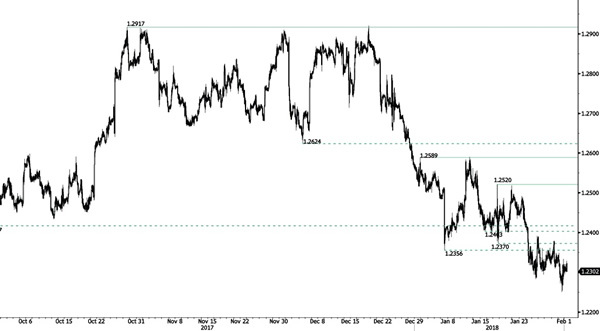
USD/CAD is bouncing back. Hourly resistance is given at 1.2520 (17/01/2018 high) while further resistance given at 1.2589 (01/01/2018) is momentarily out of reach. The technical structure indicates that additional weakness is achievable.
In the longer term, the pair is trading between resistance point at 1.3805 (05/05/2017 high) and support at 1.2128 (18/06/2015 low). Strong resistance is given at 1.4690 (22/01/2016 high). The pair is likely to head lower. The pairs is trading below 200 DMA.
USD/CHF Neutral
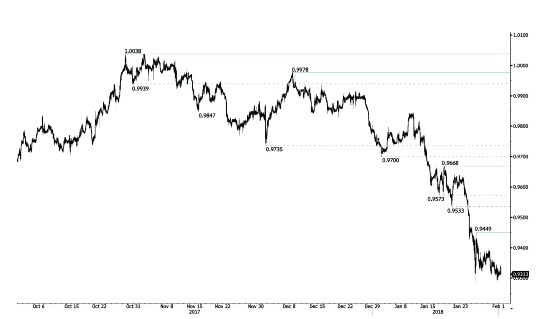
USD/CHF is trading mixed. The technical structure indicates that further weakness is likely. Hourly resistance is at 0.9449 (25/01/2018 high). Expected to show further short-term downside move.
In the long-term, the pair is still trading in range since 2011 despite some turmoil when the SNB unpegged the CHF. Support at 0.9259 (24/08/2015 low) is attainable. Key support remains at 0.9072 (07/05/2015 low) while resistance at 1.0344 (15/12/2016 high) is distanced. The technical structure favours a long term bullish bias since the unpeg in January 2015.
USD/JPY Bouncing Back After Weakness
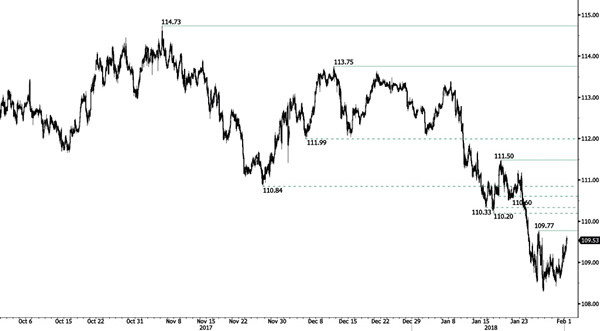
USD/JPY is rising following weakness and trades above 109.50. The current bullish momentum makes hourly resistance at 109.77 (26/01/2018 high) reachable. The technical structure suggests however further short-term downside moves.
We favor a long-term bearish bias. Support is now given at 107.32 (08/09/2017 low). A gradual rise towards the major resistance at 125.86 (05/06/2015 high) seems unlikely. Expected to decline further support at 101.20 (09/11/2016 low).
GBP/USD Heading Higher
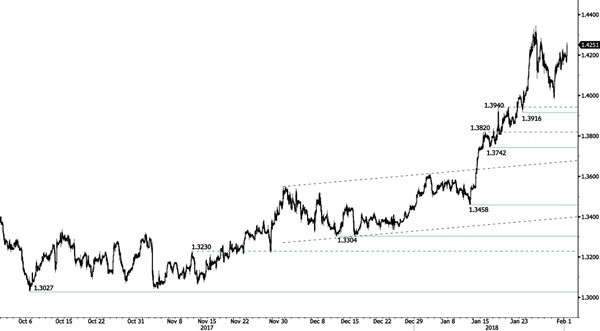
GBP/USD is trading up. The technical structure suggests further potential upside move. Hourly support is given at 1.3916 (23/01/2018 low).
The long-term technical pattern is reversing. The Brexit vote had paved the way for further decline but the pair is now moving up to 2016 highs. A long-term support given at 1.1841 (07/10/2017 low) and a strong resistance at 1.5018 (24/06/2016 high) are identified.
EUR/USD Pausing Before Another Leg Higher
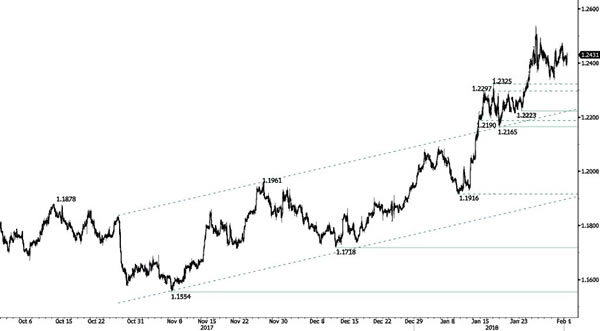
EUR/USD is progressing. The pair is now retracing and lies well above 1.2325 (17/01/2018 high). Hourly support is given at 1.2223 (23/01/2018 low). The technical structure suggests further short-term upside moves.
In the longer term, the momentum is turning largely positive. We favor a continued bullish bias. Key resistance is holding at 1.2856 (15/10/2014 high) while strong support lies at 1.1554 (08/11/2017 low).
EUR/USD Analysis: Bears Likely To Fail
Minor upside risks dominated the market during the first part of Wednesday. The Euro was gradually appreciating against the US Dollar until the daily high was reached at 1.2466. The pair was afterwards pushed lower down to the combined support of the 55– and 100-hour SMAs near 1.2420 where it remained located early this morning.
This trading session is market by low volatility. Given that bulls have failed to push the rate higher for several hours, the Euro might want to resume its movement southwards within this session. However, traders should be aware that the aforementioned support area is unlikely to surrender easily.
Meanwhile, even if bulls take this opportunity to push the rate higher today, gains should not exceed the 2015/2017 high of 1.25.
GBP/USD Analysis: Flashes Mixed Signals
The Pound remained stable against the US Dollar during the previous session. The pair tried to edge lower; however, this movement south was disrupted by a support cluster formed by the 100– and 55-hour SMAs and the weekly PP circa 1.4130.
As apparent on the chart, the Pound has been moving in a down-trend during the previous week. In case this trend is to persist, the Sterling should try to push for the monthly PP located at 1.40. However, the current southern barrier is expected to introduce changes to this assumption, thus sending the Pound slightly higher towards the 1,5-yeah high of 1.43.
Meanwhile, the failure to appreciate in this session would result in a slight period of consolidation that could in fact be an early indication of a medium-term decline.
USD/JPY Analysis: Points To Change In Sentiment
The USD/JPY was characterised by low volatility on Wednesday morning which was caused by the failure of bulls to overcome the 55– and 100-hour SMAs for several hours. This resistance cluster was eventually breached, but further advance was limited, as the weekly PP and the 200-hour SMA were likewise located nearby.
In general, the US Dollar is starting to recover against the Yen. However, the high positioning of technical indicators suggest that the most recent movement up might not be sustainable.
Apart from the 200-hour SMA which was already breached several hours ago, the nearest resistance is set by the boundaries of two channels near the 109.70 mark. Even if this area does not hold, the Greenback might reverse near 110.00.
XAUUSD Analysis: Forms Bullish Triangle
Following a three-day period of decline, Gold managed to recover some of its lost positions on Wednesday. During this time, the par remained fluctuating in between the bounds of the 55– and 100-hour SMAs.
The pair's movement during the past three sessions demonstrates the existence of a short-term ascending triangle. This pattern is generally a bullish formation that should guide the pair higher within the following days. This scenario is likewise reinforced by bullish technical indicators.
Thus, the yellow metal should strengthen against the US Dollar in this session. A confirmation of this scenario would be provided by a breakout of the weekly PP at 1,348.20. Conversely, possible losses should be limited by the 1,335.00.
USD/CAD: Canadian Gross Domestic Product
The Canadian GDP report caused stronger fluctuations in the USD/CAD exchange rate. The Loonie fell against the US Dollar 0.07% or 9 base points to the 1.2270 level.
Canada's economy expanded by the greatest extent in six months in November amid broad-based activity in manufacturing and other sectors, keeping the Central Bank on track to hike rates again. Statistics Canada stated that the country's gross domestic product increased 0.4% after being flat in October. Growth in the extraction of gas and oil, as well as real estate and retail sector contributed to the strong result. A solid economic expansion is likely to prompt the Bank of Canada to raise rates again, with the most of the odds for the hike by May.