
Sample Category Title
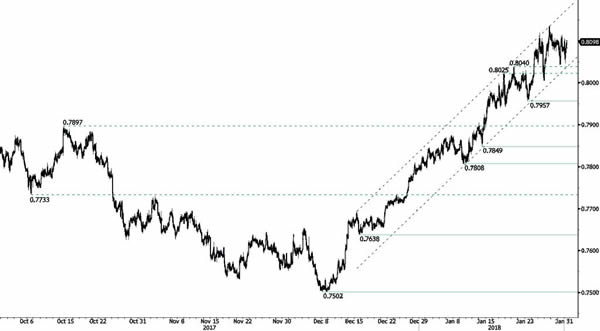
AUD/USD Targeting Resistance At 0.8134
AUD/USD's upside pressures are growing back. Hourly resistance given at a distance of 0.8134 (26/01/2018 high). Support stands at 0.7957 (23/01/2018 low). The road is wide open for further upside.
In the long-term, the trend is turning positive. Key support stands at 0.6009 (31/10/2008 low). A break of the key resistance at 0.8164 (14/05/2015 high) is needed to invalidate our long-term bearish view (drawing near).
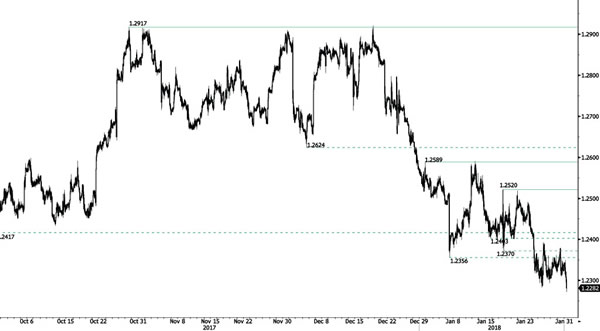
USD/CAD Skewed To The Downside
USD/CAD keeps on weakening. Hourly resistance is given at 1.2520 (17/01/2018 high) while further resistance given at 1.2589 (01/01/2018) is momentarily out of reach. The technical structure indicates that additional weakness is achievable.
In the longer term, the pair is trading between resistance point at 1.3805 (05/05/2017 high) and support at 1.2128 (18/06/2015 low). Strong resistance is given at 1.4690 (22/01/2016 high). The pair is likely to head lower. The pairs is trading below 200 DMA
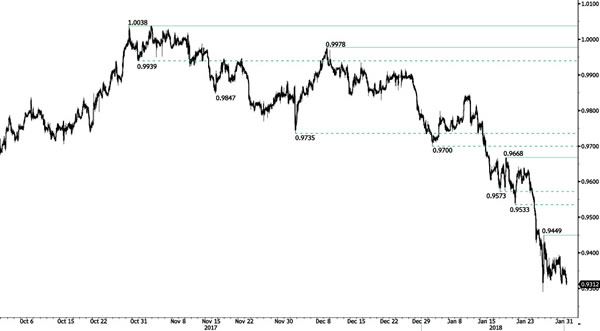
USD/CHF Bearish Breakout
USD/CHF is decreasing. The technical structure indicates that further weakness is likely. Hourly resistance is at 0.9449 (25/01/2018 high). Expected to show further short-term downside move.
In the long-term, the pair is still trading in range since 2011 despite some turmoil when the SNB unpegged the CHF. Support at 0.9259 (24/08/2015 low) is attainable. Key support remains at 0.9072 (07/05/2015 low) while resistance at 1.0344 (15/12/2016 high) is distanced. The technical structure favours a long term bullish bias since the unpeg in January 2015.
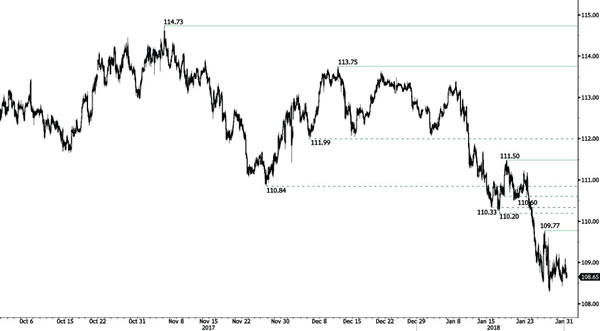
USD/JPY Sideways Trading
USD/JPY is trading below 109. A bearish breakout is achievable. Hourly resistance is at 109.77 (26/01/2018 high). The technical structure suggests further short-term downside moves.
We favor a long-term bearish bias. Support is now given at 107.32 (08/09/2017 low). A gradual rise towards the major resistance at 125.86 (05/06/2015 high) seems unlikely. Expected to decline further support at 101.20 (09/11/2016 low).
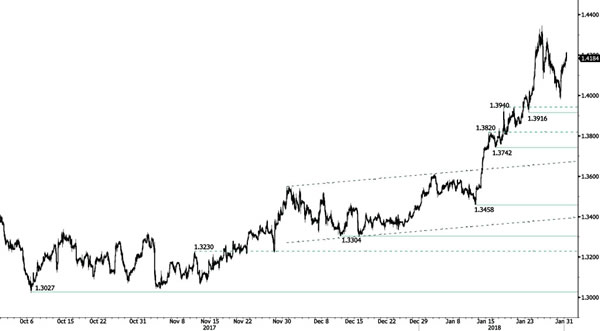
GBP/USD Taking Off
GBP/USD is trading up. The technical structure suggests further potential upside move. Hourly support is given at 1.3916 (23/01/2018 low).
The long-term technical pattern is reversing. The Brexit vote had paved the way for further decline but the pair is now moving up to 2016 highs. A long-term support given at 1.1841 (07/10/2017 low) and a strong resistance at 1.5018 (24/06/2016 high) are identified.
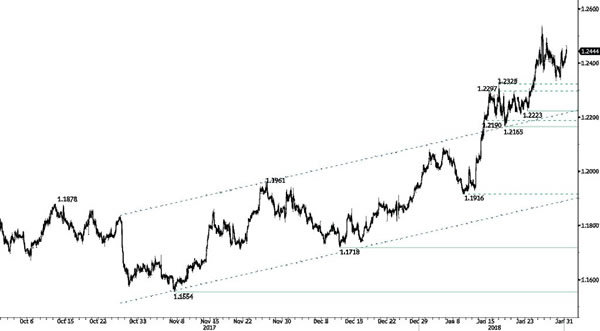
EUR/USD Rebouncing
EUR/USD is progressing. The pair is now retracing and lies well above 1.2325 (17/01/2018 high). Hourly support is given at 1.2223 (23/01/2018 low). The technical structure suggests further short-term upside moves.
In the longer term, the momentum is turning largely positive. We favor a continued bullish bias. Key resistance is holding at 1.2856 (15/10/2014 high) while strong support lies at 1.1554 (08/11/2017 low).
Will US Rates Finally Lift The Greenback?
FOMC: wait until March
Its widely expected that the FOMC will hold policy steady and signal that the next likely interest rate hike will come in March. Therefore, the focus will be on the language around the meeting. Today’s statement, in our view, will acknowledge that inflation risk have shifted upwards but no material change. We could see a shift from characterizing the economic outlook from “"Near-term risks to the economic outlook appear roughly balanced, but the Committee is monitoring inflation developments closely."” to just “balanced” give the quality of upwards data surprises. However, dragging expectation is the fact that inflation pressure remains subdued, allowing the fed to keep their options open. Inflation on a rolling 3 month average continues to print below the FOMC’s target of 2% while December’s core CPI data suggest trend inflation firming below the feds started goal. Markets continue to discount a hawkish fed, which could catch the ultra-short USD positioning flat-footed. US-G10 yield spread have absolutely blown out; increase our concern for a near term USD correction. Given the stretched nature of US-German spreads we see EURUSD as the most vulnerable to a pullback.
US stock markets down two days in a row
US stocks had a poor performance during the last two days, with a performance of -1.43% for Nikkei 225, -1.37% for Dow Jones and -1.09% for S&P500. This strong decrease is essentially correlated with rising oil production, announcements of health care competition on the US market and particularly worries that concern the ascending US treasuries U-curves. The decline was broad-based but particularly impacted (based on DJIA): Healthcare (-2.86%), Energy (-2.07%), Consumer Discretionary (-1.79%) and Information Technology (-1.30%).
With a +2.71% on the 10 years US Treasury notes (+0.66% since July 9th 2017) and +2.11% on the 2 year (+0.84% since July 9th 2017), the highest rate level since March 31st 2014, many investors and fund managers who rather look for income-based earnings have decided to trade up for a less volatile and risk-free investment, diminishing their equity exposure in the portfolio. 10 year US treasury and Bund differentials are now at +2.02% while UST and Japan lies at +2.6125.
USD is not following the trend and continues its depreciation against major currencies since January 9th 2018: EUR/USD +058%, GBP/USD +0.87%, JPY/USD +0.27%, USD/CHF -0.62%.
Though many investors tend to say that equity and commodity asset classes are going to suffer in the coming periods due to increasing attractiveness of Government bonds, we remain unconvinced that this will push out other investors than income-seeking bondholders or similar outside of equities for instance. We think that a more dovish Fed in 2018 will support risk, equities, commodities and US Treasury notes purchases.
EUR/JPY V Shaped Reversal For Uptrend Continuation
The EUR/JPY has made a V-shaped reversal pattern close to W L4, and at this point, we see a bullish impulse slightly above W H1 and H2 camarilla pivots. 132.15-25 is the POC zone where we could see a bounce towards W L3 -135.47. MACD also turned bullish. 4h close above W L3 suggest 135.94 as a potential target for the move. If 136.30 is broken in upcoming days, we might even see 136.74 as a continuation move.
W H1 -. Weekly Camarilla Pivot (Interim resistance - Weak)
W H2 - Weekly Camarilla Pivot (Weekly resistance)
W H3 - Weekly Camarilla Pivot (Weekly resistance - main)
W H4 - Weekly Camarilla Pivot (Strong Weekly Resistance)
W L4 - Weekly Camarilla Pivot (Interim support - Strong)
W L3 – Weekly Camarilla Pivot (Interim support - Main)
W L2 – Weekly Camarilla Pivot (Interim support)
W L1 - Weekly Camarilla Pivot (Interim support - Weak)
POC - Point Of Confluence (The zone where we expect price to react aka entry zone)
Technical Outlook: USDJPY – Narrow Consolidation To Precede Fresh Downside While Falling 10SMA Caps
The pair is holding in extended consolidation above 108.50 zone where strong bids temporarily halted bears.
Limited upside attempts signal that overall bears remain firmly in play for final push through 108.50/00 pivots towards key support at 107.31 (08 Sep low).
Congestion tops at 109.20 mark initial resistance ahead of more significant falling 10 SMA (109.67) and psychological 110.00 barrier, violation of which would sideline immediate bears and signal stronger correction of 113.38/108.28 bear-leg.
Res: 109.20, 109.67, 110.00, 110.23
Sup: 108.50, 108.28, 107.83, 107.31
Forex Technical Analysis: EUR/USD, USD/JPY, GBP/USD
EUR/USD
Current level - 1.2434
The climb above 1.2390 signals a reversal of the bearish bias since 1.2540 as market participants are getting ready for today's FOMC meeting. The intraday bias is positive above 1.2390, for another upswing towards 1.2540.
| Resistance | Support | ||
| intraday | intraweek | intraday | intraweek |
| 1.2460 | 1.2540 | 1.2390 | 1.2330 |
| 1.2540 | 1.2870 | 1.2330 | 1.2220 |

USD/JPY
Current level - 108.71
The overall bias remains bearish, for a violation of 108.25 low, towards 107.30 zone. Initial intraday resistance lies at 109.20.
| Resistance | Support | ||
| intraday | intraweek | intraday | intraweek |
| 109.20 | 110.20 | 108.25 | 108.50 |
| 110.20 | 112.00 | 108.25 | 107.30 |

GBP/USD
Current level - 1.4185
The break through 1.4090 signals a reversal of the whole slide from 1.4340 peak and the intraday bias is positive above the mentioned support, for a rise towards the previous high.
| Resistance | Support | ||
| intraday | intraweek | intraday | intraweek |
| 1.4215 | 1.4340 | 1.4090 | 1.3910 |
| 1.4340 | 1.4730 | 1.3985 | 1.3730 |
