Sample Category Title
Technical Outlook: GBPUSD – Rising 10SMA Maintains Bulls And Marks Key Near-Term Support
Cable extends recovery on Wednesday and probes through important barrier at 1.4205 (Fibo 61.8% of 1.4344/1.3979 pullback).
Strong downside rejection at key 1.40 support zone on Tuesday signaled that corrective phase from 1.4344 peak might be over.
Bulls are underpinned by rising 10SMA (currently at 1.4063) and will remain in play while the latter holds.
Sustained break above 1.4205 Fibo barrier would open 1.4286 (26 Jan lower top) and could lead for extension above 1.4300 barrier.
Conversely, renewed probes below 10SMA would soften near-term structure, while firm break below 1.40 support (Fibo 38.2% of 1.3457/1.4344 upleg) would signal deeper correction from 1.4344 (25 Jan peak, the highest since 24 June 2016 Brexit vote).
Res: 1.4212, 1.4286, 1.4344, 1.4400
Sup: 1.4135, 1.4063, 1.4048, 1.4000
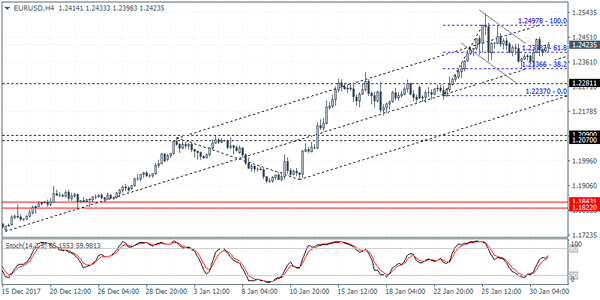
Technical Outlook: EURUSD Holds Firm Tone Head Of Batch Of Data
The Euro remains firm and moved higher in early Wednesday’s trading after downside attempts were repeatedly rejected at 1.2335, just above rising 10SMA which continues to underpin. Fresh upside cracked initial barrier at 1.2453 (Tuesday’s high) as dollar moved lower after US President Donald Trump’s State of the Union speech. Bullish techs continue to favor renewed attempts above 1.25 after rally stalled at 1.2537 last week. Thick hourly cloud (spanned between 1.2414 and 1.2376) marks initial support, followed by rising 10SMA (1.2347) which is expected to hold and maintain bullish bias Downbeat German retail sales data released earlier this morning (Dec -1.9% vs -0.4% f/c and 1.9% previous), showed little impact on the single currency, with focus turning towards German jobs data (Jan unemployment change -16K f/c vs -26K previous and unemployment rate forecasted unchanged at 5.5%) and EU CPI (Jan 1.3% f/c y/y vs 1.4% previous). US Federal Reserve policy decision, due later today, will be also closely watched for fresh signals. The Fed is widely expected to keep interest rates unchanged and focus will be on policy statement which could provide more signals about monetary policy outlook in coming months.
Res: 1.2462, 1.2493, 1.2537, 1.2597
Sup: 1.2414, 1.2376, 1.2347, 1.2335
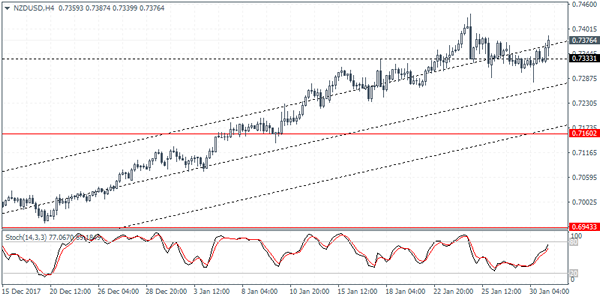
NZDUSD Intraday Analysis
NZDUSD (0.7376): The New Zealand dollar has stayed flat with prices consolidating near the 0.733 level. This potentially suggests that the upside could be exhausted. A major event catalyst could validate a downside move. This could come from today's FOMC meeting. Support for NZDUSD is seen at the technical level of 0.7160 that could be tested in the event that the kiwi dollar slips lower. Below 0.7160, another support level at 0.6943 could be in focus. Alternately, in the event that NZDUSD manages to bounce off the current levels, the currency pair will need to advance above January 24 highs at 0.7407 to maintain further gains.
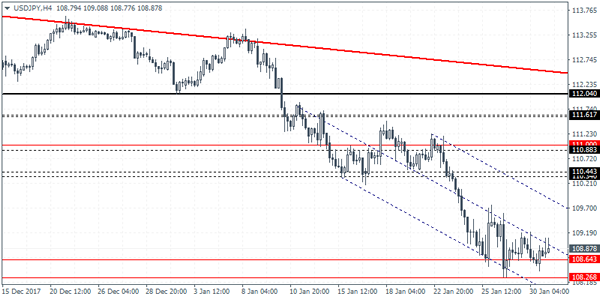
USDJPY Intraday Analysis
USDJPY (108.87): The USDJPY was seen trading flat yesterday with price action caught within the range from last Friday's high and low. Price action remains trading close to the 108.26 level in the near term. The modest decline yesterday resulted in a higher low being formed near the top end of the support at 108.64. A break out above 109.08 could suggest a reversal and a correction. The upside target comes in at 110.34 at the very least where the previously held support level could turn to resistance.
EURUSD Intraday Analysis
EURUSD (1.2423): The EURUSD managed to break out from the bullish flag pattern but the gains were quickly erased. Price action was seen falling back to the break out level and declined further. This potentially invalidates the bullish flag pattern unless the common currency is able to reverse the losses. The downside bias is now increasingly a risk for the EURUSD. Major support is seen at 1.2090 which could be tested. With the economic calendar busy today with data from the U.S. this could potentially weaken the euro further from the current highs. Despite the short term declines, the EURUSD is expected to maintain the bullish trend.
Euro Fails To Capitalize On GDP Data. Investors Turn To FOMC
The common currency posted strong intraday gains on the back of better than expected GDP data but the euro closed weaker by Tuesday's close.
The preliminary GDP data from the Eurozone released yesterday showed that the economy expanded 0.6% on the quarter ending December 2017. This was in line with the general expectations and it pushed the annual GDP to 2.7%. It was the fastest pace of annual GDP expansion since 2007. Germany and France GDP numbers were also released which managed to push the Eurozone economy higher and offset a weaker pace of GDP expansion from Spain.
Elsewhere, the BoE Governor Carney was quizzed by lawmakers. In his testimony, Carney brushed aside speculation of being overly biased towards Brexit and noted that inflation could remain at the current levels due to the depreciation in the exchange rate.
Looking ahead, a major event risk for the euro comes from the flash inflation estimates for the month of January. Economists forecast that consumer prices might have slowed even further at a pace of 1.3% on an annual basis. Core inflation is however expected to rise 1.0%, up from 0.9% in December. The ADP payrolls report will be coming up with forecasts showing a 191k gains in the private sector. This will be followed up later in the evening by the FOMC meeting. Fed officials are expected to keep rates steady.
Dollar On The Defensive Ahead Of FOMC, Eurozone Inflation On The Horizon
Here are the latest developments in global markets:
FOREX: The dollar index continued to retreat on Wednesday, trading 0.2% lower ahead of the FOMC policy decision later in the day.
STOCKS: Japanese markets were on the defensive, with the Nikkei 225 and the Topix indices falling 0.8% and 1.2% respectively, as the recent surge in bond yields continued to undermine investors' sentiment towards equities. This was also evident by the underperformance of US indices yesterday, with the S&P 500, Dow Jones and Nasdaq Composite all closing notably lower. The Dow fell 1.4%, the most out of the three, while the S&P followed closely, declining by 1.1%. That said, futures tracking the Dow, S&P and Nasdaq 100 are all currently in positive territory, suggesting these indices could open higher today.
COMMODITIES: Oil prices declined during the Asian session Wednesday, with WTI and Brent crude falling by 0.6% and 0.4% respectively, extending the notable losses they posted yesterday. The latest leg down came after the private API inventory data showed an increase in US inventories. Coming on top of the Baker Hughes oil rig data showing a sharp increase in active US oil rigs last week, the API prints probably helped to dent further the optimism surrounding the energy market. Today, investors will pay close attention to the official EIA US inventory data. In precious metals, dollar-denominated gold rose nearly 0.4%, last trading near $1343 per ounce, with the move likely being driven by the tumble in the greenback.
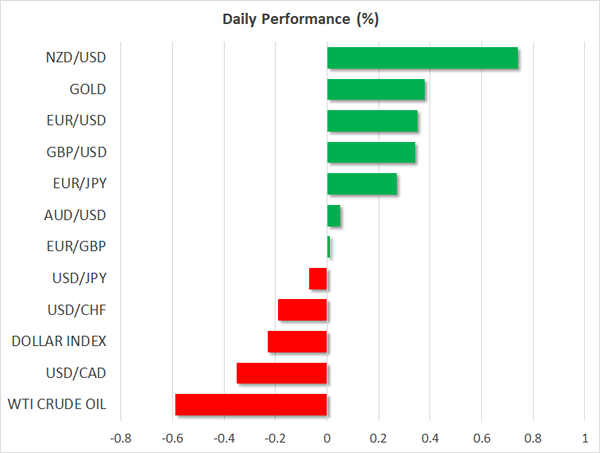
Major movers: Dollar awaits for FOMC; aussie recovers after disappointing data
The US dollar remained largely unfazed by President Trump's State of the Union address overnight, despite the President calling for a massive infrastructure spending plan that would cost at least $1.5 trillion. Despite this speech proving to be a non-event, the greenback is likely to remain at the center of attention, with the FOMC decision later today likely to determine the currency's short-term bias.
The Committee is almost certain to keep its policy unchanged, and since this is one of the 'smaller' meetings that do not include updated forecasts or a press conference, the price action will be driven by any changes in the phrasing of the accompanying statement. Market chatter suggests there is a likelihood for a more optimistic message from policymakers, amid an improving economic backdrop. Should this be a case indeed, the greenback could recover some of its latest losses on the decision. That said, considering that heightened pessimism currently surrounding the dollar, and the fact that a March rate hike by the Fed is fully priced in, any positive reaction could remain relatively short-lived.
Elsewhere, the aussie tumbled briefly during the Asian trading session, after Australia's inflation prints for the fourth quarter disappointed. Both the headline and the trimmed mean CPI rates rose, but by less than anticipated, likely denting expectations for a more optimistic tone by the RBA when it meets again next week. Nonetheless, aussie/dollar managed to recover almost all of its CPI-related losses in the following hours.
As for the rest of the commodity-linked currencies, both the kiwi and the loonie surged, with kiwi/dollar gaining 0.7% and dollar/loonie falling almost 0.4%. This may have been a result of the absence of any major statements on trade in President Trump's address overnight. The President may have been expected to discuss his 'America first' policy and perhaps signal more protectionist measures to come. Since he did not, investors may have taken the opportunity to re-enter long NZD, AUD, and CAD positions, as all of these export-driven economies are very sensitive to the global trade outlook.
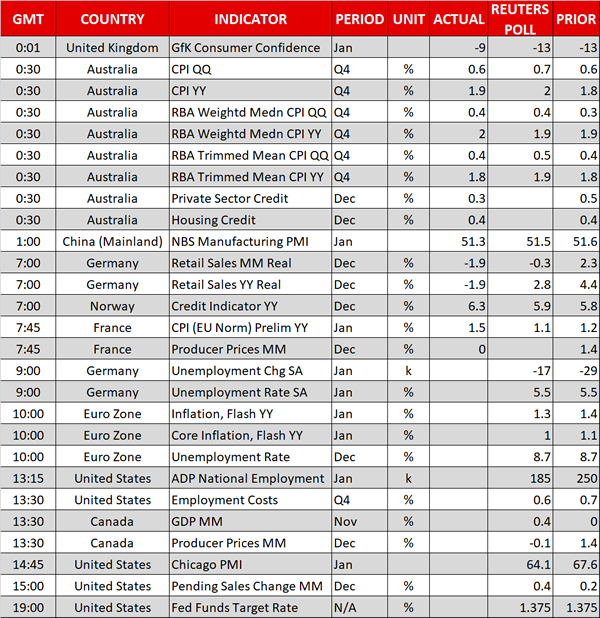
Day ahead: Eurozone inflation, Fed meeting and Canadian GDP due
January flash inflation figures out of the eurozone will be dominating attention during morning European trading hours. On an annual basis, both headline and core (that excludes volatile food and energy items) inflation are expected to slightly ease relative to December's respective numbers, remaining well below the ECB's target for inflation of below but close to 2%. The numbers will go public at 1000 GMT, at the same time that the eurozone's unemployment rate for the month of December will be released. The unemployment rate is anticipated to remain at the nine-year low of 8.7%. One hour earlier (at 0900 GMT), Germany, the euro area's largest economy, will see the release of unemployment data for the month of January.
Over in the US, the Fed meeting – the last presided by chair Yellen – will be the highlight of the day and the one having the greatest potential to lead to positioning on the dollar. No change in rates is expected, though a 'hawkish hold', one that lends supports to the dollar, is not to be ruled out. The interest rate decision and accompanying statement will be made public at 1900 GMT.
Before the completion of the Fed meeting, other data out of the US that will attract interest include January's ADP national employment report (1315 GMT) on positions added to the economy by the private sector – this is often viewed as a precursor to the nonfarm payrolls report which is due on Friday – January's Chicago PMI (1445 GMT) and pending home sales data for December (1500 GMT).
Interesting for loonie traders would be Canadian GDP data for the month of November and December producer prices out of the country. Both readings will be made public at 1330 GMT.
The EIA report including information on US crude and gasoline inventories for the week ending January 26 is due at 1530 GMT. Crude stocks are expected to increase by around 0.1 million barrels, after decreasing for ten straight weeks. This compares to a drawdown of around 1.1m barrels in the week that preceded.
In equity markets, AT&T, Boeing, Facebook and Microsoft will be among companies releasing quarterly earnings on Wednesday.
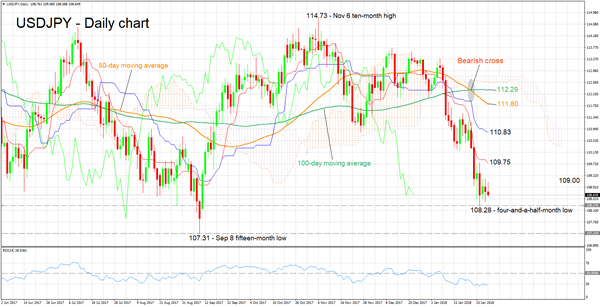
Technical Analysis: USDJPY negative bias still in play
USDJPY lost significant ground in recent weeks, eventually reaching a four-and-a-half-month low of 108.28 on January 26. The Tenkan- and Kijun-sen lines are negatively aligned and the RSI indicator is below its 50 neutral-perceived level. All these point to a negative short-term bias. However, notice that the RSI has been moving sideways in recent days, perhaps suggesting that negative momentum is losing steam.
Should a hawkish message prevail in the FOMC statement later on Wednesday, then USDJPY is likely to advance. In this case, resistance could be met around the current level of the Tenkan-sen at 109.75 – including the 110 handle, a level of potential psychological significance. The 109 level below might also act as a psychological barrier.
If the Fed's message falls short in terms of 'hawkishness' however, the pair could extend its decline, with last week's four-and-a-half-month low of 108.28 coming into view as immediate support. Additional losses would shift the focus to the 15-month low of 107.31 that was recorded on September 8.
Daily Wave Analysis: EUR/USD Bullish Bounce And Breakout After ABC Pattern
Currency pair EUR/USD
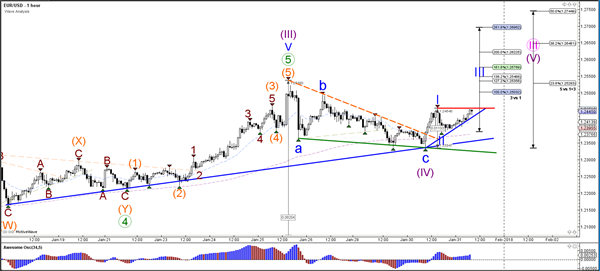
The EUR/USD bearish retracement seems to have ended after bouncing at the support zone and trend lines. The bearish wave C (blue) did not manage to break the bottom of wave A by much before price continued moving higher. The bullish break above the resistance trend line (red) is probably indicating the start of wave 5 (purple) but be aware that if price fails to break above 1.25, price could still expand the wave 4 (purple) via a WXY correction.
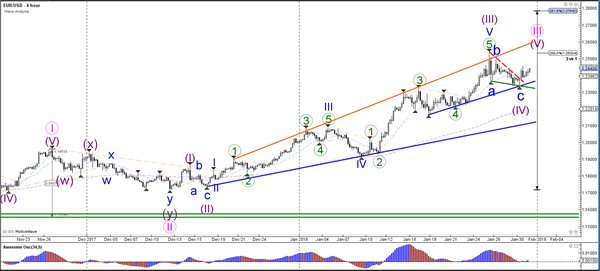
The EUR/USD needs to break above the local resistance line (red) before a potential wave 3 (blue) can start. A break below support (blue) could expand wave 2 (blue) or wave 4 (purple).
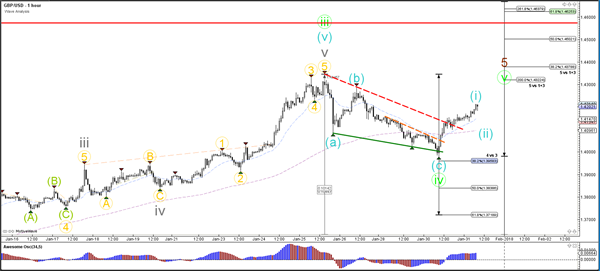
Currency pair GBP/USD
The GBP/USD bounced at the 38.2% Fibonacci retracement of wave 4 (green). The bullish breakout above the resistance trend line (dotted red) could indicate an uptrend continuation within wave 5 (green).
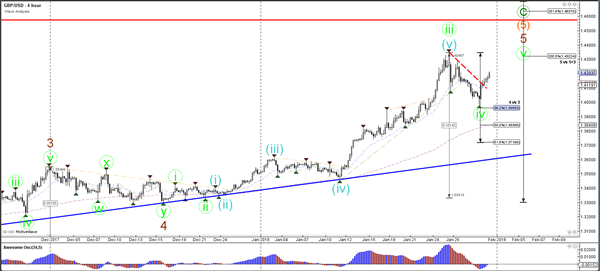
The GBP/USD could first build a pullback after the bullish breakout as part of a potential wave 1-2 pattern (blue).
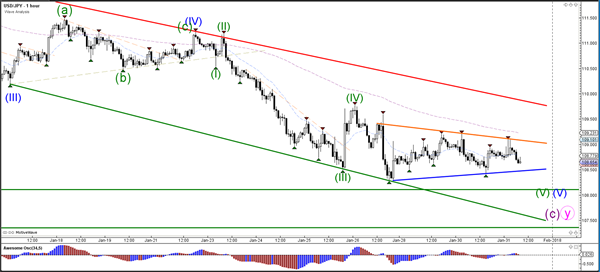
Currency pair USD/JPY
The USD/JPY is building a triangle corrective chart pattern as part of a larger downtrend. Price is also close to a strong support zone (green line) from the daily chart.
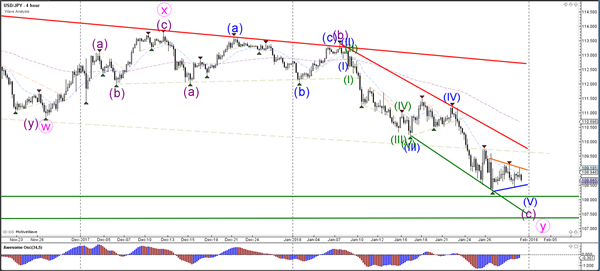
The USD/JPY remains in a triangle chart pattern. A bullish break above the pattern could indicate the end of the downtrend whereas a break below the support zone (horizontal green) could indicate a continuation of the downtrend.
China Watch: Weakness In Manufacturing Activities Offset By Robust Services Sector
China’s official manufacturing PMI slipped -0.3 point to 51.3 in January, compared consensus of 51.5, as almost all sub-indices dropped during the month. The non-manufacturing PMI added +0.3 point to 55.3, beating expectations of 55, in January. Note that the services sector contributes about 80% and construction sector contributes 20% to the index. The services PMI rose +1 point 54.4 while the construction PMI slipped -3.4 points to 60.5 during the month. Besides the abovementioned barometers, the government introduced the composite PMI output index which steadied at 54.6 in January. The index is calculated as the weighted average of the headline non-manufacturing PMI and the output sub-index of the manufacturing PMI. The government indicated that the composite PMI is a more comprehensive indicator for overall economic growth in China. Overall, the December report revealed deceleration in the country’s growth in the manufacturing activities. This was, however, offset by the stronger growth in the services sector.

In the manufacturing sector, both 'production' and 'new order sub-indices dropped this month, falling -0.5 point to 53.5 and -0.8 point to 54, respectively. The employment sub-index slipped - 0.2 point to 48.3. Meanwhile, both input and output price sub- indices dropped in January. While the former fell to 59.7 from 62.2, the latter was down to 54.4 from 51.8 this month. This might imply further slowdown in inflation as the 2018 begins. Meanwhile, trade-related indicators softened, with new export orders drifting to the contractionary territory (at 49.5) in January, from 51.9 in December, and imports falling to 50.4 from 51.2 in December.
On the non-manufacturing sector, including services and construction activities, new orders sub-index slid -0.1 point to 51.9. Meanwhile, the input prices sub-index fell -0.9 point to 53.9 while the sales price sub-index stayed unchanged 52.6. The employment sub-index climbed +0.1 point higher to 49.4. While staying in the contractionary territory, the situation has improved. Meanwhile, the decline was mainly driven by the construction sector.
The manufacturing PMI is often interpreted as a leading indicator of China’s IP growth data. Recall that in December, IP growth expanded +6.2% y/y, up from November’s +6.1%. Concerning individual industries, steel products, ferrous metal, and electricity production improved from the same period last year, but crude oil manufacturing and automobile manufacturing growth decelerated. Since the manufacturing PMI surprised to the downside in January, we would not be surprised of IP growth in January slowed. For the year ahead, we see domestic demand growth to moderate as the government continues to adopt targeted monetary tightening measures to curb excessive expansion of certain industries. Meanwhile, a relative strong renminbi might soften exports growth.
AUDUSD Sees Bullish Bias With Scope To Extend Higher, Next Stop 0.8300
AUDUSD retreated over the previous two days, following the bounce off the 32-month high of 0.8135. Looking on the medium-term timeframe, the pair has been in bullish phase since January 2016, supported by higher bottoms and higher peaks.
Despite the small retracement on the short-term chart, the price still endorses the sharp upward movement as it hit the 0.7500 strong psychological level and created consecutive winning weeks.
After this month's strong moves, the expectation for the pair is for further profit taking and could drive the price until the 0.8300 handle if the price surpasses 0.8135. A penetration above the aforementioned obstacle could open the door for the next psychological level of 0.8500.
On the downside, if prices reverse lower, the next pause could be on the 0.8000 handle, which is near the 23.6% Fibonacci retracement level of the up-leg from 0.7500 to 0.8135. Slightly below the Fibonacci mark, the mid-level of the Bollinger Band holds at 0.7970, at the time of writing. Clearly those levels, the price could fall until the 38.2% Fibonacci mark at 0.7900.
In addition, the RSI indicator is still holding in the overbought area and is pointing to the upside. However, there is also the case of a bearish scenario as the upswing may be running out of steam and the risk of a near-term correction is high. The MACD oscillator is still standing in the positive territory above the trigger line but is moving with weaker momentum than before.