
Sample Category Title
GBP/USD Daily Outlook
Daily Pivots: (S1) 1.4029; (P) 1.4098; (R1) 1.4216; More.....
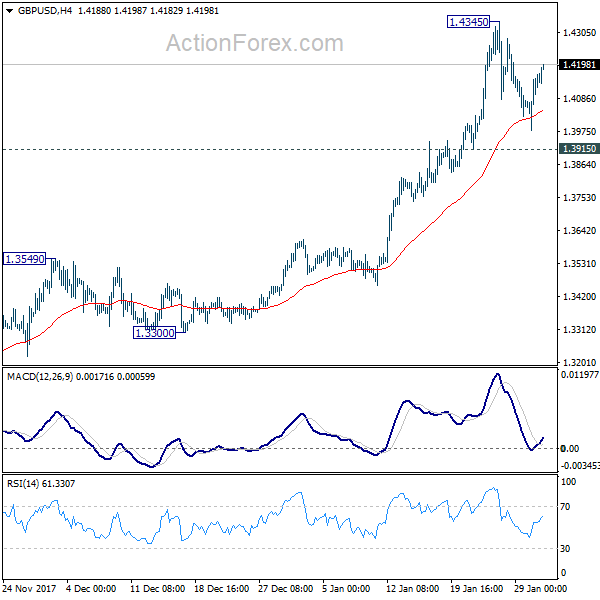
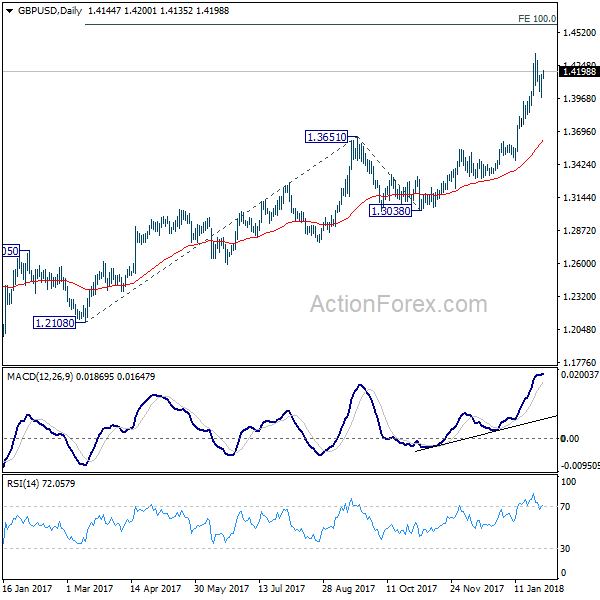
GBP/USD is staying in consolidation below 1.4345 and intraday bias remains neutral first. More corrective trading could be seen. But downside should be contained by 1.3915 support to bring rally resumption. On the upside, break of 1.4345 will resume medium term up trend to 100% projection of 1.2108 to 1.3651 from 1.3038 at 1.4581 next. However, break of 1.3915 will argue that, at least, deeper pull back in underway to 1.3651 resistance turned support.
In the bigger picture, sustained break of 1.3835 key resistance level indicates that rebound from 1.1946 is at least correcting the long term down from from 2007 high at 2.1161. Further rise should now be seen back to 38.2% retracement of 2.1161 (2007 high) to 1.1946 (2016 low) at 1.5466. Medium term outlook will stay bullish as long as 1.3038 support holds, in case of pull back.
Swiss Trade Surplus Increased In December
For the 24 hours to 23:00 GMT, the USD declined 0.4% against the CHF and closed at 0.9347.
In economic news, trade surplus in Switzerland widened to CHF2.63 billion in December, after recording a revised trade surplus of CHF2.58 billion in the previous month.
On the contrary, the nation’s KOF leading indicator declined to a level of 106.9 in January, more than market expectations for a fall to a level of 110.8. The index had recorded a revised level of 111.4 in the prior month.
In the Asian session, at GMT0400, the pair is trading at 0.9338, with the USD trading 0.1% lower against the CHF from yesterday’s close.
The pair is expected to find support at 0.9302, and a fall through could take it to the next support level of 0.9266. The pair is expected to find its first resistance at 0.9382, and a rise through could take it to the next resistance level of 0.9426.
Ahead in the day, traders would focus on Switzerland’s ZEW expectations index for January as well as the UBS consumption indicator for December.
The currency pair is showing convergence with its 20 Hr moving average and trading below its 50 Hr moving average.

Loonie Trading On A Stronger Footing, Ahead Of Canada’s GDP Data
For the 24 hours to 23:00 GMT, the USD declined 0.11% against the CAD and closed at 1.2337.
In the Asian session, at GMT0400, the pair is trading at 1.2318, with the USD trading 0.15% lower against the CAD from yesterday's close.
The pair is expected to find support at 1.2292, and a fall through could take it to the next support level of 1.2267. The pair is expected to find its first resistance at 1.2361, and a rise through could take it to the next resistance level of 1.2405.
Trading trend in the CAD today is expected to be determined by the release of Canada's GDP data for November, set to release later in the day.
The currency pair is showing convergence with its 20 Hr moving average and trading below its 50 Hr moving average.

USD/CHF Daily Outlook
Daily Pivots: (S1) 0.9301; (P) 0.9347; (R1) 0.9384; More...
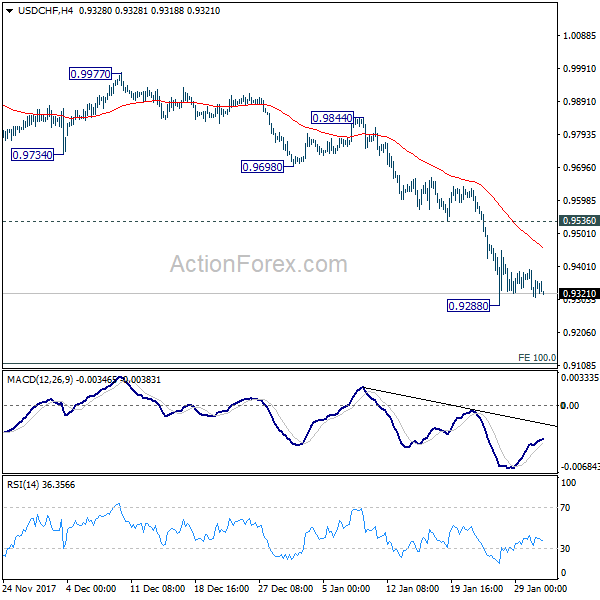
USD/CHF is staying in consolidation above 0.9288 temporary low. Intraday bias remains neutral first. But with 0.9536 resistance intact, outlook stays bearish and deeper fall is expected. Break of 0.9288 will resume the larger down trend and target next key fibonacci level at 0.9115.
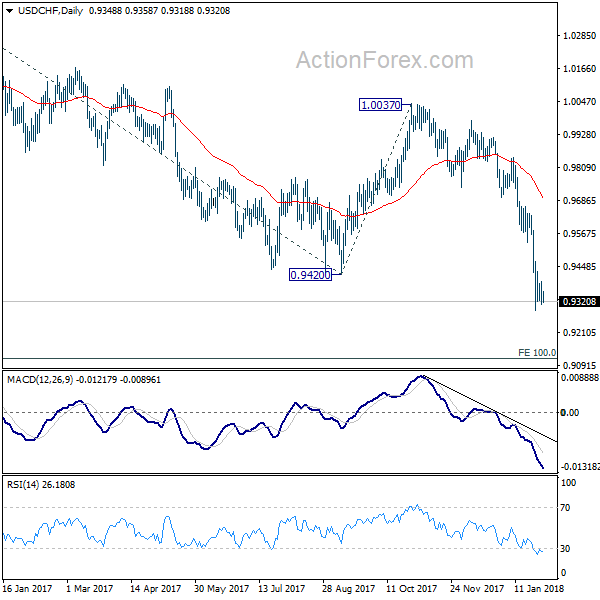
In the bigger picture, the strong break of 0.9420 support suggests that fall from 1.0342 is developing into a medium term down trend. Deeper fall should be seen to 100% projection of 1.0342 to 0.9420 from 1.0037 at 0.9115. Break will target 161.8% projection at 08545. In any case, break of 0.9640 resistance is needed to be the first sign of medium term bottoming. Otherwise, outlook will stay bearish even in case of strong rebound.
USD/JPY Daily Outlook
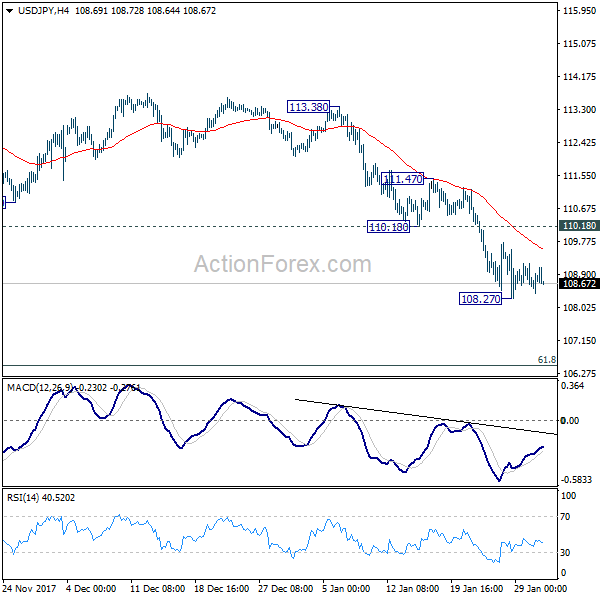
Daily Pivots: (S1) 108.39; (P) 108.79; (R1) 109.18; More...
USD/JPY continues to stay in consolidation above 108.27 temporary low. Intraday bias remains neutral for the moment. As long as 110.18 resistance holds, deeper decline is expected. On the downside, break of 108.27 will extend recent fall through 107.31 support to next fibonacci support at 106.48. Nonetheless, break of 110.18 will be the first sign of near term reversal and will turn bias back to the upside for 111.47 resistance.
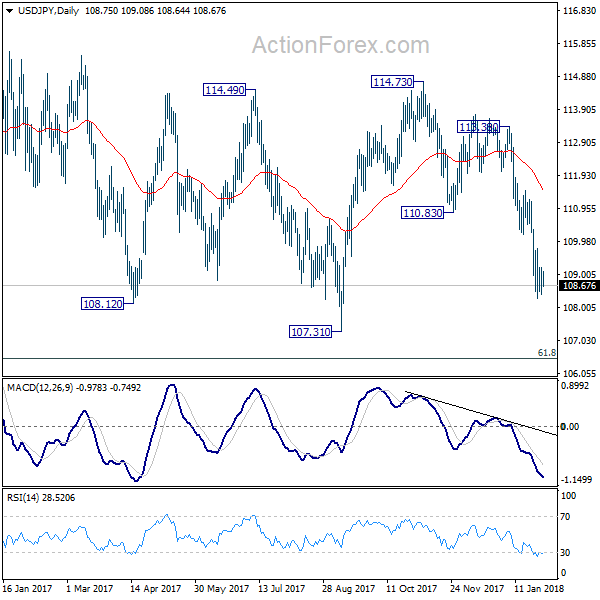
In the bigger picture, current development argues that the corrective pattern from 118.65 is extending. There is risk of dropping further to 61.8% retracement of 98.97 to 118.65 at 106.48. But this level should provide strong support to contain downside and bring resumption of rise from 98.97. However, sustained break of 106.48 will now likely send USD/JPY through 98.97 to resume the corrective fall from 125.85 (2015 high).
Dollar Yawns Trump’s SoU Address, Decline Might be Resuming With FOMC Watched
The forex markets remain generally in consolidation mode today. US President Donald Trump's State of Union address provides little inspiration. Nonetheless, the soft tone of Dollar in Asian session suggests that it might be ready to resume recent decline, probably subject to FOMC statement. In other markets, DOW dropped -362 pts overnight to close at 26076.89. The index has likely started the long overdued near term correction and should head lower, possibly back to 25000 handle. 10 year yield extended recent rally to 2.726, up 0.030, but again, provides little support to Dollar.
BoJ Iwata: Some distance to 2% inflation
BoJ Deputy Governor Kikuo Iwata said today that the "powerful" monetary easing should be maintained. He noted "the economy is expanding moderately but prices remain weak." And, "there's some distance to 2 percent inflation." And he called for "government steps, as well as appropriate monetary policy, are necessary to achieve price stability with sustained economic growth." BoJ released summary of opinions from the January meeting. One member said that recent surge in market expectation of stimulus exit would be "undesirable".
Released from Japan, consumer confidence was unchanged at 44.7 in January. Housing starts dropped -2.1% yoy in December. Industrial production rose 2.7% mom in December.
Australia CPI picked up but missed expectations
Australia CPI accelerated to 1.9% yoy in Q4, up fro Q3's 1.8 yoy. However, this came in weaker than expectations of 2.0% yoy. On RBA's other inflation measures, the trimmed mean CPI stayed unchanged at 1.8%, missing consensus of 1.9%. The weighted median CPI rose to 2.0% from 1.9% in the third quarter. This exceeded expectations of 1.9%. The set of inflation data gives no pressure for RBA to hike any time soon. And indeed, recent rally in Aussie's exchange rate could give some downward pressure to inflation in near term ahead. And, there is still a lack of evidence of pick up in wage growth. Aussie weakens mildly after the release.
China manufacturing PMI slipped to 51.3
From China, official manufacturing PMI slipped -0.3 point to 51.3 in January, comparing to consensus of 51.5. Non-manufacturing PMI added 0.3 point to 55.3, beating expectations of 55. Note the government's PMI estimates cover large corporations while the one compiled by Caixin/ Markit covers medium to small firms. Traders should interpret China's economic data with caution as the accuracy is under question. HSBC complained about the country's lack of transparency and withdrew from being the partner of Markit in compilation of China's PMI data in 2015. Meanwhile, several provincial and local governments including Inner Mongolia and Tianjin have admitted exaggerating the economic data earlier this month.
GBP lifted mildly by hawkish
British pound resumed strength as BOE Governor Mark sent some hawkish messages. As he suggested, "as slack in the economy has been taken out, we've moved into a more conventional area for monetary policy where the focus is increasingly on returning inflation sustainably to target over an appropriate horizon".
Release from UK, Gfk consumer confidence rose to -9 in January. BRC shop price index dropped -0.5% yoy in January.
Looking ahead
FOMC rate decision is the main focus of the day. While it is widely expected that no change would be made in the monetary policy, the market focus is on the Fed's economic outlook and whether there are hints on the rate hike path. Notwithstanding the fact that inflation has remained soft, the robust employment market, with unemployment rate below the Fed's long-term target, should have anchored the Fed's confidence over the economic outlook. We do expect the Fed to address the issue recent USD weakness. On the monetary policy outlook, the market continued to price in over 70% of a rate hike in March.
In addition, Germany will release retail sales and unemployment. Eurozone will release CPI and unemployment. Swiss will release UBS consumption indicator.
Later in the day, US will release ADP employment, employment cost index, Chicago PMI and pending home sales. Canada will release GDP, IPPI and RMPI.
USD/JPY Daily Outlook
Daily Pivots: (S1) 108.39; (P) 108.79; (R1) 109.18; More...
USD/JPY continues to stay in consolidation above 108.27 temporary low. Intraday bias remains neutral for the moment. As long as 110.18 resistance holds, deeper decline is expected. On the downside, break of 108.27 will extend recent fall through 107.31 support to next fibonacci support at 106.48. Nonetheless, break of 110.18 will be the first sign of near term reversal and will turn bias back to the upside for 111.47 resistance.
In the bigger picture, current development argues that the corrective pattern from 118.65 is extending. There is risk of dropping further to 61.8% retracement of 98.97 to 118.65 at 106.48. But this level should provide strong support to contain downside and bring resumption of rise from 98.97. However, sustained break of 106.48 will now likely send USD/JPY through 98.97 to resume the corrective fall from 125.85 (2015 high).
Economic Indicators Update
| GMT | Ccy | Events | Actual | Forecast | Previous | Revised |
|---|---|---|---|---|---|---|
| 23:50 | JPY | BOJ Summary of Opinions | ||||
| 23:50 | JPY | Industrial Production M/M Dec P | 2.70% | 1.50% | 0.50% | |
| 0:01 | GBP | GfK Consumer Confidence Jan | -9 | -13 | -13 | |
| 0:01 | GBP | BRC Shop Price Index Y/Y Jan | -0.50% | -0.40% | -0.60% | |
| 0:30 | AUD | CPI Q/Q Q4 | 0.60% | 0.70% | 0.60% | |
| 0:30 | AUD | CPI Y/Y Q4 | 1.90% | 2.00% | 1.80% | |
| 0:30 | AUD | CPI RBA Trimmed Mean Q/Q Q4 | 0.40% | 0.50% | 0.40% | |
| 0:30 | AUD | CPI RBA Trimmed Mean Y/Y Q4 | 1.80% | 1.90% | 1.80% | |
| 0:30 | AUD | CPI RBA Weighted Median Q/Q Q4 | 0.40% | 0.50% | 0.30% | |
| 0:30 | AUD | CPI RBA Weighted Median Y/Y Q4 | 2.00% | 1.90% | 1.90% | |
| 1:00 | CNY | Manufacturing PMI Jan | 51.3 | 51.5 | 51.6 | |
| 1:00 | CNY | Non-manufacturing PMI Jan | 55.3 | 55 | 55 | |
| 5:00 | JPY | Consumer Confidence Jan | 44.7 | 44.9 | 44.7 | |
| 5:00 | JPY | Housing Starts Y/Y Dec | -2.10% | 1.10% | -0.40% | |
| 7:00 | EUR | German Retail Sales M/M Dec | -0.40% | 2.30% | ||
| 7:00 | CHF | UBS Consumption Indicator Dec | 1.67 | |||
| 8:55 | EUR | German Unemployment Change Jan | -20K | -29K | ||
| 8:55 | EUR | German Unemployment Claims Rate Jan | 5.40% | 5.50% | ||
| 10:00 | EUR | Eurozone Unemployment Rate Dec | 8.70% | 8.70% | ||
| 10:00 | EUR | Eurozone CPI Core Y/Y Jan A | 1.00% | 0.90% | ||
| 10:00 | EUR | Eurozone CPI Estimate Y/Y Jan | 1.30% | 1.40% | ||
| 13:15 | USD | ADP Employment Change Jan | 183K | 250K | ||
| 13:30 | USD | Employment Cost Index Q4 | 0.60% | 0.70% | ||
| 13:30 | CAD | GDP M/M Nov | 0.40% | 0.00% | ||
| 13:30 | CAD | Industrial Product Price M/M Dec | 0.00% | 1.40% | ||
| 13:30 | CAD | Raw Materials Price Index M/M Dec | -2.50% | 5.50% | ||
| 14:45 | USD | Chicago PMI Jan | 64 | 67.6 | ||
| 15:00 | USD | Pending Home Sales M/M Dec | 0.50% | 0.20% | ||
| 15:30 | USD | Crude Oil Inventories | -1.1M | |||
| 19:00 | USD | FOMC Rate Decision | 1.50% | 1.50% |
GBPUSD – Risk Turns Higher, Eyes 1.4285
GBPUSD - The pair closed higher after taking back all of its intra day losses on Tuesday. This has opened the door for more strength in the days ahead. Support lies at the 1.4100 level where a break will turn attention to the 1.4050 level. Further down, support lies at the 1.4000 level. Below here will set the stage for more weakness towards the 1.3950 level. Conversely, resistance stands at the 1.4200 levels with a turn above here allowing more strength to build up towards the 1.4250 level. Further out, resistance resides at the 1.4300 level followed by the 1.4350 level. On the whole, GBPUSD looks to move further higher with eyes on its key resistance.
Elliott Wave View: Dow Future In Correction
Dow Future Short Term Elliott Wave view suggests that the rally to 26690 ended Intermediate wave (3). Down from there, Intermediate wave (4) pullback is unfolding as a double three Elliott Wave structure where Minor wave W ended at 26121 and Minor wave X ended at 26314. Minor wave Y is in progress and while near term bounces stay below 26314, and more importantly below 26690, expect the Index to extend lower towards 25622 – 25754 area to end Intermediate wave (4) before Index resumes the rally or at least bounce in 3 waves. We don’t like selling the Index and expect buyers to appear from the above area for a 3 waves bounce at minimum.
YM_F Dow Future 1 Hour Elliott Wave Chart
Market Morning Briefing: Dollar Index Has Again Dipped From Levels Seen Yesterday
STOCKS
Important to watch the FOMC meeting today. Stocks seem to have exhausted the Bull Run and may trade sideways or see a short dip in the coming sessions.
Dow (26076.89, -1.37%) has come off a bit from levels near 26700. While below 26700, it could test interim support near 25700 over today and tomorrow.
Dax (13197.71, -0.95%) came off further to test 13200 as expected and could be headed towards 13000 in the coming sessions. Near term looks bearish for Dax while below 13400. A bounce from support near 13000 could be expected in the medium term.
Nikkei (23267.22, -0.11%) has paused near 23200. We need to see if it come down to test 23000 or trades sideways for a few sessions.
Shanghai (3468.82, -0.55%) has been falling sharply from levels just below 3600. This is an important resistance visible on the 3-Day candles and while that holds, downside scope towards 3400 is open.
Nifty (11049.65, -0.73%) is trading at important support levels near 11040 and a break below this levels could indicate that the bull run is possibly over for now and the index may start to come off towards 10980 in the coming sessions. Sensex (36033.73, -0.69%) is likely to test 35750 on the downside in the coming sessions. Near term looks bearish.
COMMODITIES
Brent (68.45) has interim support at 68 and the upside resistance is now shifted to 71-72 levels. While above 68, there is scope of moving up towards 72; else a fall towards 65 could be seen in the coming sessions. WTI (63.91) has fallen sharply compared to the Brent Crude and could test 63.0-62.8 on the downside.
Brent-WTI spread (4.51) has been falling sharply from levels near 7.0 and has found some support near 4.0. There could be a pause in the spread just now but there is room on the downside towards 3.5. Note that a rise in the spread could either indicate a rise in Crude Prices or a stable WTI while Brent continues to fall some more.
Gold (1339.67) is likely to test 1325-1320 in the coming sessions. Near term looks bearish just now.
Copper (3.1865) tested a low of 3.15 support before moving to slightly higher levels. While above 3.12-3.15, there could be scope of a bounce back in the near term. But in case the price breaks below 3.12, medium term could be bearish towards 3.10-3.07.
FOREX
Dollar Index (89.162) has again dipped from levels seen yesterday (it reached a high of 89.64) and is currently trading in the 89.10-89.20 range. Two out of the 3 important events, as mentioned yesterday (Trump's State of the Union address, the Fed's meeting and US employment data on Friday) are underway currently. The markets seem to be treading cautiously prior to the FOMC meeting and it will be interesting to see whether the Fed sticks to a hawkish tone or switches to a dovish tone in light of recent positive economic data from the US. In case of continued hawkishness, we could expect Dollar Index to again test resistance near 89.5 on the daily candles.
Euro (1.2427) has gained some strength after it came to light that the Euro zone economy has had its best year (in terms of growth) in a decade. If the bullish sentiment persists and the FOMC meeting doesn't affect dollar strength positively, we could see Euro move up to test resistance near 1.2475 on the daily candles. In case of Dollar strength a near term drop towards support near 1.2275-1.23 on the weekly candles could take place.
Dollar-Yen (108.89) is back below 109 as the currency markets wait to see the FOMC's stance. The Bank of Japan had raised the inflation outlook for Japan to ‘stable' in their last meeting (in Jan) prompting traders to expect policy tightening by the BoJ this year. This might be keeping Dollar Yen below 109 currently. However, rising US yields can be expected to affect dollar strength against the Yen soon, pushing the rate above 109. The next target on the upside is near 109.5 (seen as resistance on daily candles).
Euro-Yen (135.31) has gone up against our expectations as the Euro has seen strengthening in light of better economic data. With US yields expected to weaken Yen (against the Dollar) in the coming days and the Euro continuing to gain strength, we might just see Euro-Yen staying above 135 for now. There is support near current levels (135.0-135.2) on the daily, 3 day and weekly line charts which could hold for now.
Pound (1.4165), like Euro, has also strengthened against the Dollar . It is currently near resistance (just below 1.42) on the 3 day candles. If the dollar strengthens globally against all currencies in the near term, we should see this resistance hold. (this is also seen as resistance on weekly line charts).
Dollar Rupee (63.6050) could see a test of 63.50 today. We don't know if it will break or hold. Have to see what the market does and go with that.
INTEREST RATES
Bond yields globally are consolidating today after yesterday's rise. However, the phase of volatility might not be over yet.
US 10 Yr (2.7068%), 30 Yr (2.9576%), 5 Yr (2.4903%) & 2 Yr (2.1123%) are all down compared to levels seen yesterday. With the Dow coming off a bit, we might be seeing some of the euphoria start shifting from equity towards bond markets. If that turns out to be correct, we could see some further correction in yields.
Yield spreads continue to remain above respective support levels as yield curve flattening is at a pause. US 10 Yr-5Yr (0.2165%) is above 0.2% for now (seen as support on short term charts) and US 30 Yr – 10 Yr (0.2508%) is above 0.24% (seen as support on long term charts)
GBP/USD Rebounds After Testing Important Support
Key Highlights
- The British Pound started a downside correction after trading as high as 1.4345 against the US Dollar.
- An important bullish trend line with current support at 1.4070 prevented declines on the 4-hours chart of GBP/USD.
- The pair is rebounding and is currently trading with a positive bias above 1.4100.
- UK’s GfK Group Consumer Confidence index in Jan 2018 rose from -13 to -9.
GBP/USD Technical Analysis
There were heavy gains this past week in the British Pound from the 1.3750 support against the US Dollar. The GBP/USD pair traded above 1.4200 and 1.4300 before starting a downside correction.
The pair traded as high as 1.4345 from where it corrected lower. The downside move was substantial as the pair moved down by around 350 pips and tested the 1.4000 support area.
On the positive side, losses were protected by an important bullish trend line with current support at 1.4070 on the 4-hours chart. GBP/USD bounced back sharply and formed a bullish hammer candle pattern, signaling a crucial rejection from the 1.4000 support area.
The pair recovered above the 23.6% Fib retracement level of the last decline from the 1.4345 high to 1.3978 low. The current price action is positive and the pair may continue to move higher towards the 1.4200 resistance area.
An intermediate barrier for buyers is near the 50% Fib retracement level of the last decline from the 1.4345 high to 1.3978 low. Above 1.4200 resistance, the pair will most likely resume its uptrend towards the 1.4300 level.
On the downside, the 1.4060-1.4070 support zone is crucial in the near term. The pair has to stay above the trend line and 1.4000 to avoid further declines.
Looking at the other major pairs, EUR/USD was stable above the 1.2350 support. On the other hand, the USD/JPY pair continues to face a lot of bearish pressure and it is currently trading below the 109.40 resistance. Finally, AUD/USD dipped recently to test yesterday’s highlighted channel support and bounced back above 0.8060.