Sample Category Title
XAUUSD Analysis: Confidently Moving South
The yellow metal has maintained its gradual movement southwards as of mid-Friday. It fell 0.63% against the US Dollar yesterday and continued the same tendency early in this session. Following a breakout of the 100-hour SMA and the weekly PP circa 1,348.00, Gold also breached the 200-hour moving average and the bottom boundaries of three ascending channels. This suggest that the pair is likely to continue depreciating later this week. For now, however, a brief correction north should occur, as technical indicators have been located in the relatively bearish territory since late Friday. The nearest resistance is the 200-hour SMA, while a more realistic upside target for today is the 1,350.00 where the 55– and 100-hour SMAs are located

NZD/USD: NZ Trade Balance
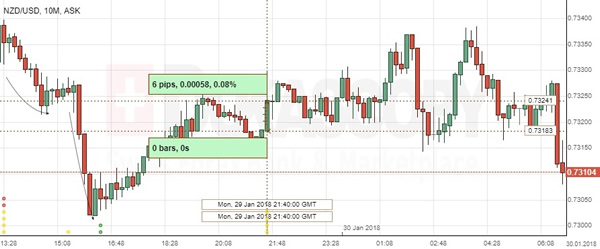
The Kiwi revealed the relatively muted reaction on an unexpected increase in the New Zealand trade balance data. The NZD/USD exchange rate grew 6 base points or 0.08% to the 0.7324 mark.
New Zealand imports and exports reached new highs as the country bought more computers and cars, while earning more from agriculture. Goods exports rose 26% to $5.6B, the new monthly high, while imports increased 11% to $4.9B, putting the country’s trade balance in a $640M surplus. China continued to be the main trading partner of New Zealand for the fourth year in succession. Meanwhile, being the biggest dairy products exporter, New Zealand benefitted from higher dairy prices globally over the last year.
EUR/USD: US Core PCE Price Index
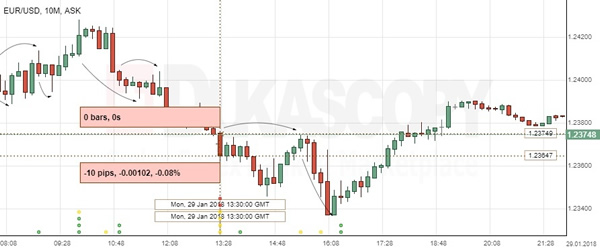
The Dollar was little stronger against the US Dollar, following the US economic data. The EUR/USD currency pair declined 10 pips or 0.08% to decrease further, but managed to return to the 1.2380 area.
The US consumer spending strengthened in December amid higher demand for services and goods, though an increase came at the cost of savings, which fell to the lowest level in 10 years in a worrying sign for future economic growth and consumption. The report indicated that the PCE Price Index, the Federal Reserve’s preferred measure of inflation, increased 0.2% in December after a 0.1% gain. Meanwhile, consumer spending added 0.4% in the reported month from an upwardly revised 0.8% in November.
Technical Outlook: AUDUSD Extended Pullback Stays So Far Above Pivotal Supports At 0.8033/00
The Aussie dipped to 0.8042 on Tuesday, in extension of pullback from 0.8135 peak but stayed above rising 10SMA (0.8033) which marks the first pivot.
Subsequent bounce returned into thick hourly cloud (spanned between 0.8070 and 0.8098), easing immediate downside pressure.
However, hourly studies remain week and would keep the downside at risk while the price holds within hourly cloud.
Bullish scenario requires sustained break above the cloud to neutralize downside threats and open way for retest of 0.8135 peak.
Otherwise, risk of renewed attack at 10SMA is expected to remain in play with break lower to expose next pivots at 0.8010/00 zone (Fibo 38.2% of 0.7807/0.8135 upleg / psychological support).
Break here is needed to generate stronger bearish signal for deeper correction.
Res: 0.8100, 0.8118, 0.8135, 0.8164
Sup: 0.8042, 0.8033, 0.8000, 0.7971
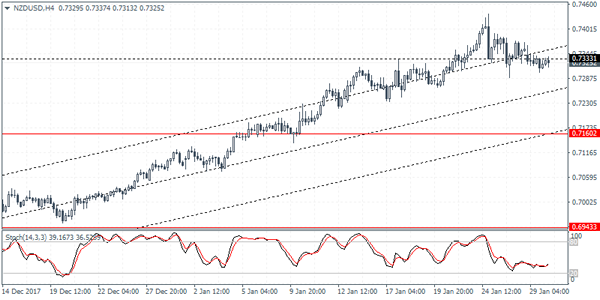
NZDUSD Intraday Analysis
NZDUSD (0.7352): The NZDUSD has been trading sideways with price strongly consolidating around the 0.7333 level. Further evidence is required of a break down below this level that could validate a correction towards 0.7160. To the upside, the potential for a bullish pennant pattern could indicate further gains. However, the fact that NZDUSD has been trading flat near the current highs suggests exhaustion to the rally.
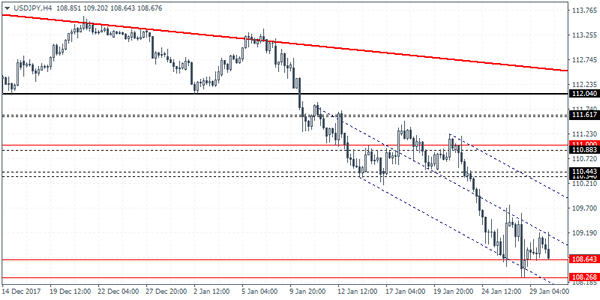
USDJPY Intraday Analysis
USDJPY (108.67): The USDJPY managed to turn bullish on the day but price edged back lower in the early Asian trading session. USDJPY remains supported above the main daily support level at 108.26. On the 4-hour chart, the current retracement back to the support zone at 108.64 - 108.26 indicates a potential higher low being formed. As long as USDJPY posts a reversal at this level, we expect to see further upside gains coming. The resistance level at 110.34 forms the near term target.
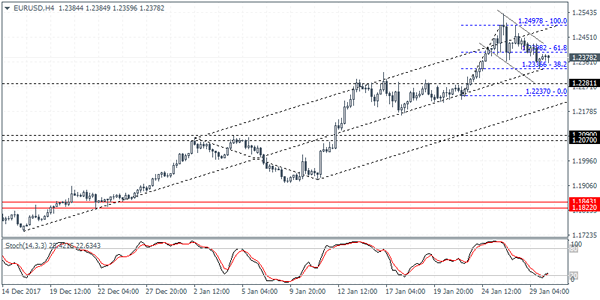
EURUSD Intraday Analysis
EURUSD (1.2379): The EURUSD was seen trading weaker on Monday but price action continues to remain near the highs. On the 4-hour chart, price action is seen consolidating within the bullish flag pattern. A break out above 1.2400 is required for the common currency to target the previous highs at 1.2497. This could extend the gains further towards 1.2659. To the downside, a break down below 1.2336 could signal a correction and invalidate the bullish flag pattern. The 4-hour Stochastics is currently oversold and rising and could indicate a near term move to the upside.
PCE And Personal Spending/Income Data Lift The USD
The U.S. dollar nudged higher on Monday as the core PCE data released yesterday showed a 0.2% increase on the month matching estimates and rising from 0.1% previously. On a year over year basis, the core PCE price index rose 1.5%, unchanged from the previous month. Personal income and spending data was also positive rising 0.4%.
Ahead of the Fed's meeting on Wednesday, the U.S. dollar could be seen rising with the Fed expected to stay hawkish on rates. Elsewhere, the retail sales data from Japan showed a 3.6% increase beating expectations of 2.1%.
Looking ahead the preliminary GDP data from the Eurozone for the fourth quarter of 2017 will be released today. Expectations show a 0.6% increase in GDP on the quarter. Later in the day, BoE Governor Carney will be speaking in the UK parliament.
Forex Technical Analysis: EUR/USD, USD/JPY, GBP/USD
EUR/USD
Current level - 1.2340
The pair is currently testing 1.2330 support again and a break through the key resistance at 1.2390 will mark a reversal and will reinstate the positive bias for 1.2540 peak.
| Resistance | Support | ||
| intraday | intraweek | intraday | intraweek |
| 1.2390 | 1.2500 | 1.2330 | 1.2330 |
| 1.2490 | 1.2870 | 1.2270 | 1.2220 |

USD/JPY
Current level - 108.68
After yesterday's failure at 109.20 my outlook here is bearish, for a dive towards 107.30 lows.
| Resistance | Support | ||
| intraday | intraweek | intraday | intraweek |
| 109.15 | 110.20 | 108.25 | 108.50 |
| 110.20 | 112.00 | 108.25 | 107.30 |
GBP/USD
Current level - 1.4093
Still there is no sign of a reversal yet and only a rebound above 1.4090 resistance will signal, that a bottom is in place. Initial support is projected at 1.3910.
| Resistance | Support | ||
| intraday | intraweek | intraday | intraweek |
| 1.4090 | 1.4340 | 1.3910 | 1.3910 |
| 1.4340 | 1.4730 | 1.3835 | 1.3730 |

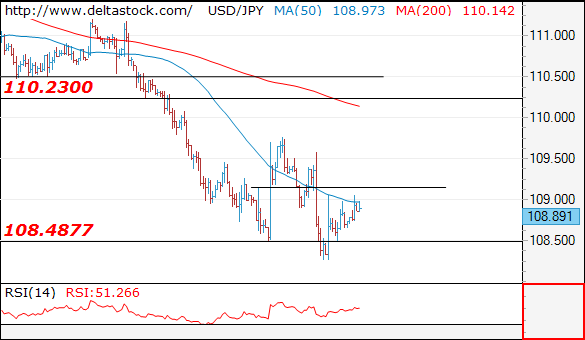
Technical Outlook: USDJPY – Bearish Outlook Below Weekly Cloud Base
The pair moved lower in early European trading after recovery attempts overnight were repeatedly capped at 109.20 (Monday’s high).
Repeated close below weekly cloud base (109.10) maintains negative tone and adds to negative near-term outlook.
Overall bears are looking for fresh extension lower after completion of current brief consolidation, for test of trendline support at 107.83 (bull-trendline drawn off 77.12, 2012 low) and eventual push toward key support at 107.31 (08 Sep low).
Daily studies are in firm bearish setup and favor further weakness as sentiment for the US dollar remains negative.
Speech of President Trump and US policy decision are focused for fresh signals, but bears are expected to remain firmly in play while pivotal barrier at 110 zone (falling 10SMA / psychological resistance) stays intact.
Res: 109.10, 109.76, 110.00, 110.33
Sup: 108.50, 108.28, 107.83, 107.31