Sample Category Title
GOLD – Threatens Further Downside Pressure
GOLD - The commodity faces further downside pressure on correction. On the downside, support comes in at the 1,340.00 level where a break will turn attention to the 1,330.00 level. Further down, a cut through here will open the door for a move lower towards the 1,320.00 level. Below here if seen could trigger further downside pressure towards the 1,310.00 level. Conversely, resistance resides at the 1,360.00 level where a break will aim at the 1,370.00 level. A turn above there will expose the 1,380.00 level. Further out, resistance stands at the 1,390.00 level All in all, GOLD looks to weaken further.
The Song Remains The Same
We ended last week singing a very familiar tune with US equities putting in another strong performance, helped by more positive corporate earnings reports, while the USD weakened further, as the market was still digesting the aftershocks from the verbal ping-pong match when both Mnuchin and Trump dabbled into the FX debate. We should expect more two-way uncertainty entering the fray this week which could make for some touch and go moments, but for now, the markets remain comfortable to maintain a longer-term soft USD bias
However, it is a massive week for the USD, featuring President Trump's State of the Union Address, an FOMC meeting, and the US employment report for January. We should expect some consolidation and possible short USD position squaring ahead of these potential USD hotspots given that all the basis to sell the US dollar would come under some level of scrutiny this week. Ultimately, unless Dr Yellen final hurrah surprisingly offers up a serving of hawkish pie, the markets long-term negative US dollar sentiment is unlikely dented
Asia Equities
Asian equities are poised to open on a positive note with the market still very focused on China H shares. Investors continue to flock to H shares as lower valuation, and robust economic fundamentals in China remain to attract large volumes of capital inflow.
Oil Markets
Oil prices have received a significant tailwind for the weaker US dollar, which usually causes investors to flash mob commodities in general. While the longer-term USD negative bias remains intact, two-way dollar risk is in play this week. And with everyone looking for a reason to sell Oil at these levels; it could be a struggle to push higher early in the week.
Traders continue to look over their shoulder at the likelihood of US oil production ramps and supporting that argument; Baker Hughes reported the number of active US rigs rose by 12 to 759
Gold Markets
Given we've had a compelling move since early December and while surveying the state of US economic data on tap this week, we could enter a period of short-term consolidation given short USD position risk at minimum take profit ahead of this week's crucial headline risk
By no means are dollar bears folding up camp, but a healthy consolidation in Gold markets at these extended levels would further support the bullish narrative.
Australian Dollar
Iron Ore inspired losses have been playing a secondary role to the freefalling greenback, which has supported the commodity block of currencies on masse. But as expected there's more two-way risk entering the dollar picture this week due to significant headline risk
External driver aside the next catalyst may come from a build-up of RBA ” rate hike fever' that seems to be making the rounds these days. The market base case is for the RBA to remain neutral. But with only twenty-five bp's of rate hikes priced in STIRT for 2018 and a measly five bp's baked into May, I think the next significant piece of the puzzle will reveal after this weeks' CPI ( Jan 31) which could see a rapid repricing on RBA risks.
Traders are starting to take notice of the recent string of economic data, which has been particularly boisterous led by strong employment print supported by an uptick in consumer sentiment.
However, there's no escaping the RBA long-standing tradition of when Aussie dollar is soaring; there's a higher likelihood, the RBA will remain faithful to current expectations as opposed to moving in front of them.
Japanese Yen
USD/JPY's continues to trade with no correlation with UST yields suggesting a limited upside. However robust US data and surging risk sentiments are by no means contradictory for bearish JPY sentiment. However, conditions will remain unsettled for USD bulls until signals that are more definitive. In the meantime, the market will continue to sell and USD upticks.
Malaysian Ringgit
Ringgit markets will move on broader US dollar sentiment this week, but investors will remain solid MYR buyers on weakness.
The well-entrenched supporting cast of narratives remains intact.
Strong Oil prices resonate, positive regional risk sentiment and BNM that has left the door slightly ajar to further rate hike in 2018 adds the Ringgit's soaring appeal.
While the markets will become increasingly more data dependent, however, given the positive macro background and robust regional economic landscape the Ringgit prospects remain rosy.
With a bit of help for the greenback this week, we could zero in on 3.85 USDMYR
EUR/USD Weekly Outlook
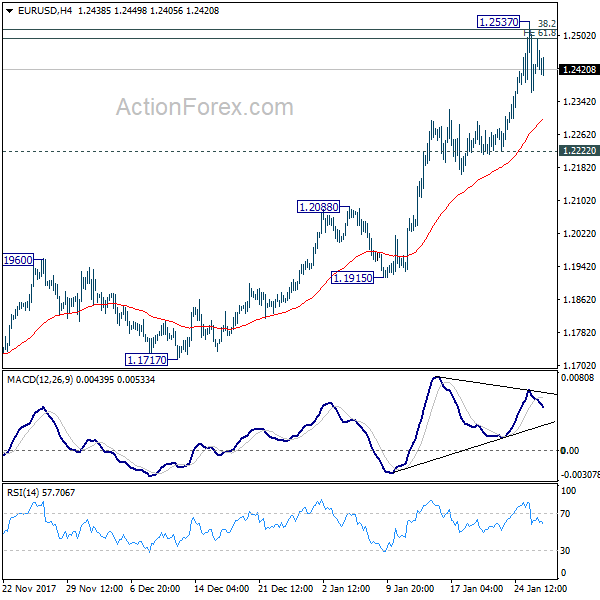
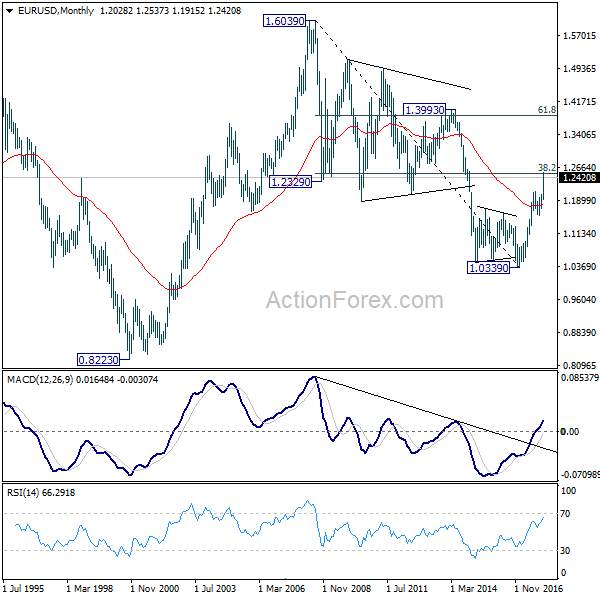
EUR/USD surged to as high as 1.2537 last week and breached key fibonacci level at 1.2494/2516. But a temporary top was then formed and it retreated. Initial bias is neutral this week first. Further rise is in favor as long as 1.2222 support holds. Sustained break of 1.2494/2516 will target 100% projection of 1.0569 to 1.2091 from 1.1553 at 1.3075 next. However, break of 1.2222 will indicate rejection from 1.2494/2516, on bearish divergence condition in 4 hour MACD, and turn near term outlook bearish.
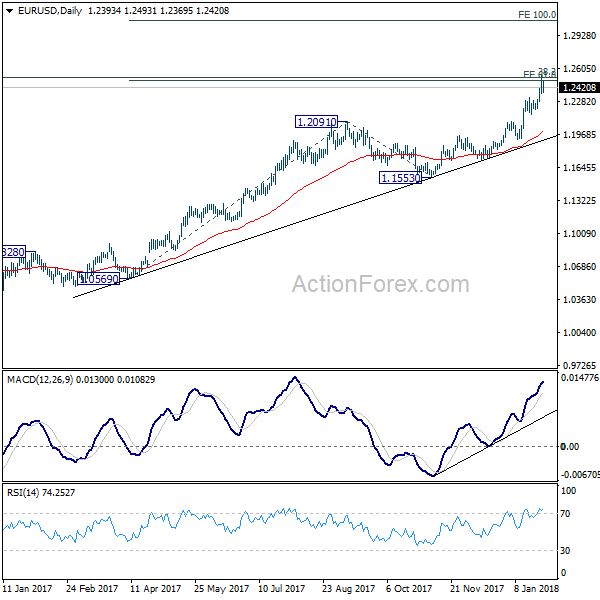
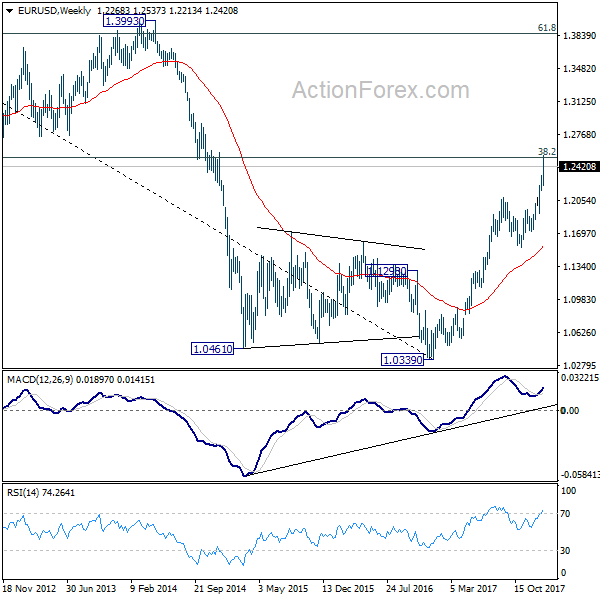
In the bigger picture, rise from 1.0339 medium term bottom is still seen as a corrective move for the moment. But key fibonacci level at 38.2% retracement of 1.6039 (2008 high) to 1.0339 (2017 low) at 1.2516 is looking vulnerable. Sustained break of 1.2516 will carry larger bullish implication and target 61.8% retracement of 1.6039 to 1.0339 at 1.3862. Nonetheless, rejection from 1.2516 will maintain long term bearish outlook and keep the case for retesting 1.0039 alive.
In the long term picture, 1.0339 is seen as an important bottom as the down trend from 1.6039 (2008 high) could have completed. It's still early to decide whether price action from 1.0339 is developing into a corrective or impulsive pattern. reaction to 38.2% retracement of 1.6039 to 1.0339 at 1.2516 will give important clue to the underlying momentum.
USD/JPY Weekly Outlook
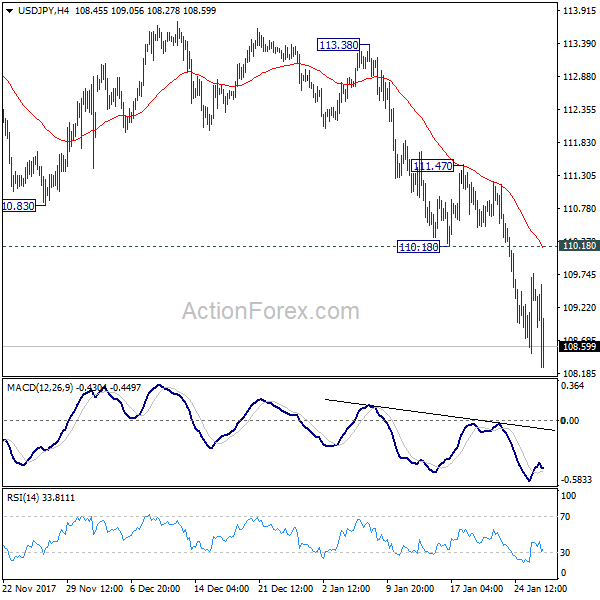
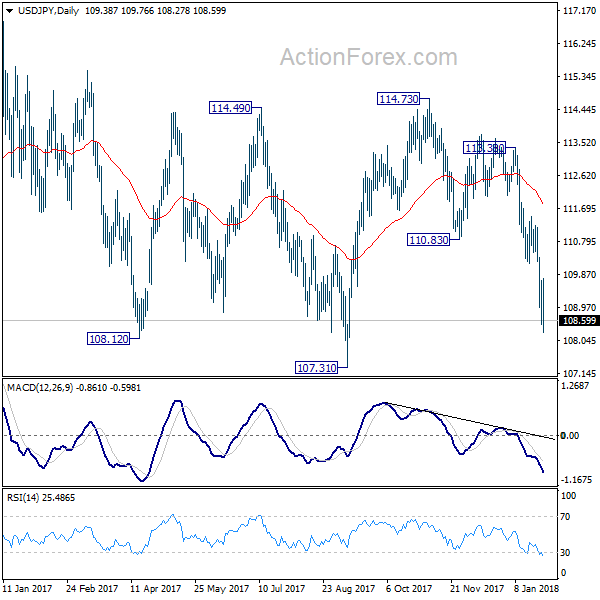
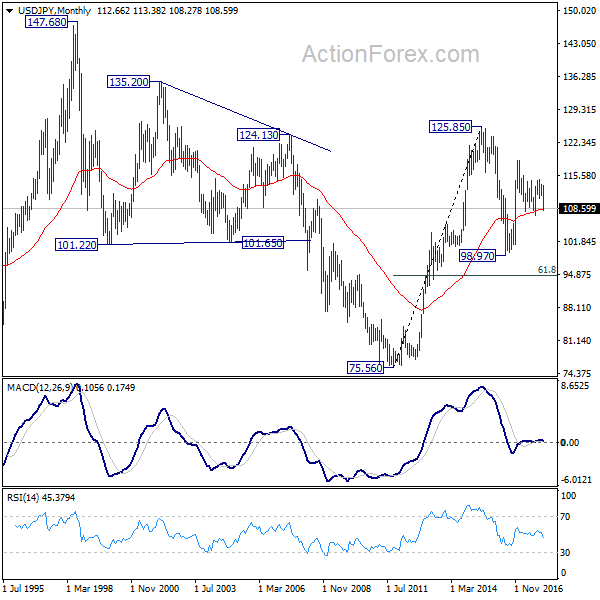
USD/JPY's decline accelerated to as low as 108.27 last week. Initial bias remains on the downside this week for deeper decline. As current fall is part of the pattern fro 118.65. USD/JPY should target next fibonacci support at 106.48. Nonetheless, break of 110.18 will be the first sign of near term reversal and will turn bias back to the upside for 111.47 resistance.
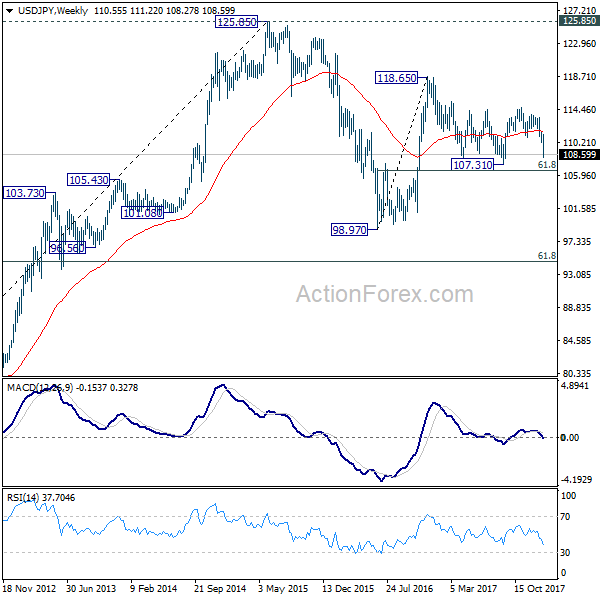
In the bigger picture, current development argues that the corrective pattern from 118.65 is extending. There is risk of dropping further to 61.8% retracement of 98.97 to 118.65 at 106.48. But this level should provide strong support to contain downside and bring resumption of rise from 98.97. However, sustained break of 106.48 will now likely send USD/JPY through 98.97 to resume the corrective fall from 125.85 (2015 high).
In the long term picture, the rise from 75.56 (2011 low) long term bottom to 125.85 top is viewed as an impulsive move, no change in this view. Price actions from 125.85 are seen as a corrective move which could still extend. In case of deeper fall, downside should be contained by 61.8% retracement of 75.56 to 125.85 at 94.77. Up trend from 75.56 is expected to resume at a later stage for above 135.20/147.68 resistance zone.
GBP/USD Weekly Outlook
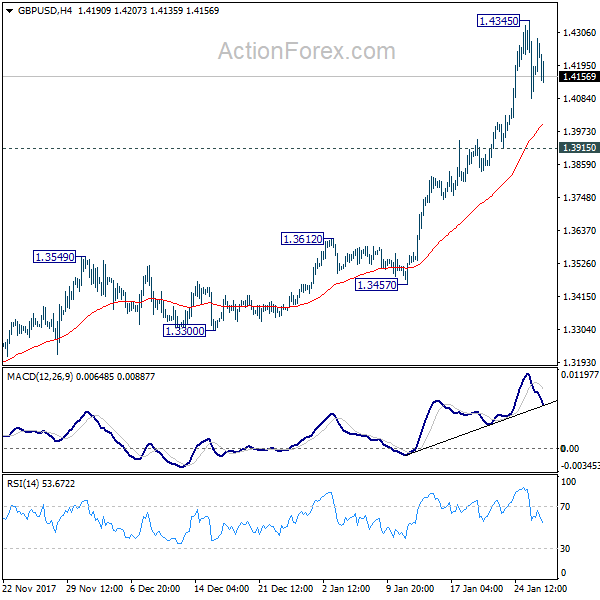
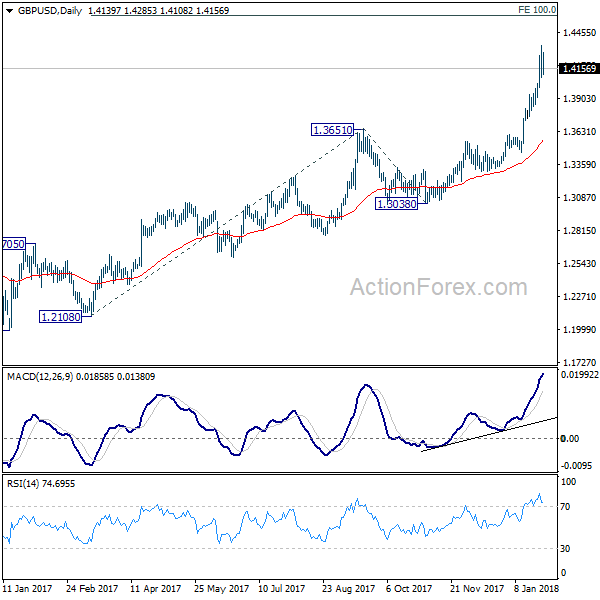
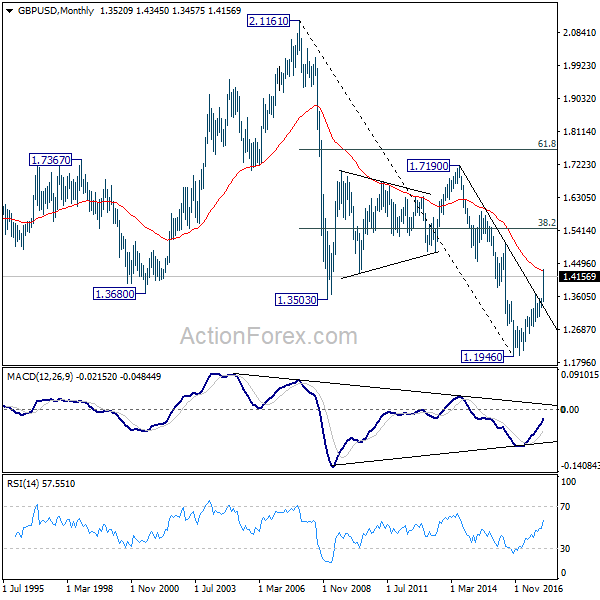
GBP/USD's up trend continued last week as reached as high as 1.4345. A temporary top is in place and intraday bias is neutral this week. Some consolidations could be seen but retreat should be contained by 1.3915 support to bring another rise. Above 1.4345 will turn bias back to the upside for 100% projection of 1.2108 to 1.3651 from 1.3038 at 1.4581 next.
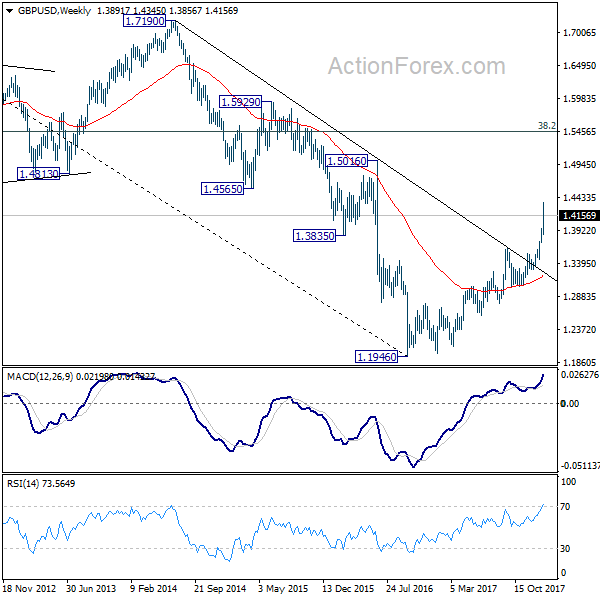
In the bigger picture, sustained break of 1.3835 key resistance level indicates that rebound from 1.1946 is at least correcting the long term down from from 2007 high at 2.1161. Further rise should now be seen back to 38.2% retracement of 2.1161 (2007 high) to 1.1946 (2016 low) at 1.5466. Medium term outlook will stay bullish as long as 1.3038 support holds, in case of pull back.
In the longer term picture, rise from 1.1946 should at least be correction whole long term down trend form 2.1161 and should target 38.2% retracement of 2.1161 (2007 high) to 1.1946 (2016 low) at 1.5466. It too early to tell if it's developing into a long term up trend. We'll monitor the upside momentum and reaction to 1.5466 to decide later.
USD/CHF Weekly Outlook
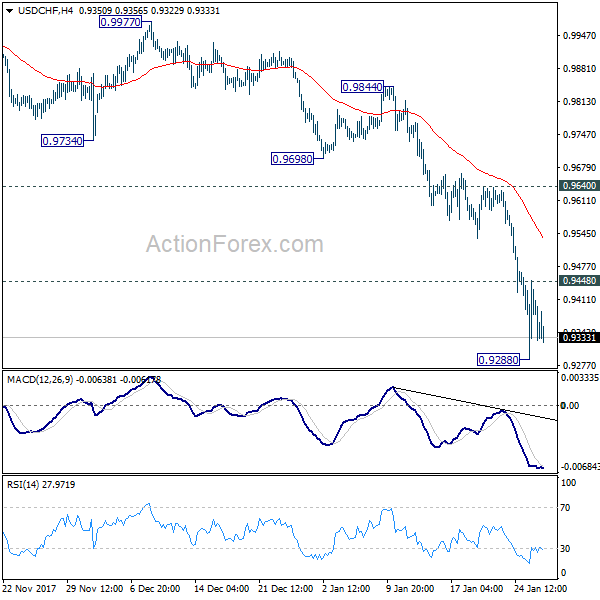
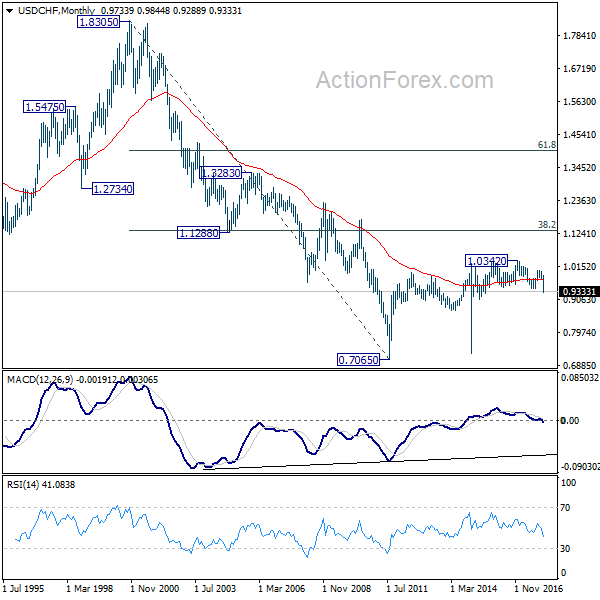
USD/CHF powered through 0.9420 key support level last week and reached as low as 0.9288. Initial bias stays on the downside this week as long as 0.9448 minor resistance holds. Current decline would target next key fibonacci level at 0.9115. But outlook will remains bearish as long as 0.9640 resistance holds.
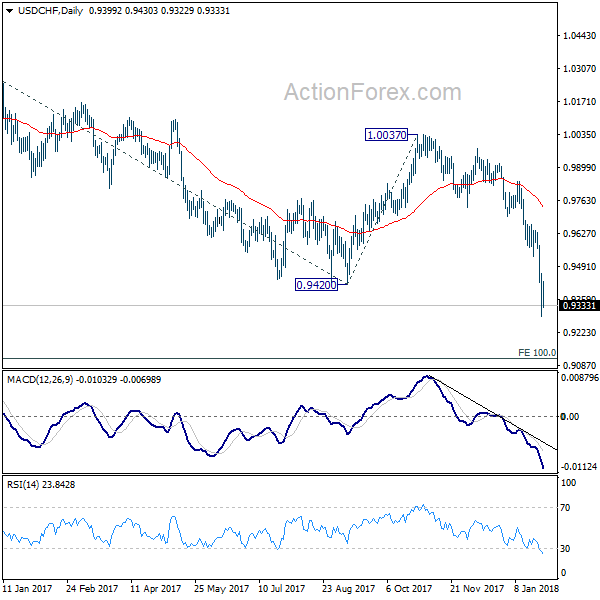
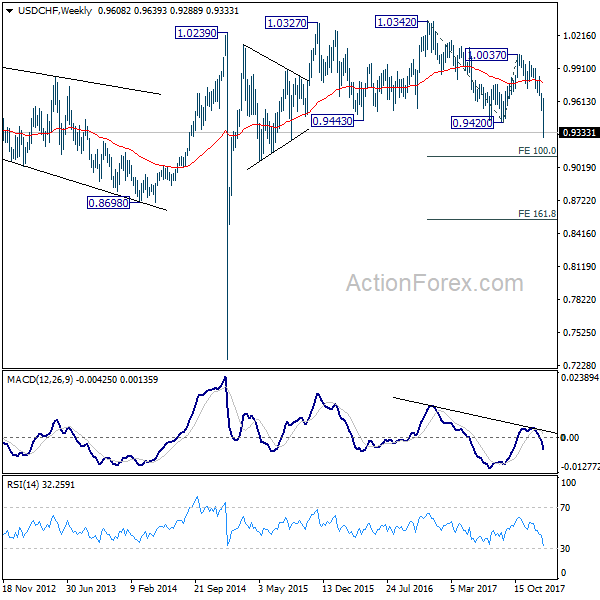
In the bigger picture, the strong break of 0.9420 support suggests that fall from 1.0342 is developing into a medium term down trend. Deeper fall should be seen to 100% projection of 1.0342 to 0.9420 from 1.0037 at 0.9115. Break will target 161.8% projection at 08545. In any case, break of 0.9640 resistance is needed to be the first sign of medium term bottoming. Otherwise, outlook will stay bearish even in case of strong rebound.
In the long term picture, the strong break of 0.9420 support and downside acceleration turns the long term outlook rather bearish. Corrective rebound from 0.7065 (2011 low) could have already completed at 1.0342. 0.8698 support will be a key level to watch. Sustained break there could bring retest of 0.7065.
AUD/USD Weekly Outlook
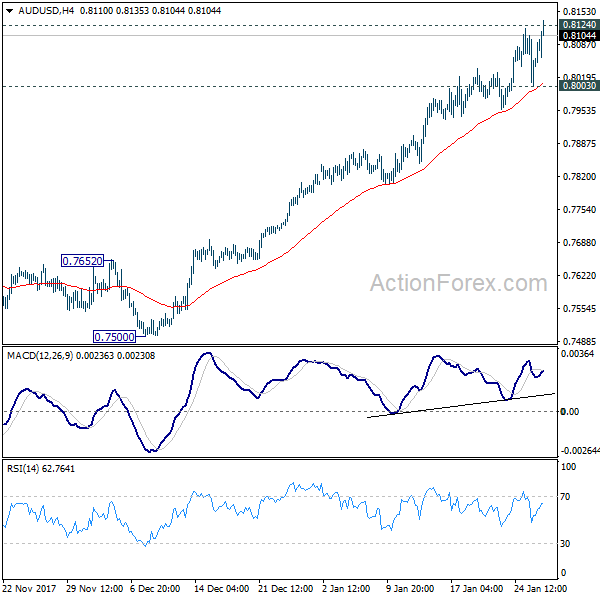
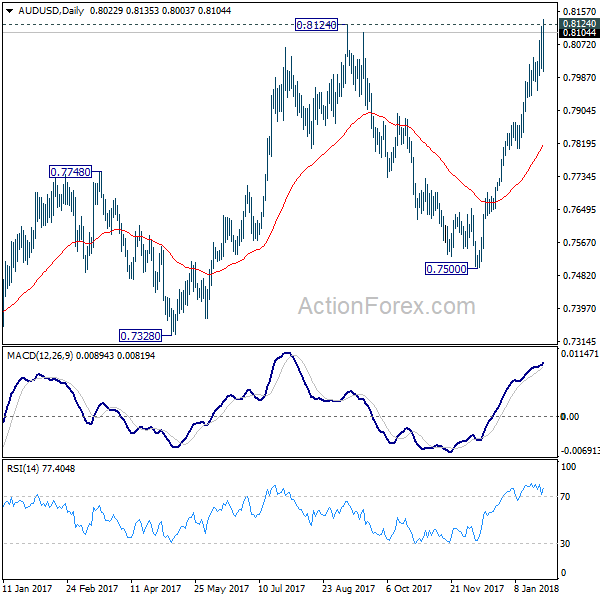
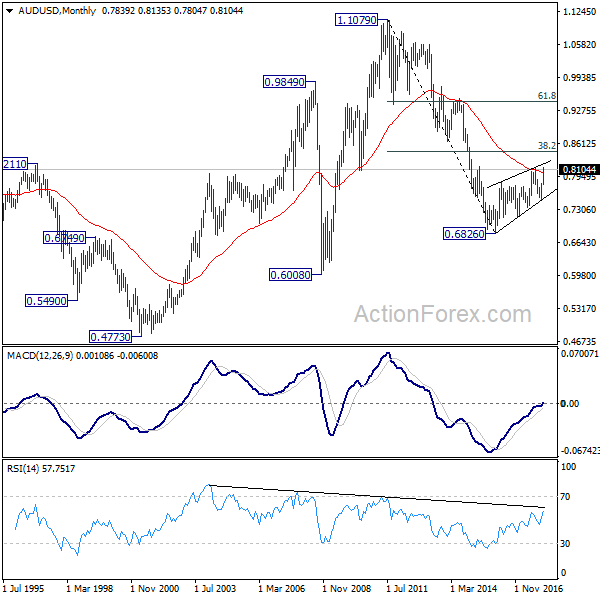
AUD/USD rose to as high as 0.8135 last week and breached 0.8124 resistance. Initial bias remains on the upside this week. Sustained break of 0.8124 will resume whole medium term rebound from 0.6826 and target key fibonacci level at 0.8451. Meanwhile, on the downside, break of 0.8003 support will indicate short term topping, likely with bearish divergence condition in 4 hour MACD. And in such case, intraday bias will be turned back to the downside for 55 day EMA (now at 0.7817).
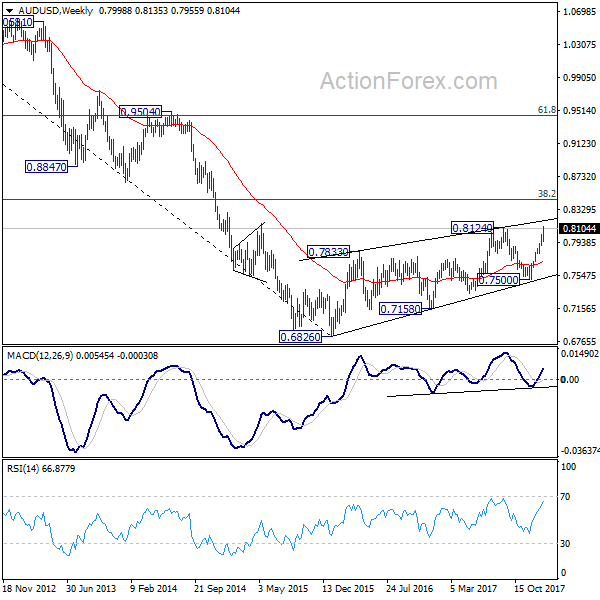
In the bigger picture, current development suggests that medium term rebound from 0.6826 is still in progress and could be resuming. Such rise could target 38.2% retracement of 1.1079 (2011 high) to 0.6826 (2016 low) at 0.8451. As such rise is seen as a corrective move, we'd expect strong resistance from 0.8451 to limit upside and bring reversal.
In the longer term picture, 0.6826 is seen as a long term bottom. Rise from there could either reverse the down trend from 1.1079, or just develop into a corrective pattern. At this point, we're favoring the latter. And, as long as 38.2% retracement of 1.1079 to 0.6826 at 0.8451 holds, we'd anticipate another decline through 0.6826 at a later stage. But strong support should be seen between 0.4773 (2001 low) and 0.6008 (2008 low).
USD/CAD Weekly Outlook
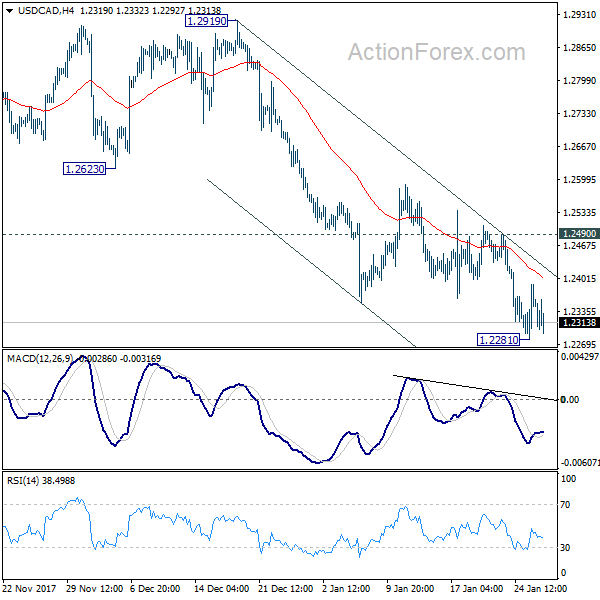
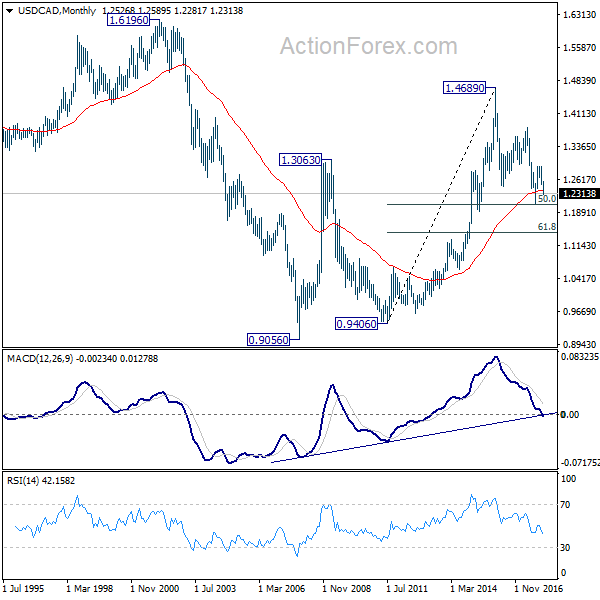
USD/CAD's decline from 1.2919 resumed last week and reached as low as 1.2281. As a temporary low is in place, initial bias is neutral this week for consolidations. But outlook will stay bearish as long as 1.2490 resistance holds. Break of 1.2281 will target a test on 1.2061 low. However, break of 1.2490 will indicate short term bottoming and bring stronger rebound.
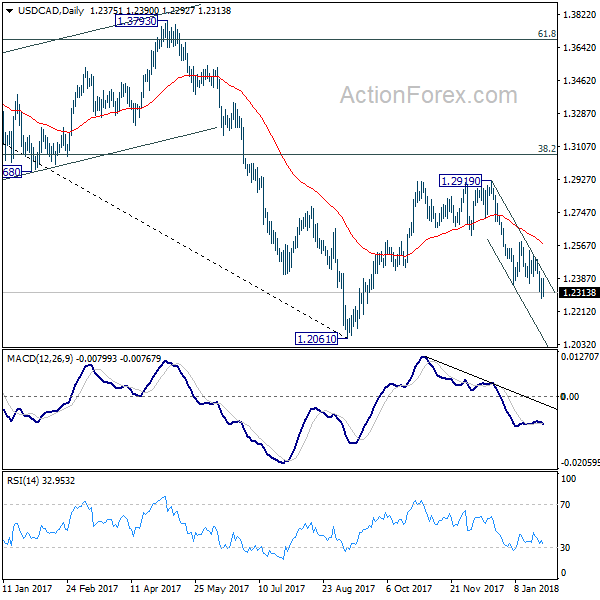
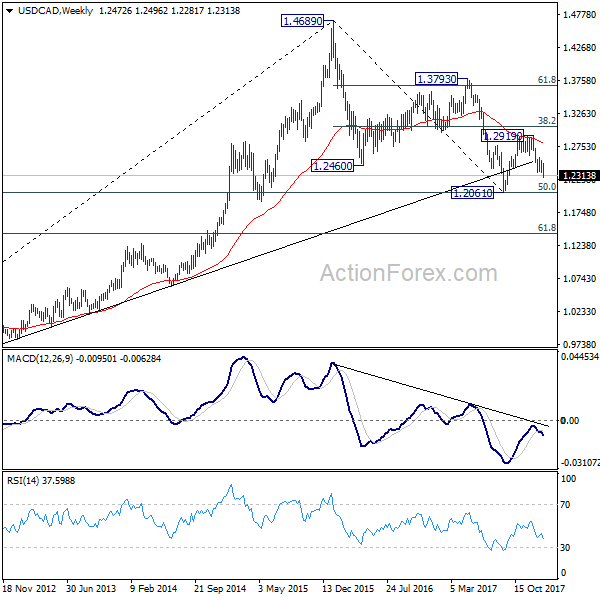
In the bigger picture, rebound from 1.2061 is likely completed completed at 1.2919, rejected by 55 week EMA and kept below 38.2% retracement of 1.4689 to 1.2061 at 1.3065. The development also suggests that long term fall from 1.4689 is not completed yet. Decisive break of 1.2061 low will target 61.8% retracement of 0.9406 to 1.4689 at 1.1424. This will now be the favored case as long as 1.2919 resistance holds.
In the longer term picture, 50% retracement of 0.9406 (2011 low) to 1.4689 (2015 high) at 1.2048 remains a key support level to watch. As long as this level holds, we'll treat fall from 1.4689 as a correction and expect another rally through this level. However, sustained break of 1.2048 will turn favors to the case that rise from 0.9056 (2007 low) is a three wave corrective move that's completed at 1.4689. And retest of 0.9056/9406 support zone could be seen in medium to long term.
GBP/JPY Weekly Outlook
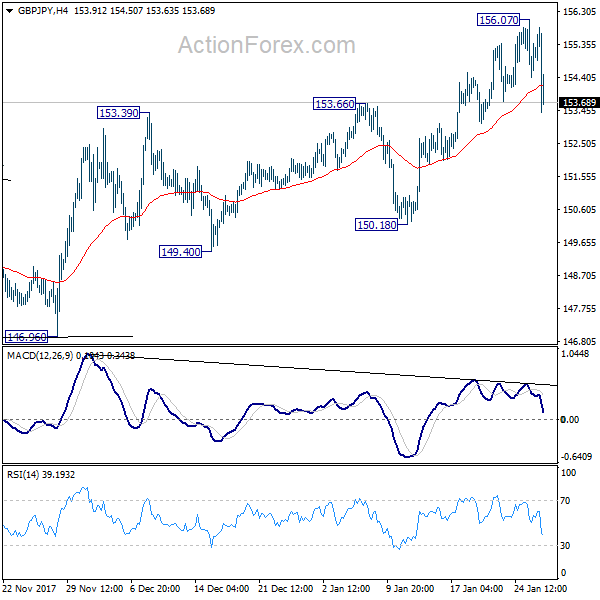
GBP/JPY rose to 156.07 last week but retreated sharply since then. A short term top is likely in place with bearish divergence condition in 4 hour MACD. Initial bias is mildly on the downside for 150.18 support next. Break there will target a test on 146.96 key support level. Nonetheless, break of 156.07 will resume medium term rally.
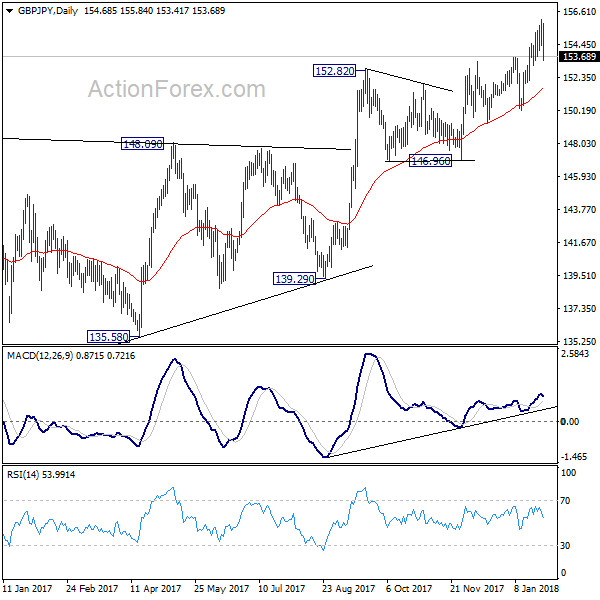
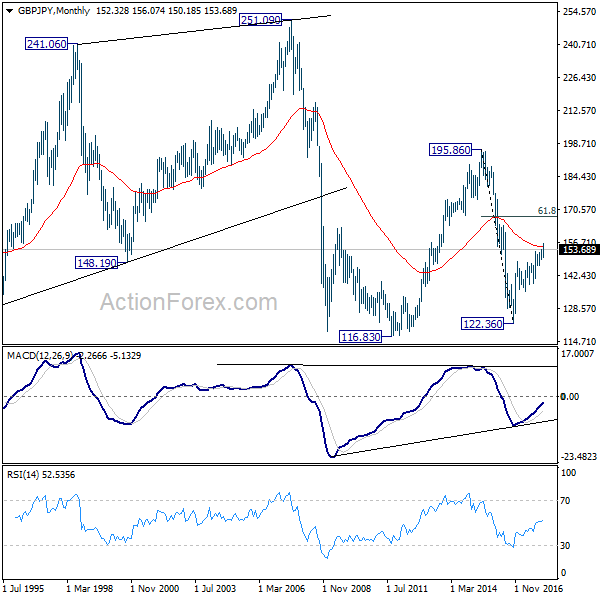
In the bigger picture, as long as 146.96 key support holds, medium term outlook remains bullish. Rise from 122.36 is in favor to extend to 61.8% retracement of 195.86 to 122.36 at 167.78. However, break of 146.96 support will indicate trend reversal. And there would be prospect of retesting 122.36 in that case.
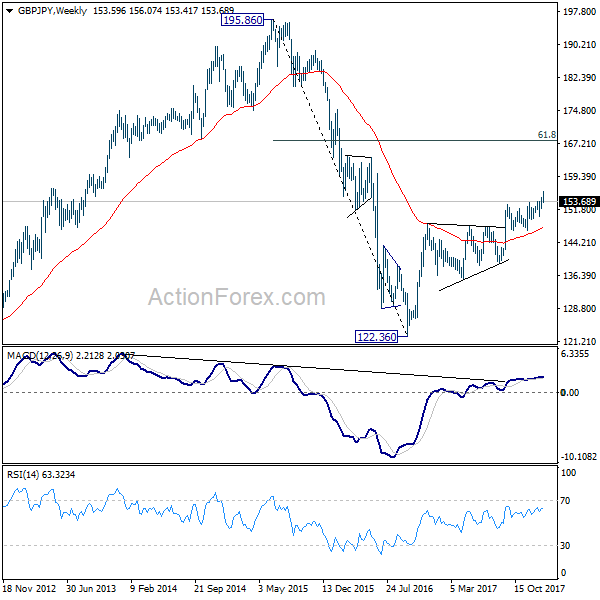
In the longer term picture, down trend from 195.86 (2015 high) has already completed at 122.36. Focus is now on 55 month EMA (now at 154.75). Firm break there will suggest that rise from 122.36 is developing into a long term move that target 195.86 again. And, price actions from 116.83 (2011 low) is indeed a sideway pattern that could last more than a decade.
EUR/JPY Weekly Outlook
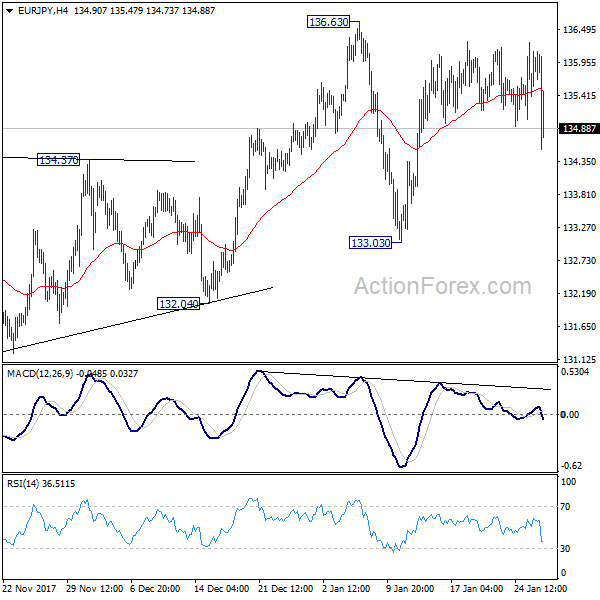
EUR/JPY stayed in range of 133.03/136.63 last week and outlook is unchanged. Initial bias remains neutral this week first. Outlook will remains bullish as long as 133.03 support holds. Break of 136.63 will medium term up trend. However, on the downside, break of 133.03 will have 55 day EMA and medium term channel support firmly taken out. Also, considering bearish divergence condition in daily MACD too, that will suggest medium term reversal. Deeper fall should then be seen to 132.04 support for confirmation.
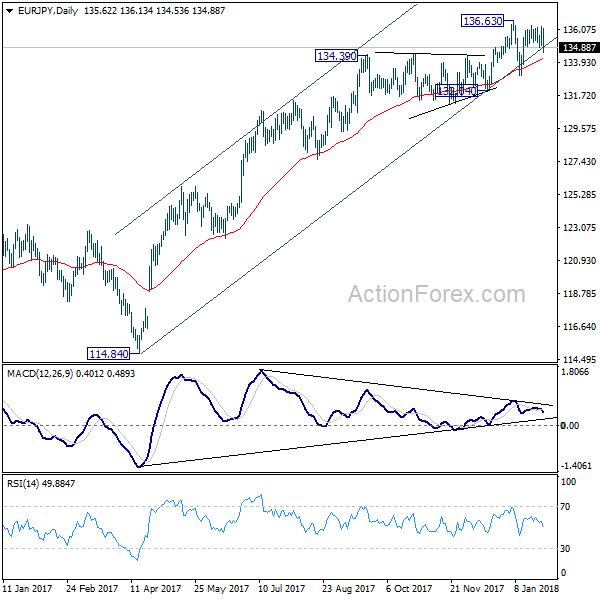
In the bigger picture, medium term rise from 109.03 (2016 low) is seen as at the same degree as the down trend from 149.76 (2014 high) to 109.03 (2016 low). It should be targeting 141.04/149.76 resistance zone. On the downside, break of 132.04 support is needed to indicate medium term reversal. Otherwise, outlook will stay bullish in case of deep pull back.
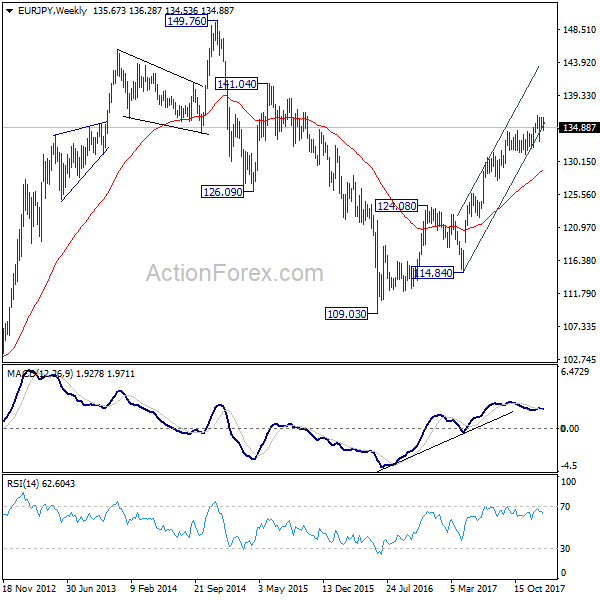
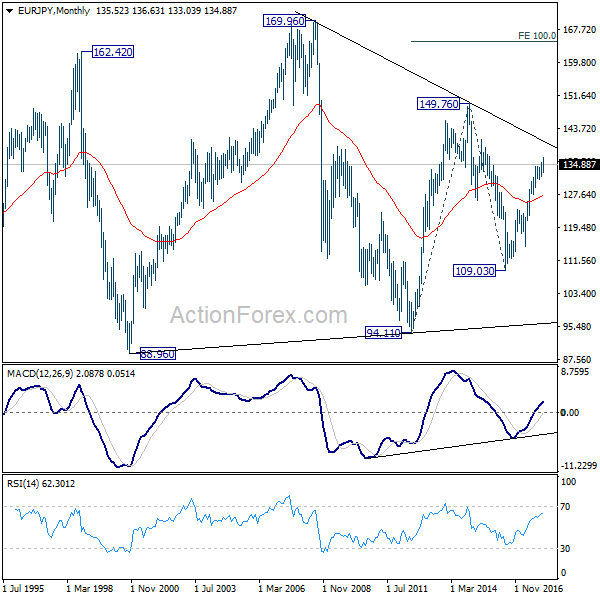
In the long term picture, at this point, there is no clear indication that rise from 109.03 is resuming that from 94.11 (2012 low). Hence, we'd be cautious on topping below 149.76 to extend range trading. Nonetheless, firm break of 149.76 will indicates strong underlying buying. In such case, EUR/JPY will target 100% projection of 94.11 to 149.76 from 109.03 at 164.68.