
Sample Category Title
US Yields are Rising, Why is the Dollar Plunging?
A nation's bond yields and its currency typically move in the same direction. A rise in US Treasury yields, for instance, has traditionally been followed by dollar strength, as higher interest rates make the currency more attractive for international investors. Vice versa, a plunge in bond yields usually spells bad news for a currency, as it becomes less appealing compared to other higher-yielding currencies.
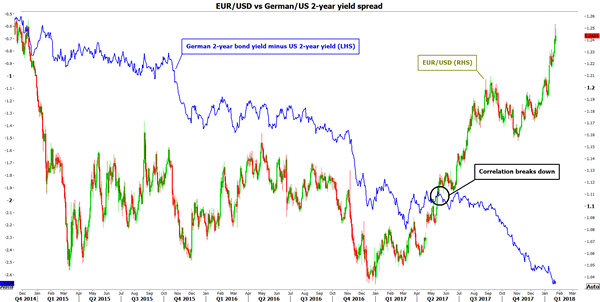
Logically, it follows that when you compare the difference (i.e. the spread) between the yields of two nations and the relevant currency pair, the two charts should look very similar; changes in relative interest rates are one of the biggest factors driving the FX market. Yet, this historical relationship has broken down recently, with the USD seemingly unable to draw support from the upturn in US yields. While 10-year Treasury yields are near their highest point in more than three years, the dollar index has collapsed, trading at three-year lows.
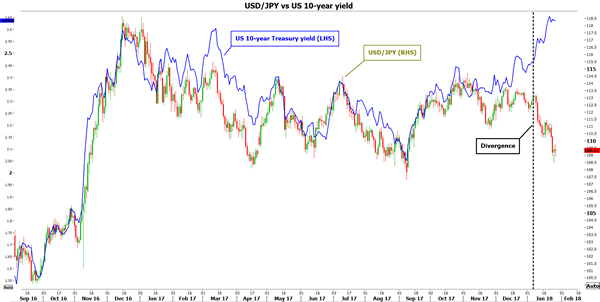
What could be driving this divergence, and what does this imply for the future? More than anything else, it could be a sign that investors' confidence in US Treasuries is fading, possibly due to concerns about rising deficits and long-term debt sustainability. Note that back in March, the US Congressional Budget Office projected that if current laws remain unchanged, the US debt-to-GDP ratio would skyrocket to 150% by 2047, from 77% at that time. Legislations have changed since then, but for the worse from a debt perspective, as the recent Republican tax package is anticipated to add notably to US deficits and national debt, making the situation even more unsustainable.
Thus, concerned investors may be selling off their US bonds, which causes yields to rise, but for the "wrong reasons". Instead of yields rising because of expectations that the Fed will raise interest rates faster due to the economy performing well, yields are moving higher due to reduced demand for bonds. Adding credibility to this argument is the fact that the biggest foreign buyers of US debt, China and Japan, may be cutting back on their purchases, according to the Treasury's latest capital flows data. This narrative can also be linked to the recent melt-up in equity markets. It could explain why US equity indices are breaking all-time highs despite stocks being "expensive" by almost all metrics; investors are selling bonds for stocks.
So, US yields are not necessarily rising for "healthy reasons". Meanwhile, the pessimism in the dollar could reflect other factors, such as the recent step-up in protectionist measures by the US administration. Besides NAFTA renegotiations casting a shadow on the US trade outlook, the recent rise in trade tensions between the US and China has significantly increased the risk of a retaliatory trade war. Last but not least, the recent move towards policy normalization by major central banks other than the Fed, such as the ECB, is another factor making the dollar less appealing compared to its counterparts.
Can this dollar-yield divergence continue? History suggests that the correlation will probably return. The question is whether it will be US yields that will turn lower to meet the dollar, or whether the dollar will eventually recover as a response to a continued upturn in yields. On balance, the latter case may be more likely, though one can only speculate as to how long that could take to materialize. Legendary bond investors, such as Bill Gross, are forecasting a sustained rise in yields (or in other words, a bond bear market). If such calls are accurate, then the dollar is unlikely to remain indifferent for too long.
Besides the greenback, such an outcome could have implications for stocks. Assuming yields do continue to move up, then at some point that may begin to weigh on demand for equities, as bonds begin to produce adequate returns to keep investors interested. Thus, if the yield on 10-year Treasuries crosses a certain critical level, we could see the aforementioned 'selling bonds to buy stocks' pattern reverse, though that level may still be a long way off.
The U.K. Economic Outlook: What About Brexit Uncertainty?
Executive Summary
The British economy expanded only modestly in Q4, with real GDP rising 1.5 percent year over year. While overall production increased in the quarter with growth across multiple sectors, real personal consumption expenditures (PCE) and investment spending have remained depressed over the past year in the wake of the Brexit Referendum in 2016. In this report, we examine the uncertainties surrounding Brexit negotiations and our outlook for 2018.
The sharp depreciation of sterling after Brexit led to a rise in inflation that subsequently eroded income growth and led to a drag on consumer spending. Growth in investment spending also slowed over the past year as Brexit uncertainties likely cautioned more expansionary business decisions. While there are still unknowns surrounding Brexit negotiations, the British economy looks poised to regain its momentum over the coming year. A pullback in inflation and strengthening real PCE growth, along with strengthening investment intentions, should be supportive of overall GDP growth. While the Bank of England (BoE) will likely remain on hold in the coming months in the midst of only slowly improving growth and softer inflation, our currency strategy team looks for the value of sterling to increase modestly against the dollar over the coming year amid general greenback weakness. We look for the U.K. economy to slowly return to growth rates closer to 2 percent over the coming quarters.
U.K. Economy Expands Modestly in Q4
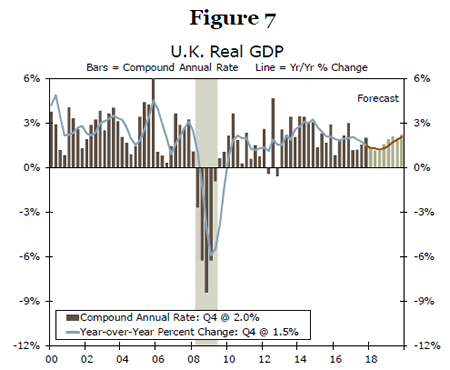
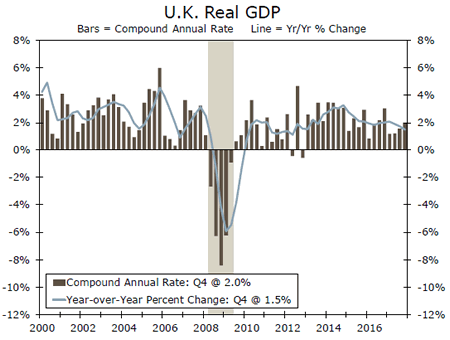
Preliminary data that were released today showed that real GDP in the United Kingdom rose 0.5 percent (2.0 percent on an annualized basis) in Q4-2017 relative to the previous quarter (Figure 1).
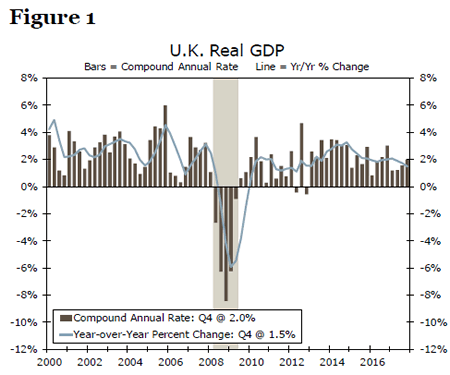
While the quarterly growth rate came in slightly above consensus, on a year-ago basis real GDP grew 1.5 percent, which was below the 1.7 percent Q3 print. The British economy expanded 1.8 percent in 2017, slightly below the 1.9 percent rate registered in 2016. A breakdown of the GDP data into its underlying demand components is not available at this time. However, industry-level data included in today's release showed modest expansion in the service sector, up 0.6 percent for the quarter. On the production side, total production was up a solid 0.6 percent for the quarter, led by the manufacturing sector, up 1.3 percent. The construction and mining sectors were a drag on growth in the quarter, down 1.0 percent and 3.9 percent respectively.
While we do not have demand side data at this time, personal consumption as measured by real retail sales has remained lackluster over the past year. Average monthly growth in real retail sales slowed in 2017 to around 2 percent year over year, compared to almost 5 percent in 2016. As we discuss in more detail below, the aftermath of Brexit saw a slowdown in overall consumer spending as rising inflation eroded purchasing power. However, inflation is starting to recede, which should lift purchasing power and thereby support growth in personal consumption expenditures in the coming quarters. A disaggregation of the Q4 GDP data into its underlying demand components will be available on February 22.
The Shock from Brexit is Starting to Fade
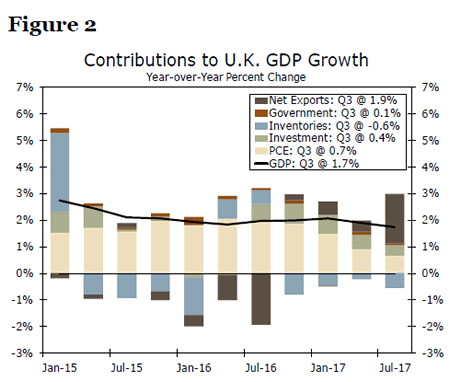
As Figure 1 makes clear, real GDP growth in the United Kingdom has downshifted over the past few quarters. Figure 2, which plots the contributions to the overall rate of GDP growth from individual demand components, shows that much of the deceleration in the British economy over the past few quarters stems from slower growth in real personal consumption expenditures (PCE). At the same time, net exports (NX) have helped to shore up the overall rate of GDP growth. These changing fortunes in two demand components of GDP reflect the same catalyst, namely, the sharp depreciation of the British pound in the immediate aftermath of the Brexit referendum in 2016.
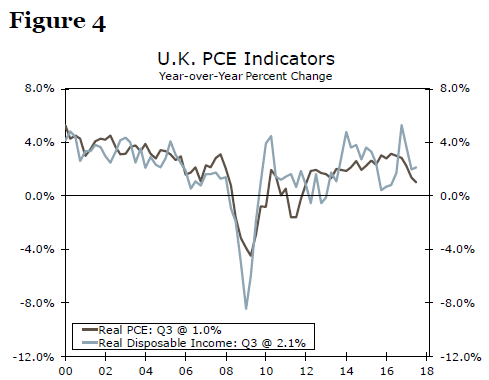
As shown in Figure 3, the trade-weighted value of sterling was down nearly 20 percent on a yearago basis in October 2016. This sharp depreciation in the value of the British pound has helped to lift U.K. export growth in recent quarters. But by raising import prices, sterling depreciation also contributed to the marked increase in the CPI inflation rate. Because there has been little acceleration in wages, higher inflation eroded growth in real disposable income (i.e., purchasing power). As shown in Figure 4, growth in real disposable income, which has a fair degree of correlation with growth in real consumer spending, weakened over the course of 2017.
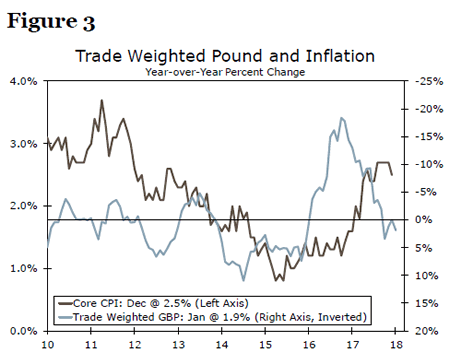
But the dynamics that led to a deceleration in consumer spending are starting to reverse. The trade-weighted value of sterling is now more or less flat on a year-ago basis. Consequently, the inflationary impulses that hit the economy via rising import prices are starting to weaken. Therefore, CPI inflation should recede in coming months, which should lead to stronger growth in real disposable income and some re-acceleration in consumer spending.
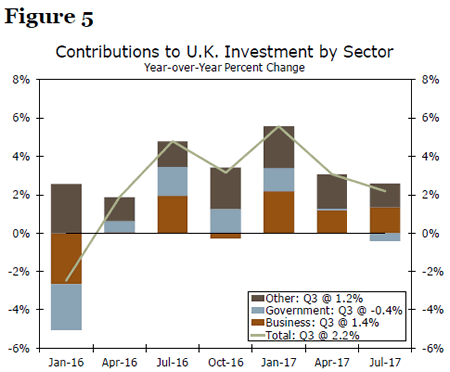
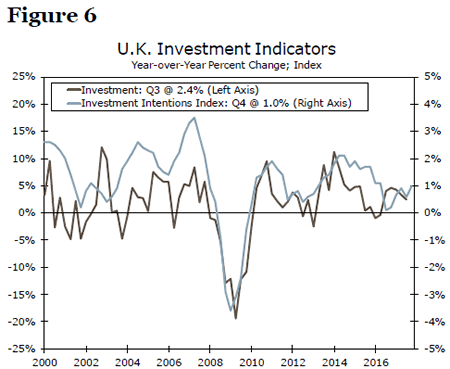
Growth in investment spending also slowed in 2017. As shown in Figure 5, gross fixed capital formation (GFCF) grew nearly 6 percent on a year-ago basis in Q1-2017, but growth had slowed to about 2 percent by Q3-2017. Drilling down into the components of GFCF shows that the slowdown was broad-based. Not only did growth in investment spending by the business sector downshift, but public sector investment declined on a year-ago basis in Q3-2017. "Other" investment (largely residential investment) also decelerated over the course of 2017. But there is some room for optimism going forward. A survey of investment "intentions," which has a fair degree of correlation with growth in actual investment spending, edged higher in the fourth quarter (Figure 6).
But Brexit Remains the Elephant in the Room
Our forecast looks for the year-over-year rate of real GDP growth in the United Kingdom to pick up from 1.5 percent in Q4-2017 back toward 2 percent by the end of 2019 (Figure 7). This forecast is predicated on the assumption that uncertainties related to Brexit do not weigh unduly on investment spending decisions. Prime Minister May's decision last year to trigger Article 50 of the Treaty on European Union means that the United Kingdom will formally leave the European Union on March 29, 2019. Some of the uncertainty related to Brexit was cleared up in December when U.K. and EU negotiators agreed to the terms of their "divorce."1 It is also likely that the arrangements that currently govern economic and financial transactions between the United Kingdom and the rest of the European Union will remain in place for about two years after March 2019. So negotiators will likely have between now and March 2021 to come up with a new framework for their economic and financial transactions.
But there still is significant uncertainty regarding those arrangements. Will trade in goods and services between the United Kingdom and the rest of the European Union remain tariff-free or will tariffs or other trade restrictions be placed on those goods and services? Will the United Kingdom maintain its "passport," which allows British financial institutions to freely offer financial products and services in the rest of the European Union? Nobody knows the answer to these and myriad other questions at this time. We are hopeful that this uncertainty will not cause businesses to shelve investment spending plans in the United Kingdom until the uncertainty is cleared up, but we acknowledge the risk that they could. Although it is not our base-case view, the risk of an investment-led recession in the United Kingdom in coming quarters is not insignificant.
Bank of England Likely Will Remain on Hold in Coming Months
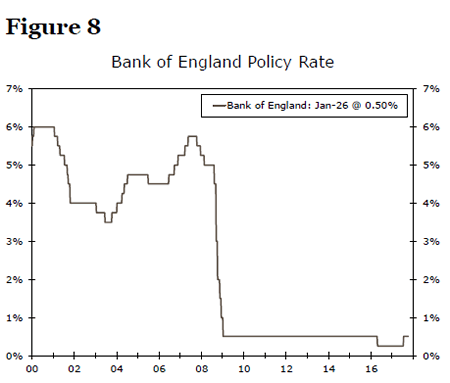
The Bank of England is also mindful of the downside risks posed to the British economy from Brexit uncertainty. In its most recent policy statement the Monetary Policy Committee (MPC) explicitly stated that "developments regarding the United Kingdom's withdrawal from the European Union—and in particular the reaction of households, businesses and asset prices to them—remain the most significant influence on, and source of uncertainty about, the economic outlook."
The uncertainty that spiked in the immediate aftermath of the Brexit referendum led the MPC to cut its main policy rate by 25 bps in August 2016 (Figure 8). Although the economy decelerated, it did not slip into recession as some had feared immediately after the referendum. Consequently, the MPC judged in October 2017 that its "insurance" rate cut was no longer needed, and it returned its Bank Rate to 0.50 percent where it remains today. In our view, growth will remain slow enough over the next few quarters to keep the MPC on hold. By the end of the year, however, real GDP growth should be showing signs of strengthening anew. We forecast that the MPC will tighten by 25 bps in Q4-2018, and we look for two more 25 bps rate hikes over the course of 2019.
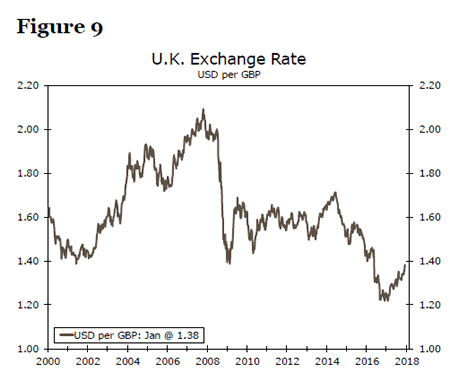
As shown in Figure 9, the British pound rose about 10 percent on balance in 2017 vis-à-vis the U.S. dollar following its marked decline from 2014 through 2016. Looking forward, Wells Fargo's currency strategy team expects that sterling will continue to trend slowly higher against the greenback in the context of broad-based dollar weakness. That said, our strategists look for the British pound to weaken modestly versus the euro in coming quarters.
Conclusion
Real GDP in the United Kingdom rose 1.5 percent in Q4 year over year, led by a solid increase in overall production, yet likely only modest growth in consumer spending. In the wake of the Brexit referendum in 2016, sterling depreciation and subsequent increases in inflation led to a pullback in real PCE and investment spending over the past year. However, the slowdown is likely starting to reverse as inflation begins to recede, wage growth slowly begins to pick up and investment intentions strengthen. A relatively stable trade-weighted value of sterling should also support a softening in inflation. In the midst of an improving outlook, Brexit negotiations still present uncertainties for the British economy, as the U.K. and European Union must determine the future of economic and financial relationships currently in place. The BoE will also likely maintain a cautious approach to tightening policy as Brexit negotiations continue, inflation slows and growth gradually picks up. Our currency strategy team looks for the value of sterling to gradually appreciate against the dollar in the coming quarters in the midst of general greenback weakness. We look for the British economy to return to growth rates closer to 2 percent by the end of 2019, assuming Brexit negotiations do not reverse the gradual improvement in consumer and investment spending in the meantime.
Weekly Economic and Financial Commentary: Robust GDP Growth Pattern Continues
U.S. Review
Robust GDP Growth Pattern Continues
- Fourth quarter 2017 GDP growth slowed slightly to 2.6 percent, as inventories and net exports exerted headwinds on growth.
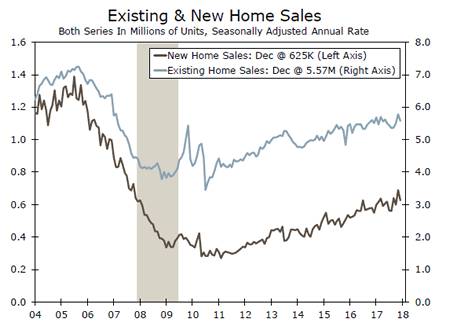
- Existing home sales fell 3.6 percent in December after growing at a 5.1 percent pace in November.
- New home sales also declined 9.3 percent in December, after following a sharp rise in November.
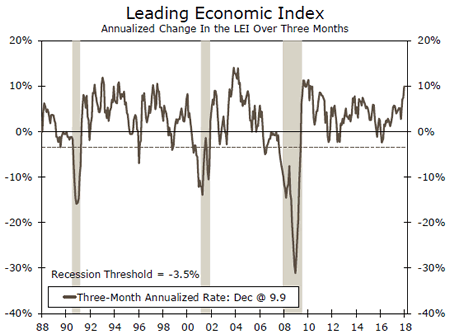
- The Leading Economic Index climbed higher in December signaling that the robust pace of economic growth is likely to continue.
Robust GDP Growth Pattern Continues
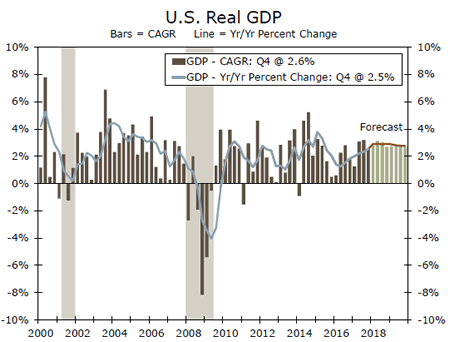
This week's economic data continued to support the case for ongoing robust economic growth. GDP growth for Q4 downshifted slightly from the third quarter, but remains a robust 2.6 percent. On an annualized basis, GDP growth has averaged 3.0 percent over the past three quarters. Separately, the durable goods report showed that orders remained strong for core capital goods orders, suggesting momentum behind business investment. The more forward-looking Leading Economic Index posted another solid gain in December suggesting that the solid pace of GDP growth in the coming quarters is likely to continue. New and existing home sales data pulled back slightly in December following strong readings in November. Given that we had forecasted 2.9 percent GDP growth for Q4, we made few changes to our forecast of 2.8 percent for Q1 of this year (top chart).
Fourth quarter GDP rose 2.6 percent on an annualized basis following the third quarter's 3.2 percent rate of growth. Our preferred measure of core demand, real final sales to private domestic purchasers, climbed to 4.6 percent on an annualized basis. One of the most impressive aspects of the GDP report was consumer spending, which rose 3.8 percent for the quarter, led higher by stronger spending on durable goods. Business investment and government spending were both stronger in Q4 relative to Q3. Domestic demand led to growth in imports outstripping growth in exports, which subtracted from headline growth as did a downshift in the pace of inventory building. Net exports subtracted 1.1 percent from headline growth, while the slower pace of inventory building shaved off 0.7 percentage points.
The Leading Economic Index pointed toward further robust GDP growth readings in the coming quarters. The index rose 0.6 percent in December to a 9.9 percent three-month annualized pace (middle chart). The index was led higher in part by the ISM new orders component. Average hours worked in the manufacturing sector was the only negative factor in the index. The forward momentum was also apparent in the durable goods report, which showed that core capital goods orders were up at a 12 percent three-month annualized pace even after the slight 0.3 percent decline in December. The stronger demand for core capital goods supports our forecast for business equipment investment to grow an additional 8.0 percent in the first quarter of this year.
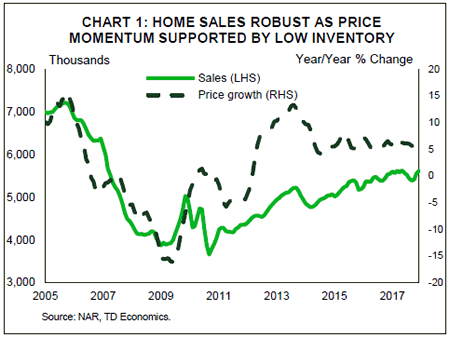
Housing market data showed some softening in December with new and existing home sales pulling back for the month (bottom chart). New home sales fell 9.3 percent for the month, while existing home sales declined 3.6 percent. The sales declines came on the heels of strong November readings. For existing home sales, tight supply remains one of the biggest factors holding back the overall pace of growth. Existing home supply fell to the lowest level since the National Association of Realtors began the measure in 1999. Even with December's declines, new home sales are up 2.6 percent relative to December 2016 and existing home sales are up 1.1 percent. We expect residential investment to expand 6.1 percent this year after the modest 1.7 percent pace of 2017.
U.S. Outlook
Personal Income • Monday
Personal income growth picked up momentum in recent months, which we expect continued in December. Personal income was up at a 4.4 percent three-month annual rate in November, which helped buoy the strong holiday shopping season in 2017. The acceleration in income growth has been driven by wages and salaries, suggesting the sluggish wage growth that characterized the past few years is finally abating. We are optimistic about 2018 and expect wages and salaries to continue pushing incomes higher.
As wages have picked up, inflation remained benign, according to the PCE deflator in November. Headline PCE was 1.8 percent higher over the year while the core was up just 1.5 percent. Soft inflation was supportive of consumers' purchasing power in November, as real consumer spending rose 0.4 percent on a strong showing for retail sales. By most accounts, December was also a strong shopping month, which bodes well for personal consumption at yearend.
Previous: 0.3% Wells Fargo: 0.3% Consensus: 0.3% (Month-over-Month)
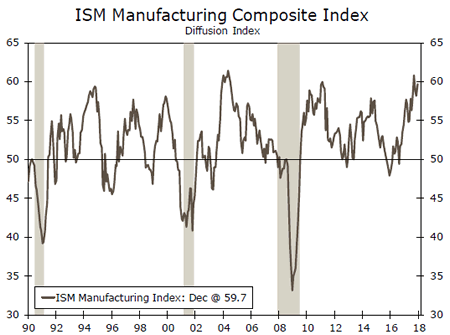
ISM Manufacturing • Thursday
The ISM Manufacturing Index remained elevated in November, notching 59.7, which was its fifth consecutive print of 58 or better. New orders were particularly strong, with the 69.4 December print being the highest in 13 years. That bodes well for factory activity in the first months of 2018. The December results hinted that factories are having trouble keeping up with the demand surge, judging by elevated indices measuring supplier delivery times and backlogs.
The pickup in global demand has been a major boon for American manufacturers, with comments describing better foreign demand becoming more frequent coinciding with the export component rising to a six-month high. That extra lift from global demand will likely continue. Domestic demand is also slated to remain supportive of capital investment and factory activity, particularly as the recently passed tax changes play out in business plans.
Previous: 59.7 Wells Fargo: 58.4 Consensus: 59.0
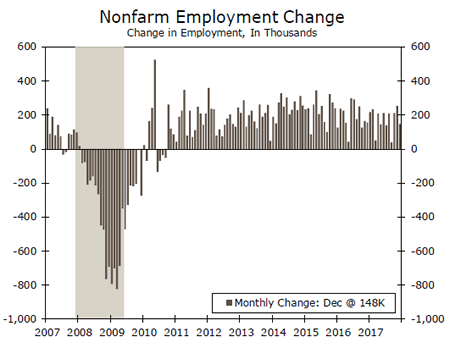
Employment • Friday
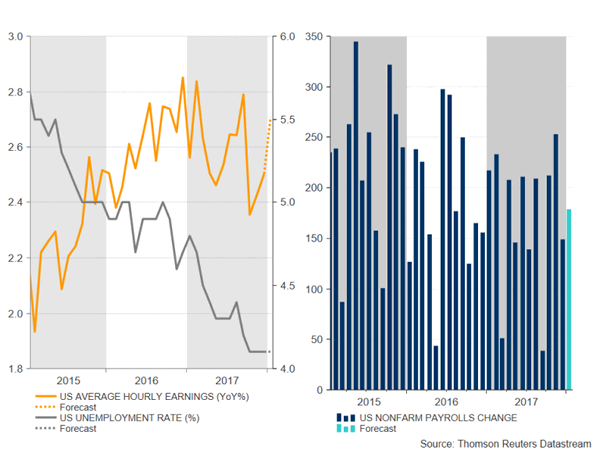
December's 148,000-job gain was smaller than the consensus estimated, weighed by a drop in retail employment. Retailers needed fewer workers this December, as an earlier Thanksgiving likely pulled holiday hiring forward to November, while brick and mortar stores continued to adjust to competition from online shopping. Conversely, the goods sector ramped up hiring at the end of the year.
Although December's print was a bit tepid, it followed strong gains in October and November. The economy added 203,700 jobs on average in Q4, which was its strongest three-month average since September 2016. Looking to the trend, 171,300 jobs were added per month, on average, in 2017. We expect the magnitude of monthly gains will slow to 163,000 jobs in 2018 and 148,000 jobs in 2019. We expect smaller gains going forward because of the low jobless rate, which we see averaging 4 percent in 2018 and 3.8 percent in 2019.
Previous: 148K Wells Fargo: 175K Consensus: 183K
Global Review
The Punch Bowls Stay Out: Last Call Approaching?
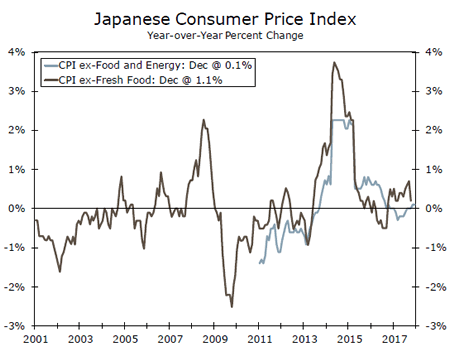
- The Bank of Japan left monetary policy essentially unchanged at its meeting this week as the central bank strives to sustain the recent improvement in economic growth and anchor inflation well above current levels.
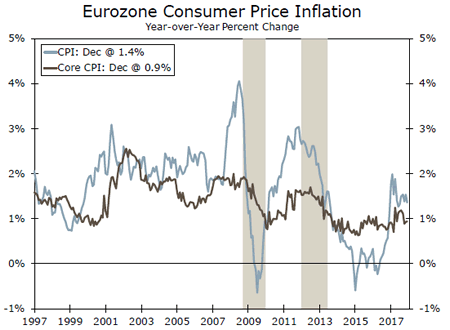
- The European Central Bank also reaffirmed its monetary policy stance, but improving economic conditions suggest policy stimulus will diminish further later this year.
- In the United Kingdom, real GDP decelerated for the third consecutive quarter on a year-over-year basis, rising just 1.5 percent. Relatively high inflation and stagnant nominal wage growth have kept real wage growth in negative territory.
The Punch Bowls Stay Out: Last Call Approaching?
Through the first month of 2018, the synchronous global economic rebound that took hold last year appears to have carried its momentum into the new year. Despite this, the Bank of Japan (BoJ) remained fully committed to its accommodative monetary policy stance at the conclusion of its policy meeting this week. When asked about how the BoJ would exit its current program of easing measures, Kuroda replied that policymakers in Japan "haven't reached the stage of thinking about how to handle an exit."
In addition, the BoJ made no changes to its economic forecast and still sees real GDP growth gradually moderating throughout the forecast period. The BoJ expects 1.9 percent growth in the current fiscal year (ending in March) and 1.4 percent in fiscal 2018 before slowing to 0.7 percent in fiscal 2019. The forecast for the consumer price index (CPI) was unchanged as well, with 0.8 percent growth expected in the current fiscal year and 1.4 percent for the next two years. Japan has struggled with periods of sluggish economic growth and outright deflation since the 1990s. That said, Monetary policymakers appear more inclined to err on the side of caution before declaring mission accomplished, particularly with inflation still well short of the two percent target (top chart).
Sticking to the theme, policymakers at the European Central Bank (ECB) reaffirmed the current path of monetary policy this week. The Governing Council of the ECB maintained the monthly pace of net asset purchases at €30 billion with the intention of maintaining this pace "until the end of September 2018, or beyond, if necessary," with key ECB interest rates remaining at their present levels "well past the horizon of net asset purchases."
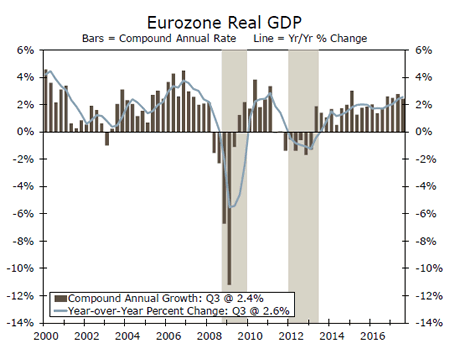
Economic conditions have clearly improved in the Eurozone, with economic growth strengthening to a 2.6 percent year-over-year pace, consumer and business sentiment reaching cycle-highs and unemployment steadily falling. Below-target inflation, however, remains the key sticking point. Core CPI inflation is just 0.9 percent in the Eurozone at present, nearly a full percentage point below the year-over-year pace in the United States (middle chart). The Governing Council of the ECB has its next monetary policy meeting on March 8, when guidance could change if policymakers deem conditions strong enough to pull forward the current schedule for gradually removing policy stimulus.
In the United Kingdom, real GDP growth slowed in Q4, registering a 1.5 percent year-over-year pace (bottom chart). Output growth was solid in the manufacturing and business services and finance sectors, but weakness in construction and mining and quarrying weighed on growth. Q4 weakness in the distribution, hotels and restaurants sector may reflect the decline in purchasing power that U.K. consumers have experienced over the past few quarters. Consumer price inflation is near 3 percent at present in the United Kingdom, largely as a result of the sterling's depreciation in the wake of Brexit. However, the trade-weighted value of sterling is now more or less flat on a year-ago basis. Consequently, the inflationary impulses that hit the economy via rising import prices are starting to weaken, which, coupled with a tight labor market, should help lift consumer spending growth.
Global Outlook
Eurozone GDP • Tuesday
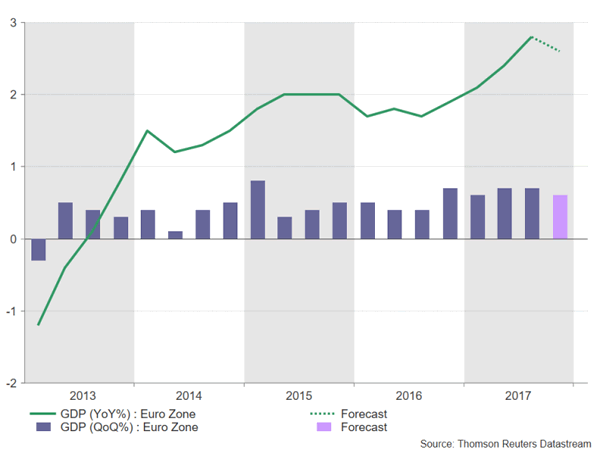
Real GDP in the Eurozone expanded 2.6 percent year-over-year in Q3, the fastest year-over-year growth rate since Q1-2011. The outturn was better than the consensus had expected and by many indications, the economy continued to improve in the final quarter of 2017. Industrial production increased in the first two months of the quarter and the manufacturing PMI for the Eurozone climbed to a multi-year high. The unemployment rate also continued to decline throughout the period.
At its policy meeting earlier this week, the ECB noted the improvement in the economy (see global review for more on the ECB).
Financial markets will get an indication of how the Eurozone economy fared in the fourth quarter when the initial estimate for GDP growth prints on Tuesday.
Previous: 2.6% Wells Fargo: 2.5% Consensus: 2.7% (Year-over-Year)
Japanese Ind. Production • Wednesday
Speaking of central banks, the Bank of Japan (BoJ) met this week as well and it sought to convince financial markets that it has no intention of winding down its comprehensive package of accommodative monetary policy. This comes despite the fact that in practice, BoJ policymakers have already dialed back the amount of longer-dated Japanese government bonds it has been buying.
Notably, the BoJ opted to leave its economic forecast for Japan unchanged even as the IMF and private sector forecasters have boosted estimates for GDP growth in Japan in recent weeks.
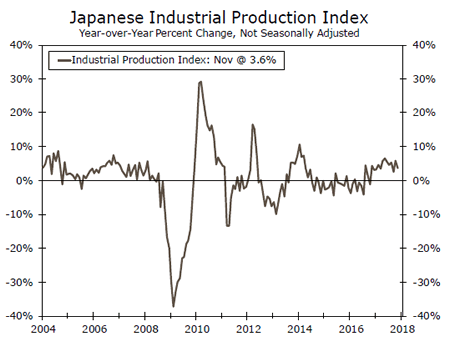
On Wednesday, data for December industrial production will offer a look at how Japan's manufacturing sector fared at the end of Q4. Although the year-over-year pace of growth may slow, the monthly sequential increase for December is expected to be bigger than it was in November.
Previous: 3.6% Consensus: 3.2% (Year-over-Year)
U.K. Manufacturing PMI • Thursday
Economic figures out of the United Kingdom have been mixed in recent weeks. December retail sales fell well short of expectations and the trade deficit widened in November.
That said, industrial production figures for November came in a bit better than expected and a jobs report for the three-month period that ended in November showed a pick-up in jobs.
A widely-followed estimate of monthly GDP figures for the United Kingdom revealed a better-than-expected increase of 0.6 percent in December and that came on the heels of an upward revision to November. The official fourth quarter GDP report printed earlier today and showed a 0.5 percent quarterly increase.
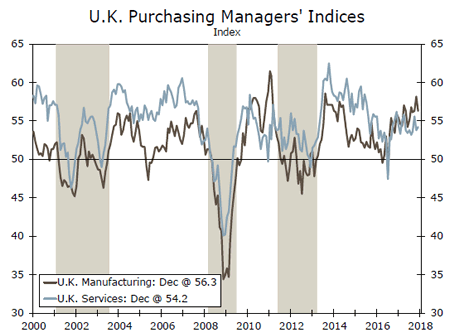
The manufacturing PMI came off a cycle high of 58.2 in November to reach a still-high 56.3 in December. The first print for 2018 is due on Thursday of this coming week.
Previous: 56.3 Consensus: 56.5
Point of View
Interest Rate Watch
Changing of the Guard
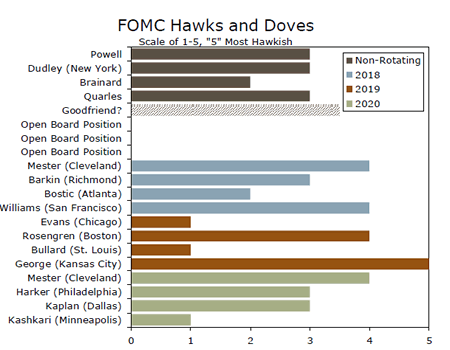
The FOMC holds its first meeting of the year next week in what will also be Chair Yellen's final meeting. The departure of Yellen marks just one of the personnel changes for the Committee this year that, along with the usual rotation of voting regional presidents, may alter the Fed's tilt.
On balance, the voting regional presidents this year look to be somewhat more hawkish (top chart). Rotating off will be some of the most dovish members of the committee (Charles Evans and Neel Kashkari) along with two moderates (Patrick Harker and Robert Kaplan).
In their stead will be Loretta Mester and John Williams, who have been a bit more vocal in stressing the risks of the economy overheating. Raphael Bostic will be a first-time voter, but earlier this month said his base case is for two or three hikes this year. We assume a Thomas Barkin, also a first-time voter and only a month into the job, will stick close to the consensus for now.
Bigger Changes to Come?
How much will the new voter mix matter? We think very little at this time. Voters or not, all members have a voice at the table and are able to shape the consensus. Moreover, a critical mass of voters still seem content with the current consensus of three rate hikes this year.
Looking further out over the year, however, that consensus could evolve more meaningfully amid additional changes. New York Fed President/FOMC Vice Chair Bill Dudley plans to retire by mid-year. Yellen's departure and replacement by current Governor Powell opens up another seat.
That would leave four open board seats, one of which may be filled by Marvin Goodfriend. In his confirmation hearing this week, he was committed to the Fed's dual mandate of inflation and employment but has previously put more emphasis on keeping inflation well anchored. Currently, he views the Fed as "more or less on the right path going forward." Yet, if his traditionally more hawkish stance is echoed by additional new members later this year, rates could be headed higher faster than currently outlined.
Credit Market Insights
Mortgage Applications Rise Again
Mortgage applications have started out 2018 with a bang, rising solidly in each of the three weeks to begin the year. This week's 4.5 percent jump follows consecutive weeks of 4.1 and 8.3 percent gains, respectively. Applications are now up 6.1 percent compared to this time last year.
Applications for home purchases are leading the charge, posting greater than 5 percent gains in two of the three weeks. Purchase applications are up 7.4 percent over the year, while refinancing mortgage applications are up a lesser 4.8 percent. While refinancing applications grew over the past week by just under 1 percent, the share of mortgage activity for refinancing fell below 50 percent, to 49.4 percent from 52.2 percent. This has been caused by the strong 6.1 percent growth seen in purchase applications following the already strong start. The fast start to the year for mortgages confirms strong homebuyer demand should continue into 2018, and bodes well for Q1-2018 home sales.
The average mortgage size also increased for the fourth consecutive week, indicating a further run up in home prices as inventory continues to underwhelm demand. Fixed rate, Federal Housing Administration backed mortgage rates increased to 4.37 percent, from 4.30 percent, which is the highest rate since September 2013. The uptick in mortgage applications, mortgage size, and mortgage rates is consistent with continued home buying demand in 2018, which should spur residential investment.
Topic of the Week
IMF Bumps Up Global Forecast
The International Monetary Fund (IMF) typically updates its global forecast twice annually in April and in October. From time-to-time, it may offer an interim update when developments warrant it. At the World Economic Forum in Davos this week, the IMF did just that.
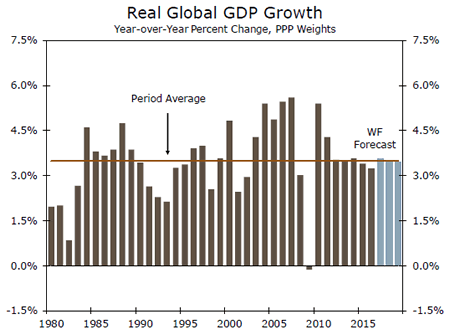
Citing the sweeping U.S. tax cuts, which it expects to boost investment in the world's largest economy and help its main trading partners, the IMF revised up its forecast for global GDP growth in 2018 and 2019 by 0.2 percentage points a year to 3.9 percent per annum for each year.
The tax cuts would likely widen the U.S. current account deficit, strengthen the U.S. dollar and affect international investment flows. In the accompanying update to its flagship publication, the World Economic Outlook, the IMF stated "tax reform is therefore anticipated to stimulate near-term activity in the United States. As a byproduct, stronger domestic demand is projected to increase imports and widen the current account deficit."
In a special report we published a few weeks ago, we honed in on this dynamic as well. We observed at the time that because "a current account deficit is caused by a shortfall of national savings relative to national investment, the red ink in the current account likely will widen further going forward due, at least in part, to recent tax legislation."
It was notable, in our view, that the IMF identified upward risk for U.S. trading partners, and we highlight that the IMF lifted its forecast for economic growth in Canada, Mexico, Japan and China. Despite the overall bullish tone of the report, the IMF acknowledged that risks in the medium term could pose a challenge. Specifically, the IMF pointed to rich asset valuations and compressed term premiums as potential signs of forthcoming financial market correction. Providing the trigger for such a downturn, the IMF citied faster-thanexpected growth in inflation and interest rates in the advanced economies.
The Weekly Bottom Line: Greenback Takes a Beating on Davos Comments
U.S. Highlights
- U.S. economic data was relatively constructive this week; existing home sales remained near their multiyear highs, while real GDP expanded by a robust 2.6% (annualized) to cap off last year.
- The IMF upgraded its global economic forecast to 3.9% for this year and next. Managing Director Lagarde hailed it the "broadest synchronised global growth upsurge since 2010."
- This year's Davos meetings were focused on trade, with Trump, Ross and Mnuchin forming the core of the U.S. delegation. The Treasury Secretary grabbed headlines saying that a "weak dollar is good" for the U.S.
- The ECB and BoJ stood pat on rates, with the Fed likely to follow suit next week at Chair Yellen's last meeting.
Canadian Highlights
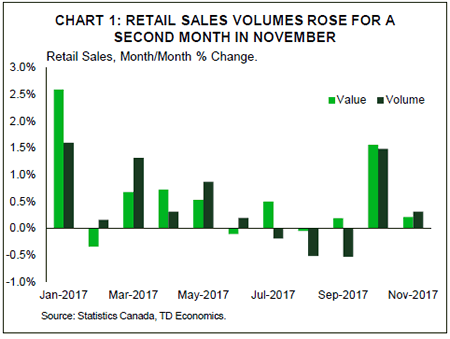
- Canadian retail sales grew again in November, with volumes rising for a second month, pointing to a solid end to 2017 for economic growth.
- A somewhat ho-hum December inflation headline hid ongoing strength in core measures, consistent with the economic strength seen in 2017. The Bank of Canada will likely be happy to see the positive growth-inflation link confirmed.
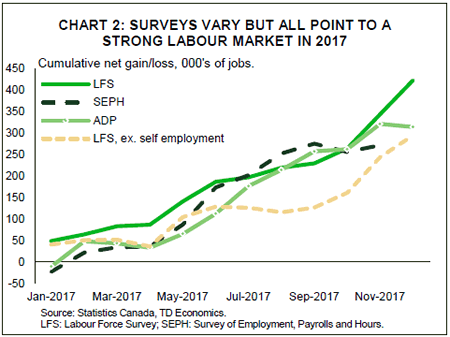
- Payrolls data for November confirmed the strength of Canadian labour markets. Concerns over the reliability of jobs data appear misplaced, as all three major indicators of jobs growth have been sending the same signal.
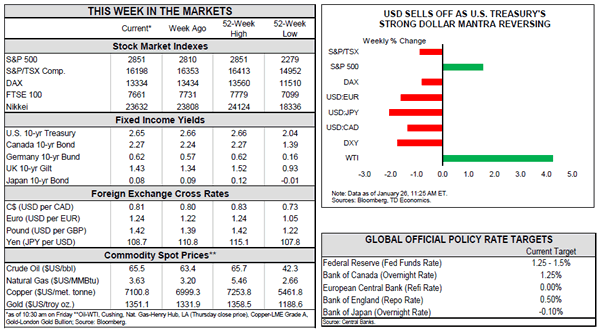
U.S. - Greenback Takes a Beating on Davos Comments
The week got off to a good start, with Congress on Monday voting to end the 69-hour government shutdown. Still, the vote extends funding for the federal government until only February 8th – a mere eighteen days. Markets, having shrugged off the shutdown threat (the new modus operandi in Washington), were neither elated nor surprised about the can being kicked down the road again.
U.S. data was also relatively constructive. Existing home sales remained near multi-year records. Housing markets will have to contend with rising rates and lack of for-sale inventory, but will remain supported by above-trend growth and diminishing slack. U.S. real GDP capped the year with growth of 2.6% (annualized) in Q4 - more than half a point above its potential rate.
Robust U.S. growth comes alongside a solid global backdrop. This week, the IMF updated its global economic forecast to 3.9% for this year and next – 0.2 pp higher than before. The Fund's Managing Director Lagarde, speaking in Davos, hailed this the "broadest synchronised global growth upsurge since 2010", also highlighting that trade remains a "significant engine of growth."
Trade was a key focus of Davos this year. On the eve of the signing of the new TPP-11, which the U.S. pulled out of, Japanese Economy Minister Motegi said the pact would be an "engine to overcome protectionism," while Canada's Prime Minister Trudeau called it "the right deal." President Trump, defending his stance, indicated that "America is open for business" and suggested the U.S. may join the TPP if the terms are better.
Still, America's protectionist policies remain a worry. The U.S. this week levied tariffs on washing machines and solar panels. Defending the move, Commerce Secretary Ross stated that the U.S. approach to trade policy is dated, indicating that he is trying to right past wrongs and that the U.S. is done being "a sucker" or "a patsy" on trade.
But, it was Treasury Secretary Mnuchin that grabbed most headlines, stating that "a weaker dollar is good," – a reversal of U.S. Treasury mantra. A broad U.S. dollar selloff followed, despite attempts by Ross and Trump to repair the damage.
Mnuchin's comments were criticized by ECB President Draghi who referred to an international agreement last October not to talk down currencies. Speaking after the ECB kept policy rates unchanged this week, Draghi insisted that the bank would consider loosening policy to offset "unwarranted" tightening related to exchange rate. The ECB is unlikely to tighten policy until mid-2019, but is expected to let is bond-buying program lapse in September.
The BoJ also kept rates steady, only altering its inflation outlook wording from "weaker than expected" to "broadly unchanged." And in what will be the last meeting headed by Chair Yellen, the Fed is also likely to stand pat next week. The incoming Chair, Jerome Powel, will take over on February 3rd, having been confirmed by the Senate this week. We don't expect the policy to be dramatically altered by the change at the top, with our current view for three Fed hikes this year.
Canada - All Signs Point To A Solid End To 2017
It was a somewhat volatile week in financial markets as attention was focused on the World Economic Forum in Davos, Switzerland. The Canadian dollar rose through the first part of the week, helped by U.S. Secretary of the Treasury Mnuchin's comments indicating that the U.S. administration was happy with a softer U.S. dollar. President Trump walked this back somewhat, indicating that he favoured a stronger dollar "over time". This sent the U.S. dollar higher, but the effect didn't last for the loonie, which looks set to end the week around 81 cents U.S., a cent higher than where it began.
Away from market moves, the economic data this week painted a consistent story of the Canadian economy, and a fairly positive one at that. To start with, retail sales rose again in November (Chart 1). While a far cry from October's robust performance, it was still encouraging, particularly as sales volumes rose for a second month, breaking the string of weakness seen in the third quarter. All signs continue to point to a decent end to 2017, with economic growth tracking in line with the Bank of Canada's expectations of 2.5% annualized growth in Q4.
The Bank of Canada will also likely be pleased by December's inflation numbers. Headline inflation, at 1.9% was ho-hum, in line with expectations and helped by still elevated energy prices on a year-ago basis. More importantly, two of the three preferred core measures rose on the month, and the average of these measures now stands at 1.8%, not far off the Bank's 2% target. This provides some comfort that the relationship between growth and inflation remains intact, and that this month's rate hike was needed to help control future price growth.
More confirmation of the economy's strength in the latter half of last year came from the lesser-watched, but still informative Survey of Employment, Payrolls and Hours (SEPH). Released with a lag (November data was just released this week, whereas the more commonly followed Labour Force Survey (LFS) has already been released for December). This survey reported net payroll gains of 16k in November and headline wage gains of 2.8% year-on-year, adding more evidence that 2017 was a year of robust gains for Canadian jobs markets.
To this point, some commentators have dismissed or downplayed recent jobs data, citing volatility in some underlying details of recent LFS reports. The volatility of this data means that monthly reports should be taken with a grain of salt, but it does not mean they should be dismissed. Indeed, when year-to-date jobs growth is considered across the major indicators available, a consistent picture emerges (Chart 2). Both the LFS and SEPH point to strong gains through November, as does the recently introduced, privately-run ADP survey, even with the modest pull-back in job creation reported for December. What's more, if we remove self-employment from the LFS data (a key difference vs the other reports) to make the series more comparable, we see that this 'noisier' series actually paints a slightly softer but still positive story of the Canadian economy, consistent with the other measures. Indeed, if anything the SEPH and ADP figures suggest that LFS has been understating payroll gains. The bottom line is, no matter how you choose to slice it, Canada was a jobs producing machine in 2017.
U.S.: Upcoming Key Economic Releases
U.S. Employment - January
Release Date: February 2, 2018
Previous Result: 148k, unemployment rate 4.1%
TD Forecast: 175k, unemployment rate 4.0%
Consensus: N/A
We expect nonfarm payrolls to advance by a respectable 175k in January, below its 3-month average pace as adverse winter weather and some deceleration in employment surveys bias the figure lower in our view. We expect the unemployment rate to slip to 4.0% after holding at 4.1% in the prior three months, as robust job growth and a stabilizing participation rate suggest we are due for a drop. But the focus is more on wages this month, and markets will eye an upside surprise on the back of announcements of wage hikes and bonus increases by firms after the tax reform passage and the scheduled minimum wage hikes in 18 states and 20 cities. The increases on balance point to less than a 0.1pp m/m contribution to January average hourly earnings in our view, similar to the impact in January 2017. Meanwhile, calendar effects introduce a downward bias this month. Taken together, we expect a 0.2% m/m increase, leaving earnings unchanged at 2.5% y/y.
Canada: Upcoming Key Economic Releases
Canadian Real GDP - November
Release Date: January 31, 2018
Previous Result: 0.0% m/m
TD Forecast: 0.3% m/m
Consensus: N/A
TD looks for a 0.3% advance in industry-level GDP for November, with outperformance in the goods-producing industries which have been previously been held back by supply disruptions. Activity data on exports and manufacturing shipments suggests that such effects are fading, pointing to a solid growth contribution from manufacturing. The record jump in housing starts points to strength in construction as well. We expect a solid advance from services on account of upbeat data on consumer spending and home sales. Our forecast is consistent with Q4 real GDP tracking near 2.5%, matching the Bank's forecast.
Week Ahead – US Jobs Report and Fed to Keep Dollar in Spotlight; Eurozone GDP also in Focus
The economic calendar in the coming seven days will be a busier one with a slew of data releases and the Fed's first monetary policy meeting of the year. The US employment report will be the data highlight of the week followed by the euro area's preliminary GDP reading for the final quarter of 2017. PMI figures out of the UK and China, and Australian CPI numbers will also be important.
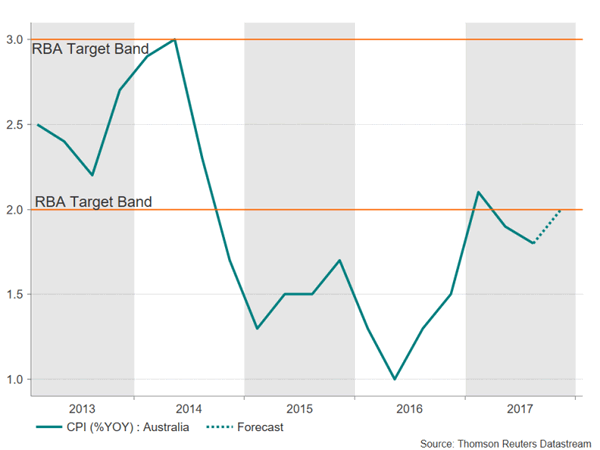
Australian inflation to crawl into RBA's target band
The Australian dollar has rallied over 3.5% versus its US counterpart so far in 2018, though the gains have mainly been driven by a weaker greenback and strong risk appetite than any convincing signs that Australian inflation is on the up. Quarterly CPI data due on Wednesday could change this picture however as the annual headline rate is forecast to accelerate to 2% in the December quarter, from 1.8% previously. Also due on Wednesday are figures on private sector lending for December, while Thursday's building approvals are also likely to grab some attention. The aussie could re-test this week's 4½-month high of $0.8118 should the incoming data top the forecasts.
Bank of Japan could attract more unwanted attention
At its meeting earlier this week, the Bank of Japan's governor, Haruhiko Kuroda, failed to convince markets that the bank is a long way off before it begins to scale back its massive stimulus program. The minutes of the December meeting released on Friday, showed some board members voiced concern about the possible side effects from negative interest rates and purchases of exchange-traded funds. We could hear more such concerns from the BoJ's Summary of Opinions of the January meeting on Wednesday, putting even more pressure on the dollar/yen pair.
Before that though, data on household spending, unemployment and retail sales will be looked at on Tuesday. Household spending is forecast to dip 0.6% month-on-month in December, while the annual growth in retail sales is expected to moderate to 1.8% from 2.2% in November. The unemployment rate likely held steady at 2.7% during the same period. Also to watch are industrial production figures on Wednesday.
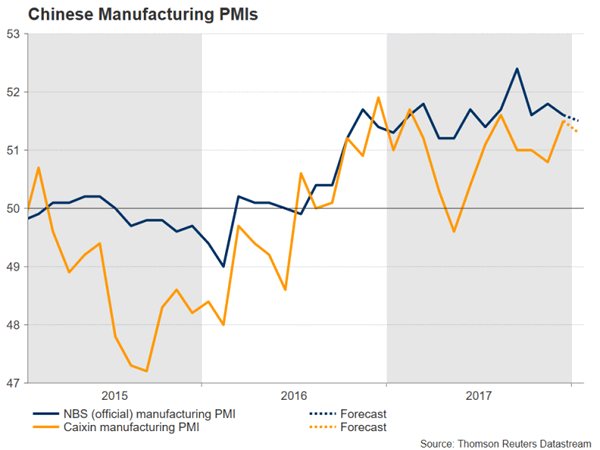
Chinese and UK PMI eyed
China's official manufacturing and non-manufacturing PMIs are both due on Wednesday and will be followed by the Caixin/Markit manufacturing PMI on Thursday. Both manufacturing PMIs are forecast to ease slightly in January.
The UK will also see the release of the PMI business gauges. British manufacturing activity is expected to improve in January, with the index rising from 56.3 to 56.5 when released on Thursday. The construction PMI will follow on Friday and is forecast to worsen slightly during the same period.
Sterling could get a further lift should the manufacturing data surprise to the upside, as it would underline the brightening economic picture in the UK. The pound could also be sensitive to Governor Mark Carney's comments on the economy when he testifies before the House of Lords Economic Affairs Committee in Parliament on Tuesday. The Bank of England Governor, who was in Davos this week, said greater clarity on Brexit could help the UK economy "recouple" with the rest of the world. Optimism about a positive Brexit outcome has made sterling the best performing currency against the US dollar so far this year, breaking above the $1.43 for the first time since the June 2016 referendum.
Eurozone GDP to point to strong end to 2017
The Eurozone will follow China, the UK and the US in reporting its flash estimate of fourth quarter GDP on Tuesday. From the major countries who have already published their figures, China and the UK posted better-than-expected numbers but US GDP disappointed slightly. For the euro area GDP, the risk is to the upside. Quarterly growth is expected at 0.6% for the three months to December, below the prior 0.7% rate, but given the upbeat business surveys, a surprise 0.7% print is possible.
Also on Tuesday is the European Commission's economic sentiment index, and on Wednesday, flash CPI estimates will be in focus. The preliminary reading is expected to show Eurozone inflation easing from 1.4% to 1.3% in January, potentially giving the ECB's doves who are worried about the rapidly rising euro, a stronger argument for not rushing with a QE exit plan.
First nonfarm payrolls report and FOMC meeting of 2018
US data will dominate in the coming week, starting with Monday when the personal consumption expenditures (PCE) report is published. Personal income is forecast to rise by 0.3% month-on-month in December, while personal consumption is expected to slow from 0.6% to 0.4%. The report will also contain the core PCE price index, which is the Fed's preferred measure of inflation. The index is forecast to remain at 1.5% year-on-year in December, pointing to an absence of inflationary pressures even as the labour market tightens further.
The January jobs report out on Friday should shed more light about the state of the US labour market. Nonfarm payrolls likely accelerated from 148k to 178k in January. The jobless rate is expected to stay unchanged at 4.1% but growth in average hourly earnings could quicken to 2.7% in January from 2.5%, with the month-on-month rate is forecast to hold at 0.3%. Among Friday's flurry of data, the other notable release will be the ISM manufacturing PMI, which is expected to fall slightly to 59.0, as well as December's factory orders.
Going back to the mid-week schedule, housing data (S&P/CaseShiller 20-City Home Price Index on Tuesday and pending home sales on Wednesday) will be watched along with the Conference Board's consumer confidence index (Tuesday) ahead of the Fed's monetary policy decision on Wednesday. The January FOMC meeting is looking like a non-event as it will be Janet Yellen's last meeting as Chair before Jerome Powell takes over, and there is no press conference after the announcement. However, the accompanying statement could contain revised views on the economy and inflation, and while a March rate hike is widely priced in by the markets, unexpectedly stronger language could give the struggling dollar a bit of a boost.
Another key risk event for investors on Wednesday will be President Trump's first 'State of the Union' address on Tuesday. The US President will probably use his speech to boast about the economy, while promoting his agenda to increase spending on infrastructure and reform immigration laws. The main concern for the markets though will be whether or not Trump will mention trade as any fresh rhetoric on protectionist policies could further hurt the dollar, as well as dampen risk sentiment.
Dollar Falls After Mixed Signals from Trump Administration
Disappointing US GDP and contradictory comments on currency strength at Davos burden dollar
The USD depreciated against majors as soft Q4 GDP numbers on Friday and mixed comments on the desired strength and weakness of the currency made at the World Economic Forum in Davos put downward pressure on the greenback. The Trump administration is pushing its tough stance on trade, but tried to soften the tone in an effort to be more inclusive. Economic fundamentals and monetary policy have been supportive of the currency, but political lack of stability has hurt the buck. Next week the market will focus on the U.S. Federal Reserve and the U.S. non farm payrolls (NFP).
- US President Trump to deliver his first State of the Union Address
- Fed anticipated to keep rates on hold at 1.25-1.50 percent
- US forecasted to have added 184,000 jobs in January
Dollar Confused Ahead of US Jobs Report and Fed Statement
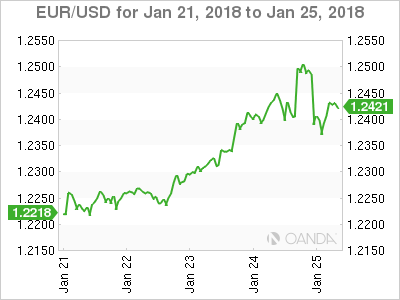
The EUR/USD gained 1.73 percent in the last five days. The single currency is trading at 1.2426 after contradictory statements from the Trump administration confused markets. Secretary of the Treasury Steve Mnuchin said on Wednesday that the weaker dollar was good for the US in relation to trade. The USD retreated and the EUR touched three year highs. Next day President Trump said the he ultimately wants to see a strong dollar as the currency is a reflection of the strength of the economy. The USD recovered some ground versus the EUR, but the damage had already been done and the EUR advanced 0.27 percent on Friday.
The first estimate for US GDP for the fourth quarter was released and it was short of expectations at 2.6 percent. The forecast the market was looking for was 3.0 percent, but given its the advanced estimate there will be two more released that could see the final GDP figure higher in the following months.
The EUR has been rising despite the words from European Central Bank (ECB) President Mario Draghi. The central bank kept its rate and massive quantitive easing program untouched. Draghi made sure to mention that stimulus would remain for as long as needed, but had to concede there were few chances it will change interest rates. The ECB President made a comment warning about using verbal intervention to talk down a currency when asked about the Davos statement from Mnuchin.
US President Trump will deliver its first Sate of the Union address on Tuesday, January 30, at 9:00 pm EST. Failing to avoid a government shutdown Trump will focus on the positives during his first year. His achievements in passing legislation came late in 2017 but he is sure to mention the tax reform bill. The stock market record breaking pace and overall strength of the economy while inherited will also be mentioned with the infrastructure plan something to look for in the immediate future. The USD got a Trump bump in late 2016 when just after winning the elections
The U.S. non farm payrolls (NFP) will be published on Friday, February 2 at 8:30 am EST. Economists are expecting the US to add 184,000 positions in January. Last month's report came in lower than expected but the saving grace for the USD was that hourly wages grew 0.3 percent as expected. There are similar gains forecasted for January wages with a special emphasis on inflationary data as the Fed ponders what to do with stagnant wages despite a strong job component.
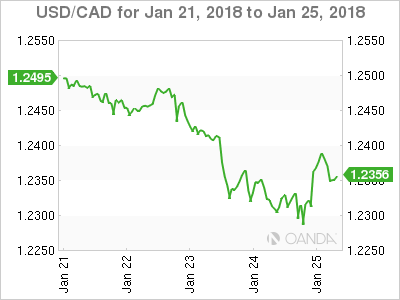
The USD/CAD lost 1.38 percent during the week. The currency pair is trading at 1.2323 with a weaker greenback sliding against a stronger loonie. The Bank of Canada (BoC) lifted its benchmark rate 25 basis points earlier in the month and Friday's release of Canadian inflation coming in even lower than expected at –0.4 percent and validates the slowing inflationary rise view from the central bank.
The uncertain future of NAFTA had previously sapped the loonie from any positive impact from the interest rate hike, but comments this week about the importance trade by the Trump administration have lessened the anxiety about the trade deal. While the US representatives were sure to mention America first, even Trump conceded that America is not alone. The March deadline is fast approaching and negotiations have little to show for it. Elections in Mexico and the United States will make the trade deal a heavy politicized item in 2018. The biggest surprise at Davos from the White House was the apparent softening of their hard line on the Trans Pacific Pact (TPP). The now 11 nation deal was one of the first casualties of the administration and the remaining members agreed to go ahead without the US this week.
Oil prices have been boosted by the weak US dollar and encouraging signs that the global demand for energy is on the rise. The Organization of the Petroleum Exporting Countries (OPEC) production cut agreement was instrumental in stopping the free fall of crude. US shale producers were predicted to have ramped up their supply by now, but weather and other factors have stood in their way. The main risk for crude is a sudden revival of the US dollar that could trigger a sell off in commodities with investors looking to book profits at current three level highs.
Market events to watch this week:
Tuesday, January 30
- 10:00am USD CB Consumer Confidence
- 10:30am GBP BOE Gov Carney Speaks
- 7:30pm AUD CPI q/q
- 9:00pm USD President Trump Speaks
Wednesday, January 31
- 8:15am USD ADP Non-Farm Employment Change
- 8:30am CAD GDP m/m
- 10:30am USD Crude Oil Inventories
- 2:00pm USD FOMC Statement
- 2:00pm USD Federal Funds Rate
Thursday, February 1
- 4:30am GBP Manufacturing PMI
- 10:00am USD ISM Manufacturing PMI
Friday, February 2
- 4:30am GBP Construction PMI
*All times EST
Australia & New Zealand Weekly: Revised Views on US Federal Reserve and AUD
Week beginning 29 January 2018
- Revised views on US Federal Reserve and AUD.
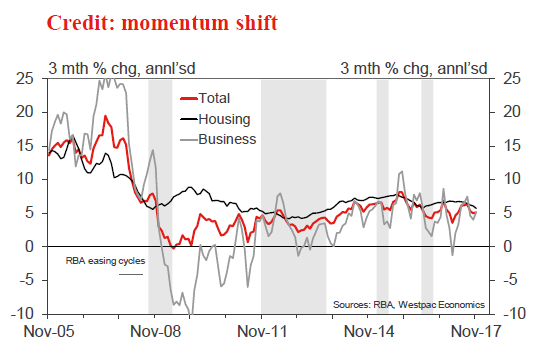
- Australia: Q4 CPI, private credit, dwelling approvals, CoreLogic house prices, and Q4 import & export price index.
- NZ: Dec residential building consents.
- US: FOMC policy meeting, employment report and employment cost index.
- Key economic & financial forecasts.
Information contained in this report was current as at 25 January 2018.
Revised Views on US Federal Reserve and AUD
Westpac has revised the outlook for the Federal Funds rate and the Australian dollar.
When we last produced our forecasts in mid December we expected that the Federal Funds rate would be increased by 25 basis points in June and December in 2018 to reach 1.875% by year's end.
We envisaged "neutral" as zero real and expected that "zero real" would be sufficient to allow the FED to go on hold through 2019 as other major central banks, particularly the ECB and BOJ, embarked upon their own tightening programs.
Associated with that higher Federal Funds rate would be a rising bond rate and rising US dollar with targets of a rise of around 5.5% in the USD Index (DXY) and an increase in the US 10 year bond rate to 3% from 2.35% at the time.
Associated with that expected increase in the USD; an expected fall in Australia's Commodity Price Index of around 20%; and a deteriorating yield differential as the RBA remains on hold in 2018 we expected a fall in the AUD from around USD 0.765 to USD 0.70.
This commodity view, which seems at odds with the current surge in global optimism, is partly based on our below Consensus forecast for Chinese growth in 2018 (6.2%, down from 6.9%) as the authorities slow investment growth and embrace more aggressive financial reform.
In a surprising development the USD Index has in fact depreciated by around 4% since mid-December despite a sharp widening in the US yield differential, (the US 10 year rate has increased from 2.35% to 2.62% and the three year rate has increased from 1.95% to 2.17%).
In response to this lower starting point for the USD and the expected impact on business investment from the accelerated depreciation allowances in the US tax package we have raised our forecast for growth in the US economy to 2.5% from 2.2% in 2018.
Lower tax rates; a lower USD; and a subsequent 6% lift in the US share market have markedly eased financial conditions (despite higher bond rates) clearing the way for a FED rate hike in March.
We now see the profile for the FED as 3x25 basis point hikes in March; June; and September.
That would lift the Federal Funds rate to 2.125% by September, comfortably above "zero real" and an appropriate point to pause.
We retain our target of 3% for the 10 year US bond rate while recognising upside risks given the higher profile for the FED.
The "puzzle" as to why the USD has weakened despite widening rate differentials could be explained by concerns around budget deficits associated with the Tax Package or heightened expectations for more aggressive tightening "signals" from ECB and BOJ; or the "over shoot" of around 9% in the USD Index through 2015 in anticipation of the FED's first rate hike. (The USD INDEX has subsequently lost all its gains from 2015 and now sits near its end 2014 level before the market's excitement about FED tightening).
Relative market confidence in the US has also lifted in the last month with the S&P 500 rising by around 6% compared to 3.3% for the Europe Index.
Our current preference is to look through these explanations, and assess the current weakness in the USD to be unsustainable.
Accordingly, associated with the upward revision to the FED profile and the much lower starting point for the USD that we saw in mid-December we are now expecting a 7% lift in the USD Index over the course of 2018, (compared to the 5.5% we envisaged in mid- December).
The rise in the AUD from USD 0.765 to USD 0.807 since mid- December can be largely attributed to the fall in the USD (most models attribute around 70% of the increase in the AUD/USD to USD weakness).
Other factors supporting that AUD outperformance are a 4.5% lift in Australia's Commodity Price Index and a more positive assessment of Australia's economic outlook with associated more hawkish outlook for the RBA's policy rate.
In that regard Westpac retains its call for the RBA to remain on hold through 2018 while we retain our "end 2018" level forecast for the Commodity Price Index, indicating a circa 20% fall.
It should also be noted that markets are anticipating that the yield differential between Australian overnight rates and US rates will be around - 28 basis points by end 2018 whereas Westpac expects a differential of - 62 basis points.
Markets have come a long way from six months ago when they were predicting that the yield differential by end 2018 would be +35 basis points compared to Westpac's forecast at the time of - 38 basis points (not far from the market's current - 28 basis points).
At that time (mid 2017) we were comfortable to forecast eventual contraction in the AUD/USD 10 year bond spread to zero (from the prevailing 55 basis points) by end 2018. However that was when we expected the short end margin at - 38 basis points. With that expected margin now increasing to - 62 basis points we have to recognise that the spread will go negative in the second half of 2018.
In mid-December we expected an 8.5% fall in the AUD through 2018 to reflect a stronger USD; a benign RBA; and that 20% fall in Commodity Prices.
With the bigger increase (7% vs 5%) in the USD now expected and RBA and Commodity Price views unchanged we now expect a larger fall in AUD/USD (10%) than was the case in mid December.
However with the starting point much higher (USD0.807 vs USD 0.765) our revised target for AUD/USD by end 2018 is now USD 0.72. That "new" level for the AUD by year's end would be consistent with an NZD/USD level of USD0.65.
The week that was
The past week has been a quiet one for Australian data, the only release of significance being the Westpac-MI leading index. That said, there has been plenty to fill the headlines, with the Q4 New Zealand CPI; Bank of Japan; and President Trump's trade agenda all in focus.
First, for the Westpac-MI Leading Index, the December outcome was strong at +1.41%, pointing to above-trend growth in early 2018. Almost all of the inputs were positive in the month, except hours worked. Of particular note were the contributions provided by commodity prices (benefiting from global growth and US dollar weakness); dwelling approvals (which have surged) and consumer sentiment (currently in an upswing following a soft 2017). Despite this strong growth signal, we remain of the view that negatives around housing; household incomes and consumers' willingness to spend will restrict the growth upswing and see aggregate momentum hold below trend in 2018.
Turning then to inflation, this week saw the release of New Zealand's Q4 CPI. Our New Zealand team and the market had anticipated that strength in fuel prices and other transport costs would see a quarterly gain of 0.4%, leaving annual inflation at 1.9%yr - just below the mid-point of the RBNZ's inflation target range. While strength in transport costs was seen, it was largely offset by widespread weakness in tradeable goods prices, the result of strength in the New Zealand dollar. Our New Zealand team also note that there was potentially a one-off factor in the mix as well, a 6% drop in new car prices that may have been due to an extension of coverage as part of the three-year re-weighting that took effect this quarter (as well as New Zealand dollar strength). Non-tradeable prices were largely as expected at 0.5%, buoyed by rents and new dwelling prices.
Coming a week before the release of the Australian CPI, the New Zealand CPI outcome has additional significance. Weakness in tradeables inflation has been a recurring feature of the Australian inflation story through 2017, and the above New Zealand outcome signals this may again be the case in Q4. Our forecast for the Australian headline CPI stands at 0.8%, 2.1%yr. The degree of risk to this figure from tradeables inflation is likely in the order of 0.2ppts - the average disappointment versus the market forecast in recent quarters. Unlike New Zealand, rents and house purchase costs are losing momentum in Australia, resulting in a soft pulse for core or underlying inflation. We see the average of the RBA core measures at 0.5% in Q4, leaving the annual gain little changed at 2.0%yr. All of the detail behind our forecasts is contained in our CPI preview by Justin Smirk, but the take home point is simple. On both a headline and core basis, inflation will remain at the bottom of the RBA's target range for the foreseeable future. Further, based off the 2017 experience, the risks to this profile are to the downside.
Moving then to the northern hemisphere, of those watched closely by global markets, the Bank of Japan was the first central bank to meet in 2018. Their latest outlook released after the January meeting took a cautious approach to communication. At the margin, the forecasts for growth and inflation point to a further erosion of downside risks; however, the unchanged median forecasts imply no significant change in their solid (but hardly strong) expectations. Activity growth is expected to slow from 1.9%yr in fiscal 2017 to 1.4%yr in 2018 and then to 0.7%yr in 2019. Inflation is also set to remain below target, at 0.8%yr in fiscal 2017; 1.4%yr in 2018 and 1.8%yr in 2019 (excluding the 2019 consumption tax hike). Those anticipating a material shift in policy in the near term are therefore likely to be disappointed. That said, there is cause to expect the 10yr JGB yield target to be nudged higher from zero to 0.1% later in 2018; and, if market conditions allow along the way, a further scaling back of asset purchases. This trend in the Bank of Japan asset purchases, combined with an end to those by the ECB at end-2018 and the US FOMC's accelerating balance sheet normalisation, represent a material change in the global monetary policy stance and market liquidity supply through 2018 and into 2019. Careful assessment of G3 central bank intentions will therefore be crucial this year. Note that the ECB meet tonight and the FOMC next week.
On the FOMC, as outlined by Chief Economist Bill Evans, Westpac Economics has revised our US policy expectations for 2018, adding a third hike and bringing forward their timing. We now look for a 25bp hike at each of the March; June and September meetings, taking the fed funds rate to 2.125% (mid-point of range). The primary reason for these revisions is the loosening of financial condition in the US over the past month, principally via a weaker US dollar.
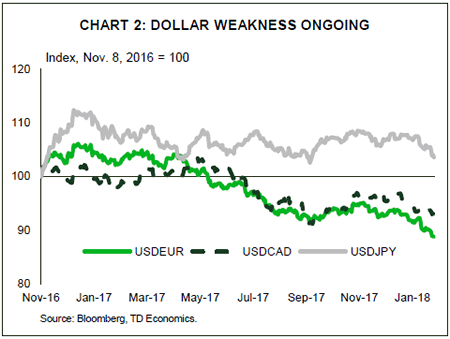
Since the beginning of November 2017, the DXY US dollar index has fallen from almost 95 to near 89 currently ( - 6%) amid strengthening expectations for global growth and Euro Area/ Japanese monetary policy. While expectations for robust global growth are justified, those for a material change in the stance of monetary policy in Europe and Japan are not. Consequently, we still expect a circa 7% rally in the US dollar (DXY) in 2018, but that will still leave its level below our prior profile. For the US dollar, there are considerable risks in both directions. The market response to protectionist comments this week from the Trump administration highlight that, amid a robust global economy, US protectionism is likely to be to the detriment of their currency. Further government shutdowns will also affect confidence negatively. That said, a weaker US dollar and December's tax reform package loom as upside risks for inflation, growth and therefore the stance of monetary policy.
As we have highlighted regularly, the terminal fed funds rate for this cycle will depend on how the stance of monetary policy influences overall financial conditions. Three hikes would see the fed funds rate above neutral and would also be followed by balance sheet normalisation at maximum effect in Q4 2018 and Q1 2019. Financial conditions should therefore tighten materially and weigh on growth. However, if term yields remain suppressed and/or the US dollar fails to rally as we expect, then the current rate hike cycle could have further to run. At this time, this is not our base case.
New Zealand: week ahead & data wrap
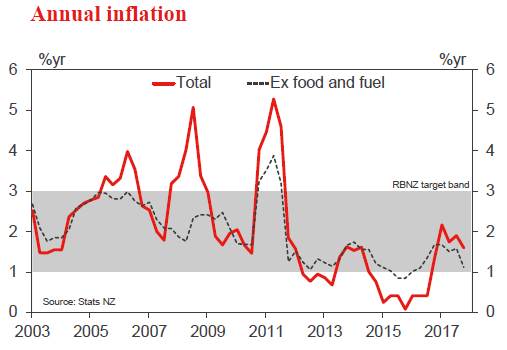
This week's December quarter CPI was the last major piece of data before the RBNZ's February interest rate review. We have been expecting the RBNZ to leave the OCR on hold for a long while, while financial market pricing has been creeping towards interest rate hikes this year. With the exchange rate rising and inflation surprising to the downside this week, our view is looking closer to the mark. We expect that inflation will linger below 2% for some time yet. And with the economy showing signs of slowing, it is hard to see the RBNZ hiking any time soon.
Soft December quarter inflation...
Consumer prices rose by just 0.1% in the December quarter. That was below analysts' and our own forecasts for a 0.4% increase. It was also lower than the Reserve Bank's November forecast for a 0.3% rise. This soft result saw the annual inflation rate dropping back from 1.9% down to 1.6%.
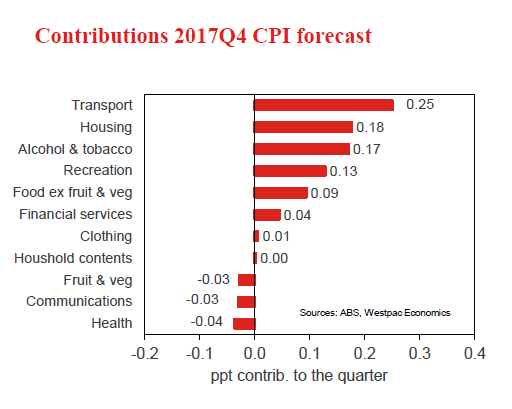
Underlying this softness was widespread weakness in the prices of tradable goods, which are mostly imported. Prices in this group fell by 0.3% over the quarter, with virtually every item with some imported content coming in below our forecasts (the exception was fuel prices, which rose 6%).
There are two possible culprits here. The first is the New Zealand dollar, which strengthened through the middle part of 2017. Exchange rate movements typically affect retail prices with a lag of two to four quarters. It's likely that earlier gains in the New Zealand dollar are still flowing through into retail prices of imported products. That said, the rise in the exchange rate last year wasn't a particularly large or sustained one.
However, the results also suggest a lack of price pressures for internationally-traded goods more generally. Softness in global inflation has puzzled forecasters for many years since the global financial crisis. With the world economy now on a stronger footing, many have been expecting higher inflation to follow - and a few central banks such as the US Federal Reserve have already started to lift interest rates in anticipation.
Yet there is little evidence of that inflation emerging yet. It's true that inflation rates have risen from the near-zero levels that prevailed a couple of years ago, as oil prices have been rising sharply instead of falling. But there is little sign of price pressures spreading to the manufactured goods that New Zealand imports. That's consistent with ongoing reports of strong competitive pressures through the retail sector.
In contrast, the more persistent non-tradables component (which relates mainly to domestically produced goods and services) rose by 0.5%. Rents and new dwelling prices continued their steady rise, and were joined by seasonal increases in domestic airfares, car rentals and accommodation. However, even in these groups, it is notable that annual inflation has failed to break higher over the past year. Annual non-tradables inflation is currently sitting at 2.5% - broadly where it has been for the past 18 months, and still below its long run average.
...continuing into 2018...
We expect some of the softness in December's inflation result will reverse in the early part of this year. Nevertheless, it's looking very likely that inflation will remain below the RBNZ's 2% target midpoint through 2018. While there are signs that the period of very weak global inflation that we saw in recent years is dissipating, we're certainly not in an environment where imported inflation is about to rocket higher. In addition, the continuation of strong competitive pressures in the retail sector means that the domestic prices of imported consumer goods are likely to remain soft for an extended period.
We've also seen the NZD grinding higher since the start of this year, and this week we revised up our forecasts for the NZD/ USD over 2018. This reinforces our expectation for softness in tradables prices over the coming months.
Similarly, the chances of a significant rise in domestic inflation look slim. Recently released GDP figures showed that the New Zealand economy had been growing at a solid pace in recent years, with growth topping out at 4% through 2016. And that wasn't just because of population growth either - per capita growth has also been fairly healthy in recent years. But even with solid domestic activity and rising pressures in the construction sector, we did not see a material lift in non-tradables inflation.
Now, growth has eased off, and recent business sector indicators point to a further softening in activity through the early part of 2018. Combine those conditions with changes in government charges (like reduced costs for tertiary education and doctors' visits), and a strong rise in domestic inflation over the coming year looks like a longshot.
...will keep the RBNZ on the sidelines for some time yet
We are now well past the period of very weak inflation that we saw in the wake of the financial crisis. Nevertheless, inflation remains stubbornly below average. Furthermore, it's looking very doubtful inflation will rise back to 2% in mid-2018 like the RBNZ was expecting at the time of their November Monetary Policy Statement. Coming on top of signs that the momentum in GDP growth is fading, this makes it hard to argue for an OCR hike anytime soon.
Market pricing for an OCR hike edged back a little following the softer than expected CPI result and is consistent with a rate increase in the first quarter of 2019. We still think that is too soon, and maintain our forecast for the OCR to remain on hold until the final quarter of 2019.
Data Previews
Aus Dec CPI
Jan 31, Last: 0.6%, WBC f/c: 0.8%
Mkt f/c: 0.7%, Range: 0.4% to 1.4%
- The September quarter CPI came in broadly as we expected printing 0.6%qtr compared to Westpac's forecast of 0.7%. The market median was 0.8%. The annual rate moderated to 1.8%yr compared to 1.9%yr in Q2 and 2.1% in Q1. The average of the core measures, which are seasonally adjusted and exclude extreme moves, rose just 0.4%qtr and, in annual terms, was flat on Q2 at 1.9%yr.
- With a solid bump up from tobacco, auto fuel & domestic holidays but not much else, Westpac's forecast for the headline CPI is 0.8%qtr lifting the annual pace from 1.8%yr to 2.1%yr. Core inflation is forecast to print 0.5%qtr (0.54% at two decimal places) lifting the annual rate to 2.0%yr. The trimmed mean is forecast to rise 0.52%, while the weighted median forecast is 0.57%.
- See our Q4 CPI Preview for more details on why we see downside risks to this forecast.
Aus Dec private credit
Jan 31, Last: 0.5%, WBC f/c: 0.4%
Mkt f/c: 0.5%, Range: 0.4% to 0.6%
- Credit to the private sector grew by 0.5% in November, a touch above the 0.4% monthly average for 2017.
- For December, we anticipate a rise of 0.4%.
- Housing credit is slowing gradually, a trend that is likely to continue at this late stage of the cycle as the sector responds to tighter lending conditions. The 3 month annualised pace is 5.7% currently, down from 6.8% in March. In November, housing credit grew by 0.44%, 6.4%yr.
- Business credit is volatile month to month around a moderate upward trend as businesses expand investment. The November outcome was an above par increase of 0.7%. For December, we anticipate a result more in line with the 2017 monthly average of 0.3%.
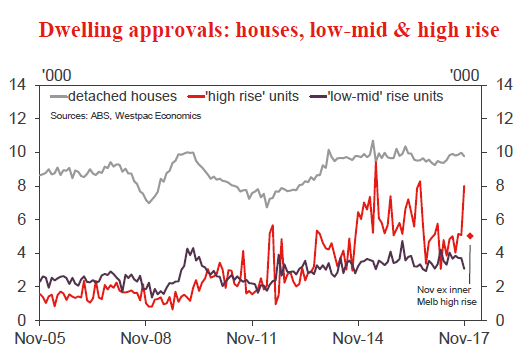
Aus Dec dwelling approvals
Feb 1, Last: 11.7%, WBC f/c: - 8.0%
Mkt f/c: -7.6%, Range: -12.5% to -3.0%
- Dwelling approvals posted a surprise surge in Nov, up 11.7% vs expectations of a decline. The result was driven by an extraordinary spike in Vic high rise approvals that more detailed data shows centred on the CBD, Docklands and Southbank. While not down to one single 'mega project', the spike almost certainly relates to a handful of very large projects in the inner city. Approvals across the rest of Australia were much weaker, down 2.0% in the month following Oct's 8.3% drop.
- There looks to be some residual strength in the Vic market, with site purchases - a reasonable lead indicator for high rise activity - up in 2016-17 but still well below their 2015 peak. That said, Nov high rise approvals were an extreme high well above the state's previous peaks. As such, with conditions softening across other markets and segments, there is a risk of a sharp correction lower in Dec. We expect an 8% pull back, but a double digit monthly fall is plausible.
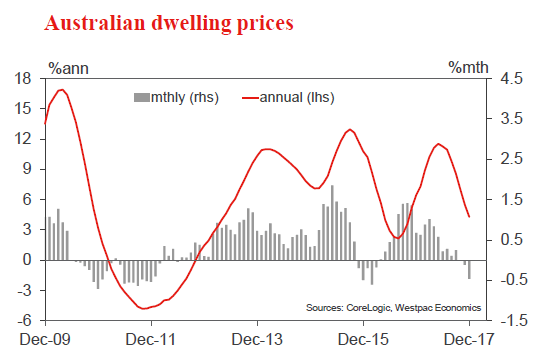
Aus Jan CoreLogic home value index
Feb 1, Last: - 0.5%, WBC f/c: - 0.3%
- Australia's housing market posted a weak finish to 2017, with prices nationally dipping 0.1% in Nov and a further 0.5% in Dec to be down 0.6% over the final quarter, the first negative quarterly result since early 2016. Annual growth slowed to 4.3%yr, an abrupt slowdown on the 11.5% peak in May.
- The daily index points to a further softening in January, with prices down about 0.3% nationally. As always, housing data should be treated with extra caution around the summer holiday low season as light trading means information can be less reliable.
- More generally, early 2018 is shaping as a key test for the market, with 'transitional' impacts from last year's macro prudential tightening set to ease. With weakening foreign buyer demand, downbeat buyer sentiment and surging apartment supply also in the mix, the market's post holiday opening performance will be an important tone setter for 2018.
Aus Q4 import price index
Feb 1, Last: -1.6%, WBC f/c: 3.5%
Mkt f/c: 1.5%, Range: -1.5% to 5.0%
- Prices for imported goods were little changed over the past year, edging 0.4% lower, notwithstanding a drop of 1.6% in the September quarter.
- Roll forward to the December quarter, import prices likely took a step higher, increasing by a forecast 3.5%.
- The cost of imports rose as the Australian dollar dipped in the final quarter of 2017, a move which has since been reversed. In Q4, the Aussie fell almost 3% to average US76.8¢ and declined by the same magnitude on a TWI basis.
- In addition, the bill for fuel imports rose as global energy prices increased in the period.
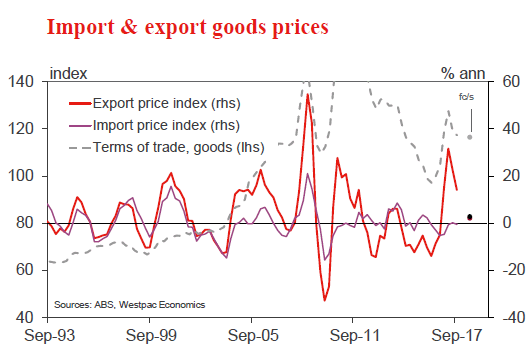
Aus Q4 export price index
Feb 1, Last: - 3.0%, WBC f/c: 2.7%
Mkt f/c: 2.0%, Range: -3.5% to 3.0%
- The sharp rebound in export prices during 2016 and into early 2017 was punctuated by meaningful falls in the June and September quarters (-5.7% and -3.0%), as commodity prices eased back from recent highs.
- In the December quarter, global commodity prices took on a more resilient tone. In the period, the RBA commodity price index increased by 2.9% in AUD terms and was broadly flat in US dollar terms.
- For Q4, we expect export prices to increase by 2.7% and be 2% higher than at the end of 2016.
- The terms of trade for goods, on these estimates, declined by 0.8% in the quarter, to be 2.5% below the level of a year ago.
- As to prices for services, an update will be available with the release of the Balance of Payments on March 6.
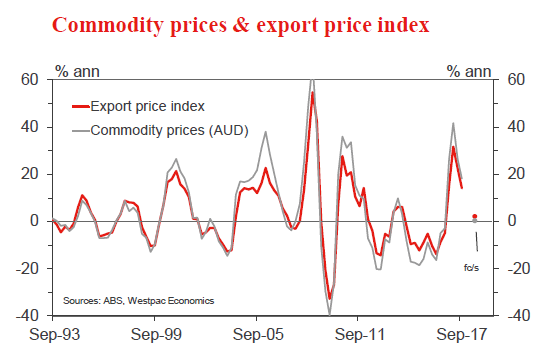
NZ Dec residential building consents
Feb 2, Last: 10.8%, WBC f/c: 2.0%
- Residential consent issuance rebounded in November, rising 10.8% over the month. In part, this strong result reflected some payback following earlier softness.
- Smoothing through recent month-to-month volatility, consent issuance remains at firm levels. We expect a further modest gain of 2% in December. Much of the recent strength in issuance has been centred on Auckland where there continues to be a significant shortfall of housing.
- We expect that the level of residential building activity will remain elevated for some time. However, we continue to expect that building activity will increase at a gradual pace over the next few years. As we've highlighted for some time, rising costs, as well as difficulties sourcing skilled labour and credit are acting as a brake on activity.
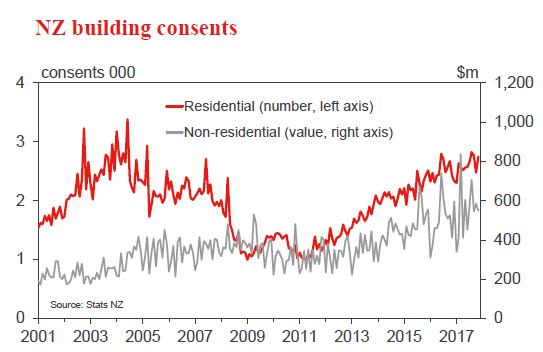
US FOMC Jan policy meeting
Jan 30 - 31, fed funds rate last 1.375%, WBC 1.375%
- Following the BoJ and ECB's meetings last week, this week sees the first meeting of the FOMC for 2018. It will also be Chair Yellen's last
- The January meeting is a simple affair, the decision statement the only method of communication. Since December, a weaker US dollar; little change in term interest rates; and the passing of tax reform all warrant greater short and medium-term optimism over the outlook.
- Due to the above factors, we have revised our expectations for the FOMC.
- We look for 25bp hikes at the March; June and September meetings. At that point, the fed funds rate will be above neutral and the balance sheet unwind in full effect. This will be an appropriate time to pause and assess.
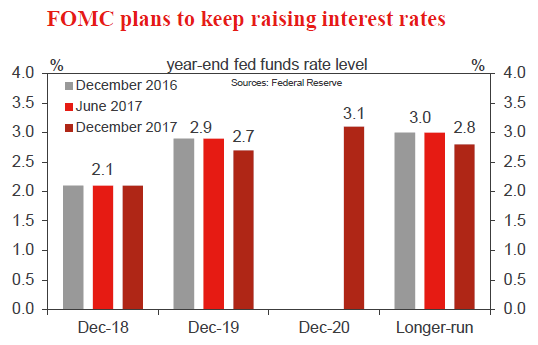
US Jan employment report
Feb 2, nonfarm payrolls, last 146k, WBC 170k
Feb 2, unemployment rate, last 4.1%, WBC 4.1%
- Month to month volatility in nonfarm payrolls remains significant. In the December quarter, gains of 211k and 252k in October and November were followed by a 148k rise in December. The average for the quarter was 204k, a step up from the average of the past six months and 2017 overall.
- We believe this acceleration at end-2017 is noise rather than signal, particularly given the economy is at full employment and the pace of employment growth in 2017 was well ahead of population growth.
- As a consequence, we look for a (still strong) 170k outcome in January. Looking ahead, 2018 is likely to see a further deceleration in employment growth to circa 155k per month, down from around 190k in 2016 and 170k in 2017.
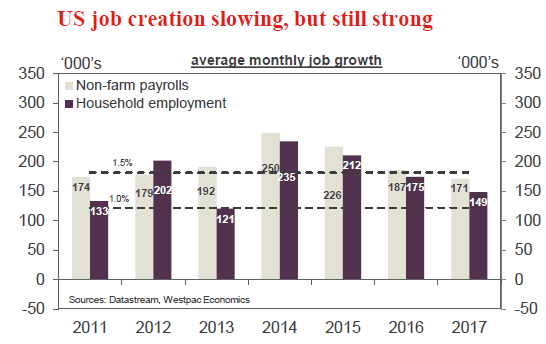
US: Solid Growth Momentum Maintained in Q4
For the third consecutive quarter, U.S. GDP registered a materially higher rate of growth as compared to the expansion average. The breadth of strength is supportive to our outlook for 3 percent GDP growth in 2018.
2017 Ends on a Solid Note
The first look at fourth quarter U.S. real GDP maintained a healthy, abovetrend annualized rate of growth at 2.6 percent (2.3 percent for full year 2017). Admittedly below expectations, the miss was primarily due to the drags from trade and inventories, not from a reduction in consumer or business demand.
Looking at the components, the fourth quarter's strength was clearly driven by the private sector. Real consumer spending increased at a 3.8 percent annual pace in Q4, coming close to doubling the rate seen in Q3 and consistent with the strength of spending seen during the holiday shopping season. Business fixed investment was also a strong contributor, rising 7.9 percent on the quarter. In particular, accelerated strength in business equipment investment extended for the third straight quarter, rising at a strong 11.4 percent annual pace. Our favorite measure of private sector demand, real final sales to domestic purchasers (GDP less inventories, trade and government spending) increased at a 4.6 percent annual rate, more than double Q3's pace and its fastest pace since Q2-2014. Residential construction and government spending were also contributors to overall growth, with residential adding for the first time in three quarters.
Tempering fourth quarter's performance were the collective outsized drags from trade and inventories. On the trade front, improving domestic demand led imports to a robust 13.9 percent gain, more than double the solid 6.9 percent rise in exports. On net, trade subtracted 1.1 percentage points from overall growth in Q4. Inventories nearly reversed its Q3 contribution, subtracting 0.7 percentage points as firms continue to balance shelf content with the pace of sales. Recent survey data have been signaling a pick-up in orders, delays in delivery times and not enough inventories at suppliers. This suggests there is scope for inventories to grow at a steady pace in 2018.
2018 Begins With Promise of More to Come
With the fourth quarter GDP growth performance maintaining an abovetrend pace, we remain confident in our 2018 U.S. real GDP growth call of 3.0 percent. That's roughly half of a percentage point faster than the expansion average. The strength of private sector demand appears resilient given both the performance of both soft (sentiment surveys) and hard data (sales and orders). Businesses and consumers continue to view their individual situations and the broader economic outlook with "glass half full" perspectives, and when combined with the passage of tax reform, the balance of risk to the outlook may be tilted to the upside. A new Fed leadership regime takes the helm at next week's FOMC meeting, and investors are eagerly awaiting any changes to the assessment of the U.S. economy and the progress towards achieving monetary policy goals. The Q4 GDP performance does little to alter expectations for a March Fed rate hike.
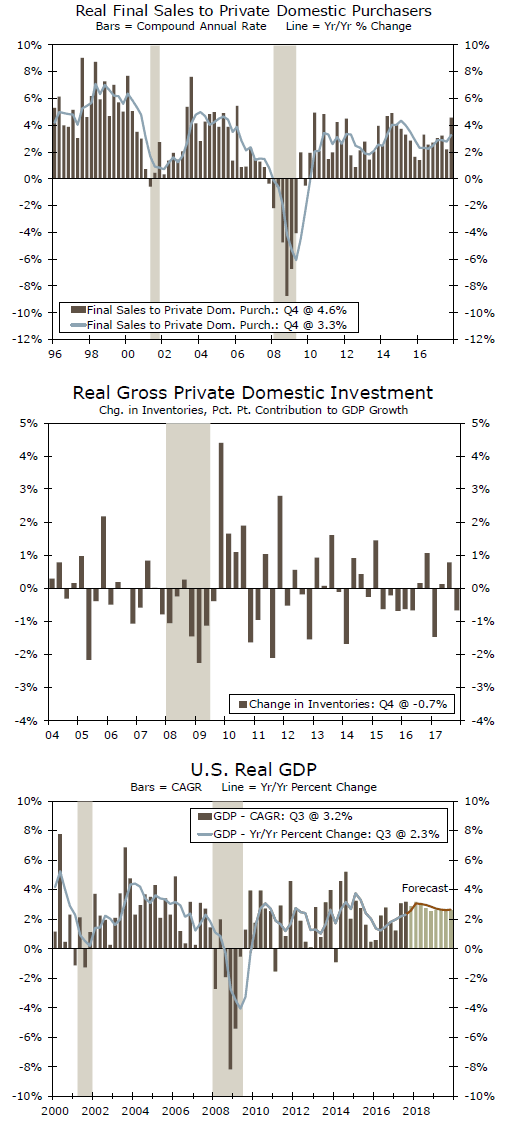
Weekly Focus: The End of the Yellen Era
Market Movers ahead
- We do not expect the Fed to change rates on Wednesday, nor any major change to its statement, as the market has priced in three hikes this year already in line with the Fed's rate expectations.
- We expect the US employment to continue to show gains in Friday's non-farm payroll report, but hourly earnings are the key focus, where upside could add fuel to the global reflation theme.
- We expect another strong eurozone GDP reading for Q4 17, due to be released on Tuesday.
- We think the China PMI release for January will show a small fall, although staying at robust levels.
Global macro and market themes
- Risk sentiment off to a strong start supported by strong fundamentals.
- Strong data out of the US and euro area.
- USD weakening has further to go.
- Bond yields set to move higher in the medium term.
- Trump has made his first move on protectionism - more will come.
Sunset Market Commentary
Markets
Core yields remained on an upward trajectory today. The ECB yesterday indicated that the economy is strong. This might lead the bank to reduce policy stimulation in a not that distant future. The global positive economic momentum and a favourable risk sentiment continue to block any meaningful rebound of US and European bonds. At the same time, technical factors stay also in play. There is probably a 'real trigger' needed for yields to break beyond key levels (10-y US 2.65%/10-y Germany 0.62%). This news didn't come today . President Trump's speech was neutral for markets. US data (Q4 GDP, orders data) were OK, but they also didn't provide the trigger to force an outright break. US yields rose between 1.5 bp (30-y) and 3.5bp (5-year), the belly of the curve underperforming. The US 2-year yield surpassed the 2.10% barrier. The German yield curve showed a similar picture. 5-year rose 2.8bp. The longer end outperformed with the 30-y declining 2.2 bp.
The dollar entered calmer waters this morning after wild intraday swings yesterday during the ECB press conference and on comments of US president Trump. Trump subscribing the US strong dollar policy eased the USD sell-off as markets looked for guidance from key US eco data and another address of president Trump at the WEF in Davos this afternoon. Contrary to yesterday, the news from Davos and the US data were not able to provide clear guidance for (FX) trading. President Trump gave a 'generalist' speech on his 'America first' approach, but didn't address specific issues on international trade or the dollar. The US data were OK. US Q4 for growth printed at 2.6% Q/Qa (vs 3.0% expected). Consumption and investment were strong. Foreign trade and inventories weighed on growth. The market reaction to the data was limited/mixed. EUR/USD trades around 1.2440. USD/JPY struggles to hold north off 109. So, the dollar decline has halted, but the jury is still out whether this is the start of a sustained bottoming out process. USD/JPY looks more fragile than USD/EUR.
EUR/GBP started European trading in the 0.8750 area after a rebound off the 0.8690 support yesterday. The UK Q4 growth printed at 0.5% Q/Q versus expectations of only 0.4%, but ONS said that growth was uneven. BoE governor Carney indicated that the UK economy could stop lagging behind global growth later this year as there is clarity on the relationship with the EU. The positive comments from the BoE and better growth data reinstalled a bid for sterling. EUR/GBP turned (slightly) back south in the 0.87 big figure (currently 0.8735/40). Cable rebounded above 1.42. However, for now a retest of yesterday's sterling peaks against the euro and the dollar hasn't occurred yet.
News Headlines
UK growth picked up in the fourth quarter of last year, rising by 0.5 % Q/Q. Consensus expected only 0.4% growth. However, the ONS said the big picture remained one of a slower and more uneven expansion. In 2017 as a whole, growth was 1.8% compared with 1.9% in 2016.
ECB's Benoit Coeure said at the WEF in Davos that "The last thing the world needs today is a currency war…we live in a world where exchange rates are not and should not be targeted for competitive purposes."
Germany's main rival parties will aim to wrap up coalition talks for new government Feb. 4, without setting a fixed deadline, a spokesman for Germany's Social Democrats says.
US eco data were OK but didn't bring any really big surprise. US Q4 growth printed at 2.6% Q/Qa (vs 3.0% expected). Consumption and investment were strong suggesting a good start of 2018. Net exports and inventories weighed on growth. December durable goods orders grew a strong 2.9% M/M. Shipments of capital goods were also strong suggesting a positive momentum of investment. The goods trade deficit widened to $71.6 bln, the widest since 2008.