Sample Category Title
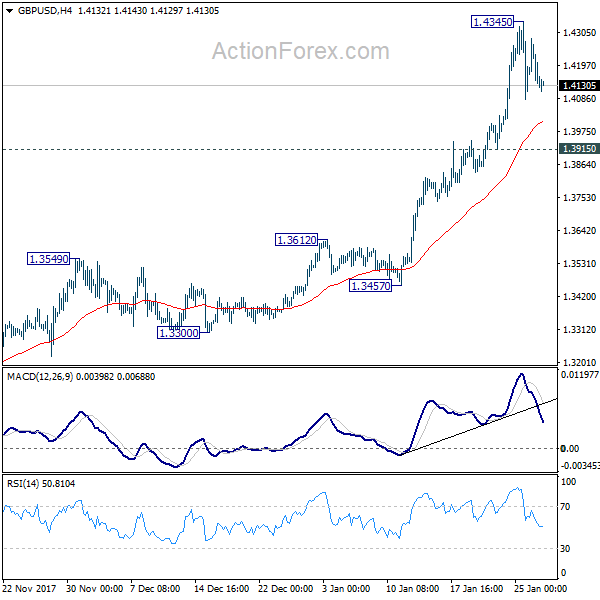
GBP/USD Daily Outlook
Daily Pivots: (S1) 1.4079; (P) 1.4180; (R1) 1.4256; More.....
Intraday bias in GBP.USD remains neutral for consolidation below 1.4345 temporary top. Downside of retreat should be contained by 1.3915 support to bring rally resumption. On the upside, break of 1.435 will extend the up trend to 100% projection of 1.2108 to 1.3651 from 1.3038 at 1.4581 next.
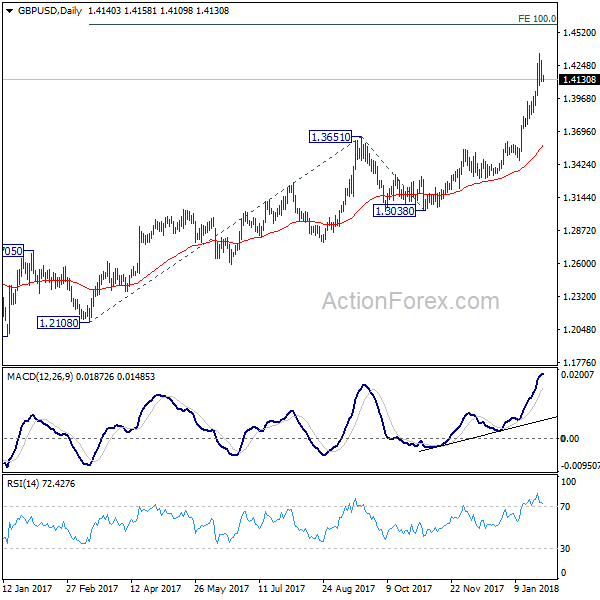
In the bigger picture, sustained break of 1.3835 key resistance level indicates that rebound from 1.1946 is at least correcting the long term down from from 2007 high at 2.1161. Further rise should now be seen back to 38.2% retracement of 2.1161 (2007 high) to 1.1946 (2016 low) at 1.5466. Medium term outlook will stay bullish as long as 1.3038 support holds, in case of pull back.
Canada’s Annual Inflation Cooled As Anticipated In December
For the 24 hours to 23:00 GMT, the USD declined 0.54% against the CAD and closed at 1.2321 on Friday.
On the economic front, Canada's consumer price index (CPI) climbed 1.9% on an annual basis in December, in line with market expectations and compared to an advance of 2.1% in the prior month.
In the Asian session, at GMT0400, the pair is trading at 1.2331, with the USD trading 0.08% higher against the CAD from Friday's close.
The pair is expected to find support at 1.2296, and a fall through could take it to the next support level of 1.2260. The pair is expected to find its first resistance at 1.2364, and a rise through could take it to the next resistance level of 1.2396.
The currency pair is trading above its 20 Hr moving average and showing convergence with its 50 Hr moving average.

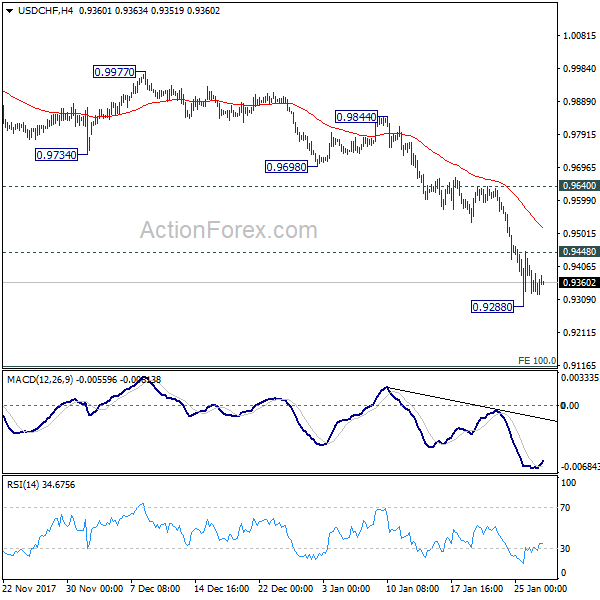
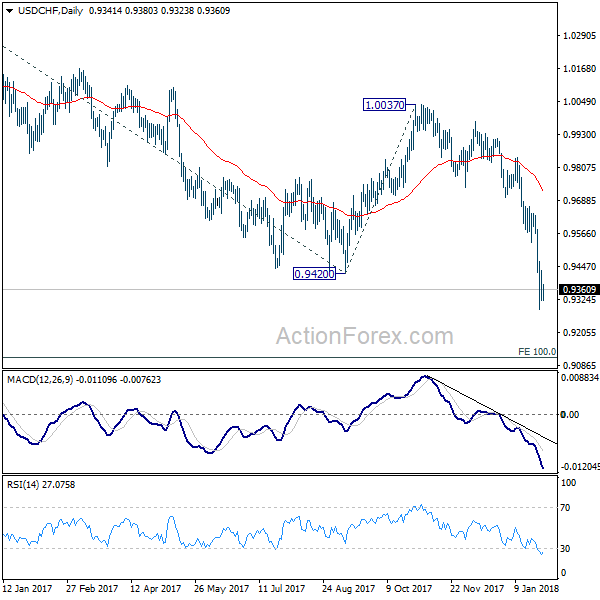
USD/CHF Daily Outlook
Daily Pivots: (S1) 0.9295; (P) 0.9360; (R1) 0.9397; More...
Intraday bias in USD/CHF remains on the downside for the moment. Deeper fall could be seen to next key fibonacci level at 0.9115. On the upside, above 0.9448 will turn bias neutral and bring consolidations. But outlook will remain bearish as long as 0.9640 resistance holds.
In the bigger picture, the strong break of 0.9420 support suggests that fall from 1.0342 is developing into a medium term down trend. Deeper fall should be seen to 100% projection of 1.0342 to 0.9420 from 1.0037 at 0.9115. Break will target 161.8% projection at 08545. In any case, break of 0.9640 resistance is needed to be the first sign of medium term bottoming. Otherwise, outlook will stay bearish even in case of strong rebound.
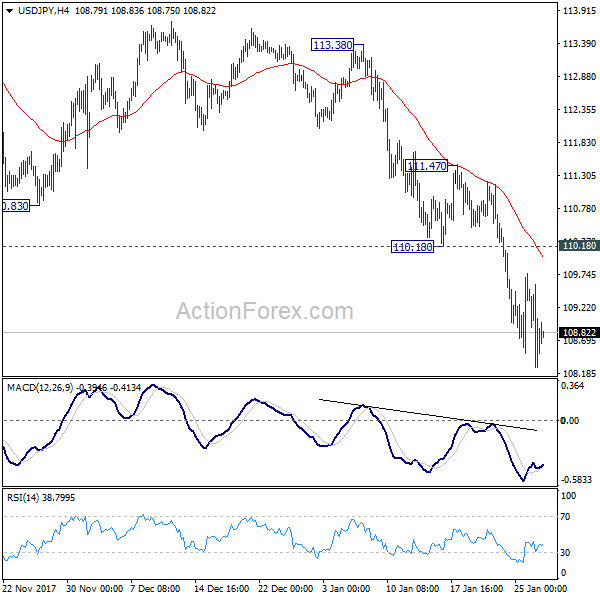
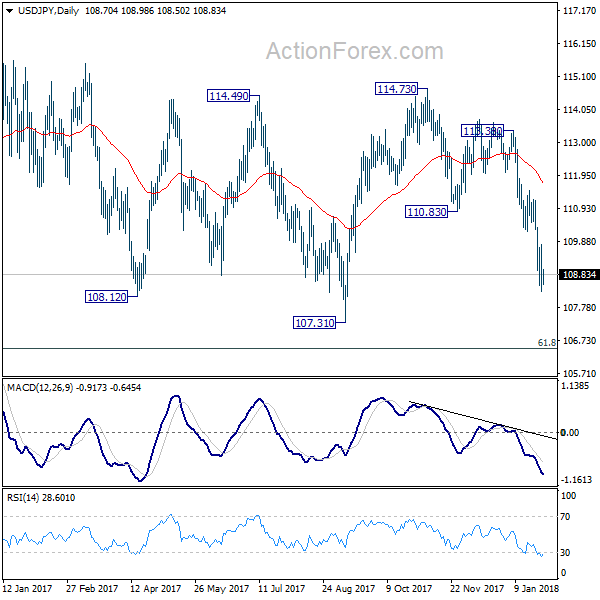
USD/JPY Daily Outlook
Daily Pivots: (S1) 108.01; (P) 108.88; (R1) 109.49; More...
Intraday bias in USD/JPY remain son the downside at this point. Current decline is is part of the pattern from 118.65. It's expected to extend through 107.31 support to next fibonacci support at 106.48. Nonetheless, break of 110.18 will be the first sign of near term reversal and will turn bias back to the upside for 111.47 resistance.
In the bigger picture, current development argues that the corrective pattern from 118.65 is extending. There is risk of dropping further to 61.8% retracement of 98.97 to 118.65 at 106.48. But this level should provide strong support to contain downside and bring resumption of rise from 98.97. However, sustained break of 106.48 will now likely send USD/JPY through 98.97 to resume the corrective fall from 125.85 (2015 high).
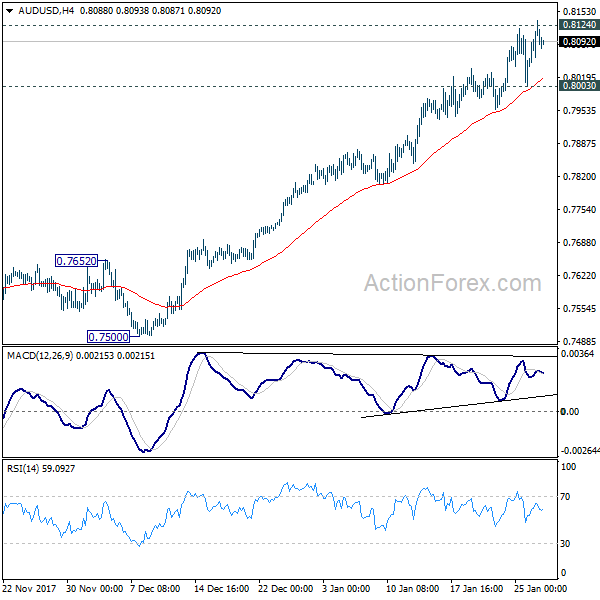
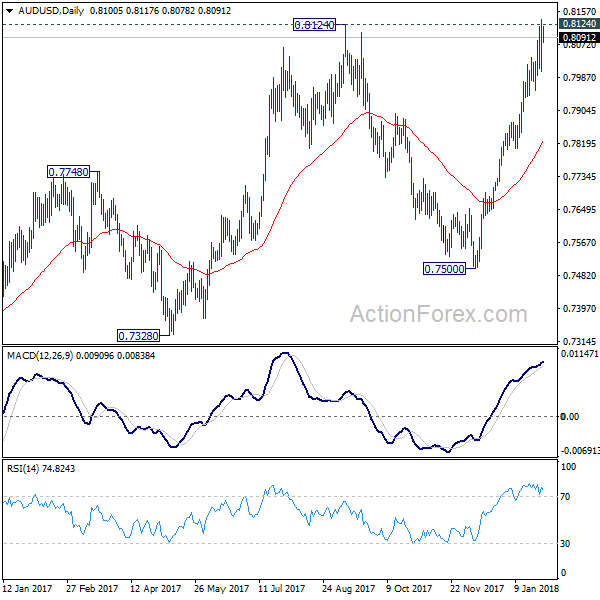
AUD/USD Daily Outlook
Daily Pivots: (S1) 0.8029; (P) 0.8082; (R1) 0.8161; More...
With 0.8003 minor support intact, intraday bias in AUD/USD remains on the upside. Sustained break of 0.8124 resistance will resume whole medium term rebound from 0.6826 and target key fibonacci level at 0.8451. Meanwhile, on the downside, break of 0.8003 support will indicate short term topping, likely with bearish divergence condition in 4 hour MACD. And in such case, intraday bias will be turned back to the downside for 55 day EMA (now at 0.7827).
In the bigger picture, current development suggests that medium term rebound from 0.6826 is still in progress and could be resuming. Such rise could target 38.2% retracement of 1.1079 (2011 high) to 0.6826 (2016 low) at 0.8451. As such rise is seen as a corrective move, we'd expect strong resistance from 0.8451 to limit upside and bring reversal.
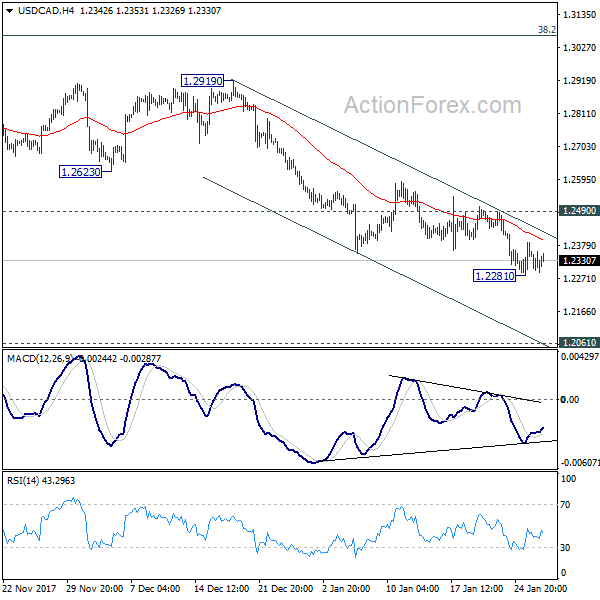
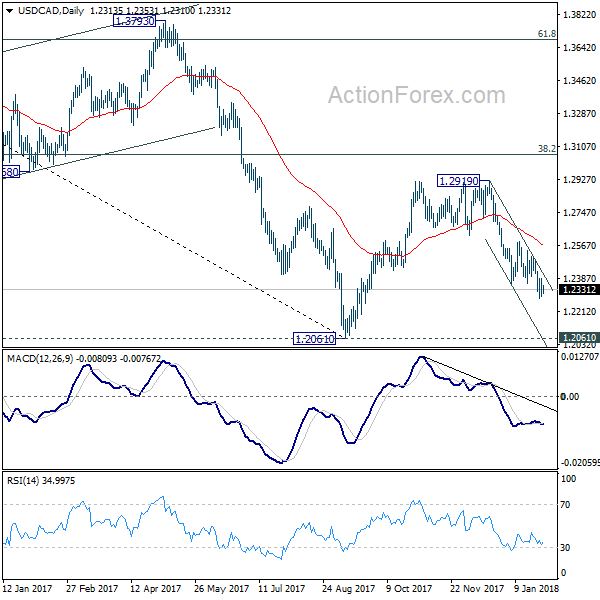
USD/CAD Daily Outlook
Daily Pivots: (S1) 1.2271; (P) 1.2331; (R1) 1.2371; More...
Intraday bias in USD/CAD remains neutral for consolidation above 1.2281 temporary low. Near term outlook will remain bearish as long as 1.2490 resistance holds. Below 1.2281 will extend the decline from 1.2919 and target a test on 1.2061 low. However, considering bullish convergence condition in 4 hour MACD, break of 1.2490 will indicate short term bottoming and bring stronger rebound.
In the bigger picture, rebound from 1.2061 is likely completed completed at 1.2919, rejected by 55 week EMA and kept below 38.2% retracement of 1.4689 to 1.2061 at 1.3065. The development also suggests that long term fall from 1.4689 is not completed yet. Decisive break of 1.2061 low will target 61.8% retracement of 0.9406 to 1.4689 at 1.1424. This will now be the favored case as long as 1.2919 resistance holds.
Markets Steady ahead of an Extremely Busy Week, Dollar Recovers But Not Reversing
The forex markets are pretty steady in Asian session today as markets are preparing for an extremely busy week ahead. Dollar is trying to recovery. While the greenback is trading broadly higher, it's kept in Friday's range. There is no realistic sign of short term bottoming yet. There are countless important data to be released this week, including PCE, ISM and NFP from the US. FOMC is also expected to deliver a hawkish twist to prepare the markets for March hike. But US President Donald Trump's tone regarding Dollar in the State of Union address could be the trend defining moment.
NAFTA negotiation to continue with an air of optimism
It's reported that Trump will not announce withdrawal from the NAFTA during his State of Union address on Tuesday. Some US representatives expressed optimism on a deal during the weekend. Republican Dave Reichert said "there's just an air of optimism". He pointed out that "they're already talking about additional rounds, where not too long ago, we were wondering whether or not there would be continued negotiations." Meanwhile it's reported that the NAFTA negotiation will extend deeper into 2018, probably beyond the presidential election in Mexico in July.
ECB Knot: There is no reason whatsoever to continue with QE after September
ECB Governing Council member Klass Knot delivered some hawkish comments over the weekend. He said "there is no reason whatsoever to continue" the EUR 30b a month asset purchase program after it ends in September. He added "we don't have to communicate yet that it will be over after September, but I think that's where we're headed." Meanwhile, interest rates would stay low in the coming years. Knot noted that "Interest is mainly low because there are more people that want to save, than that want to invest. This will change as the economy grows, but that will take time."
EU to formally demand UK for unconditional legal compliance during transition
EU's Brexit negotiator Michel Barnier might formally adopt the instructions today that UK must apply EU laws as if it were a member state during the transition period. And such compliance is expected to be unconditional. On the other hand, the UK is clearly uncomfortable with the demand. Brexit secretary David Davis hinted that he would demand the power to object. As Davis said, "means to remedy issues" are needed if laws were "deemed to run contrary to our interests". But some EU officials see the UK's position on it being counter productive, in particular as Prime Minister Theresa May is targeting to complete a transition deal in March, as businesses requested.
FOMC to highlight an extremely busy week
Janet Yellen's last FOMC meeting as Fed chair is the main highlight of an extremely busy week. Fed is widely expected to keep federal funds rates unchanged at 1.25-1.50%. But some economists are expecting a hawkish twist in the statement to pave the way for a March rate hike. Trump's State of Union address on Tuesday will also be closely watched. In addition, there are countless important data to be featured. Here are some highlights for the week ahead:
- Monday: Germany import prices; US personal income and spending
- Tuesday: New Zealand trade balance; Australia NAB business confidence; Japan household spending, unemployment rate, retail sales; French GDP; German CPI; Eurozone GDP; Swiss trade balance, KOF; UK M4, mortgage approvals; US S&P Case-Shiller house price, consumer confidence
- Wednesday: BoJ summery of opinions, Japan industrial production; UK Gfk consumer confidence; Australia CPI; China PMIs; Japan consumer confidence, housing starts; Swiss UBS consumption indicator; German retail sales, unemployment; Eurozone CPI, unemployment rate; US ADP job, employment cost index, pending home sales, Chicago PMI, FOM rate decision; Canada GDP, RMPI and IPPI
- Thursday: Australia building approvals, import prices; China Caixin PMI manufacturing; Swiss SECO consumer climate, retail sales, PMI; Eurozone PMI manufacturing revision; UK PMI manufacturing; US Challenger job cuts, non-farm productivity, jobless claims; ISM manufacturing, construction spending
- Friday: New Zealand building approval; Japan monetary base; Australia PPI; UK construction PMI; Eurozone PPI; US non-farm payrolls, factory orders
USD/CAD Daily Outlook
Daily Pivots: (S1) 1.2271; (P) 1.2331; (R1) 1.2371; More...
Intraday bias in USD/CAD remains neutral for consolidation above 1.2281 temporary low. Near term outlook will remain bearish as long as 1.2490 resistance holds. Below 1.2281 will extend the decline from 1.2919 and target a test on 1.2061 low. However, considering bullish convergence condition in 4 hour MACD, break of 1.2490 will indicate short term bottoming and bring stronger rebound.
In the bigger picture, rebound from 1.2061 is likely completed completed at 1.2919, rejected by 55 week EMA and kept below 38.2% retracement of 1.4689 to 1.2061 at 1.3065. The development also suggests that long term fall from 1.4689 is not completed yet. Decisive break of 1.2061 low will target 61.8% retracement of 0.9406 to 1.4689 at 1.1424. This will now be the favored case as long as 1.2919 resistance holds.
Economic Indicators Update
| GMT | Ccy | Events | Actual | Forecast | Previous | Revised |
|---|---|---|---|---|---|---|
| 07:00 | EUR | German Import Price Index M/M Dec | 0.20% | 0.80% | ||
| 13:30 | USD | Personal Income Dec | 0.30% | 0.30% | ||
| 13:30 | USD | Personal Spending Dec | 0.40% | 0.60% | ||
| 13:30 | USD | PCE Deflator M/M Dec | 0.10% | 0.20% | ||
| 13:30 | USD | PCE Deflator Y/Y Dec | 1.70% | 1.80% | ||
| 13:30 | USD | PCE Core M/M Dec | 0.20% | 0.10% | ||
| 13:30 | USD | PCE Core Y/Y Dec | 1.50% | 1.50% |
EUR/USD Remains Buy On Dips Near 1.2320
Key Highlights
- The Euro gained heavily this past week and traded a few pips above 1.2500 against the US Dollar.
- There is a major bullish trend line forming with current support at 1.2320 on the 4-hours chart of EUR/USD.
- The pair is currently correcting lower, but it remains supported above 1.2280 and 1.2320.
- The US Personal Income figures for Dec 2017 will be released today, forecast +0.3% versus previous +0.3%.
EUR/USD Technical Analysis
The Euro started a nasty upside move this past week and traded higher by more than 200 pips. The EUR/USD pair even traded above 1.2500 before starting a downside correction.
During the upside move, the pair broke a few important resistance levels such as 1.2320, 1.2400 and 1.2480. It traded as high as 1.2537 before a downside correction was initiated.
The pair traded below the 23.6% Fib retracement level of the last wave from the 1.2223 low to 1.2537 high. The downside correction was sharp as the pair failed to hold the 1.2400 support area.
It tested the 50% Fib retracement level of the last wave from the 1.2223 low to 1.2537 high. At the moment, the pair is trading around the 1.2400 level and is moving in a range.
On the downside, there is a major bullish trend line forming with current support at 1.2320 on the 4-hours chart of EUR/USD. The trend line support is significant above 1.2300 since the 1.2300-1.2320 area was a resistance earlier and now it is likely to prevent declines.
An intermediate support is around the 61.8% Fib retracement level of the last wave from the 1.2223 low to 1.2537 high at 1.2343. As long as the pair is above the 1.2320 and 1.2300 support levels, it remains in an uptrend.
On the upside, an initial resistance is at 1.2450 followed by the 1.2500 level. Overall, the US Dollar is under a lot of pressure since USD/JPY traded below the 110.00 support and it remains at a risk of more declines in the near term.
Market Morning Briefing: Dollar-Yen Continues To Stay Below 109
STOCKS
Dow (26616.71, +0.85%) continues to move up and could be headed towards 27000 or higher in the near term. Dow looks bullish.
Dax (13340.17, +0.31%) has come off sharply from levels near 13700 and while below 1340, downside scope is open towards 13000.
Nikkei (23749.33, +0.50%) is almost stable near current levels. But Dollar Yen on the other hand may test support near current levels of 108.80 or slightly lower and could bounce back towards higher levels of 109-110 in the coming sessions. That if seen, could prove to be bullish for Nikkei back towards 24000-24200 levels. We need to wait and watch for further confirmation.
Shanghai (3552.05, -0.17%) has also come off from 3588 and may trade within 3600-3525 region for the coming sessions. Near term looks range-bound.
Nifty (11069.65, -0.15%) and Sensex (36050.44, -0.31%) were stable on Thursday, last week. We need to see if the indices are able to move above the recent highs (seen last week) or moves sideways with a possible dip in the coming sessions. We prefer a short dip towards 10900 on Nifty and 35750 on Sensex.
COMMODITIES
Brent (70.43) is looking stable for now. A rise above 71.35 is necessary to continue to move up in the coming sessions. Although while we expect a short dip from current levels, the price movement does not indicate any lack of bullish momentum just now and is poised to move higher in the near term. On the other hand, WTI (66.35) has moved above immediate resistance near 65 last week and 65 may now act as a near term support. WTI looks bullish just now for the coming sessions.
Gold (1348.17) tested 1366 on the upside before coming off sharply from there. Immediate support is visible near 1340 which if holds could keep the price stable within 1340-1370 region for a few sessions before the price moves up towards 1380-1400 in the medium term.
Copper (3.2205) came off below 3.2250 again and is likely to remain within the broad channel levels of 3.1250-3.2500 for the next few sessions.
FOREX
Dollar Index (89.283) might be on course to test support on daily and weekly line charts near 88.5-88.8 this week. On the daily candles, upside for the Dollar Index in the near term looks restricted to 89.5. With a further rise in bond yields (see Interest Rates below), it looks like higher yields are still not impacting the Dollar positively and it would be interesting to see how long this continues.
Euro (1.2401) could find immediate support near 1.24 on the daily candles for now. The ECB kept its rates constant in last Friday’s meeting in face of a robust Euro; however, markets seem to have expected an even more dovish stance, which wasn’t seen, thereby leading to continued strength in Euro. Euro could again test resistance near 1.25 on the weekly line charts if it stays above 1.24.
Dollar-Yen (108.91) continues to stay below 109, impacted by the Bank of Japan chief’s comment that inflation is finally nearing targets, thereby increasing the likelihood for raising of interest rates in future. There is support near 108.5-108.75 on the weekly line charts which should hold for now.
Euro-Yen (134.99) might well target levels near 134.5 if Dollar Yen comes down further to 108.5 and the Euro stays around 1.24. In case there is some weakening in the Euro towards 1.235, Euro-Yen might test support near 134 on the daily candles before moving up.
Pound (1.4117) is currently trading below resistance near 1.42 on the 3 day candles. In case it breaches this resistance again, there is higher resistance near 1.44 on the weekly candles which should hold in this week.
In case Dollar-Rupee (63.60) rises past 63.70, then we can look for 63.80-90. However a rise in the major currencies relative to the Dollar could pull Dollar Rupee down towards 63.40 as well.
INTEREST RATES
US 10 Yr (2.6842%), 30 Yr (2.9324%), 5 Yr (2.4920%) & 2 Yr (2.1283%) are again at record highs as they are seemingly impacted by low GDP numbers in USA.
The volatility in bond yields continues for now, with the 10 Yr- 5Yr spread (0.1922%) just below support on the short term charts and the 30 Yr-10 Yr spread (0.2482%) nearing support near 0.24% on the long term charts. There could be some pause in flattening though from these support levels.
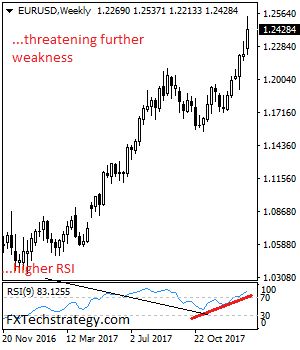
EURUSD – Caps Upside Pressure, Threatens Pullback
EURUSD - The pair may have closed higher the past week but faces corrective pullback in the new week. On the upside, resistance comes in at 1.2450 level with a cut through here opening the door for more upside towards the 1.2500 level. Further up, resistance lies at the 1.2550 level where a break will expose the 1.2600 level. Conversely, support lies at the 1.2400 level where a violation will aim at the 1.2350 level. A break of here will aim at the 1.2300 level. Below here will open the door for more weakness towards the 1.2250. All in all, EURUSD faces further upside move on bullish offensive but with caution