Sample Category Title
Solid 2.6% Increase in U.S. GDP in Q4/17
Highlights:
- US Q3 GDP rose 2.6% - down slightly from the 3% increases in Q2 and Q3 but still a solidly 'above-potential' pace.
- The Fed will likely be encouraged by both the headline growth number and the composition - in particular another solid gain in business investment.
- Our forecast assumes further gradual interest rate hikes from the Federal Reserve will be warranted. We don't expect the Fed to hike next week but look for another 4 increases over the course of 2018.
The 2.6% headline GDP increase was slightly below market expectations for a 3% gain but despite a whopping 4.3% jump in final domestic demand. Household spending accounted for a big chunk of that increase with consumer spending up 3.8% and residential investment jumping almost 12%. Business nonresidential investment also rose solidly, though, at a 6.8% rate. That marked a 7th consecutive quarterly gain in business spending. All of that domestic demand growth drove imports higher by 13.9%. That left net trade subtracting more than a percentage point from headline GDP growth despite a solid 7% increase in exports. Inventories also built at a slower pace, subtracting 0.7 percentage points from headline growth.
The pace of Q4 GDP growth is still well above most estimates of the economy's long-run 'potential' growth rate at a time when the economy is probably already bumping up against capacity limits - and with tax cuts likely to provide at least a modest further lift going forward. The economy looks clearly strong enough to absorb further rate hikes from the Fed. With inflation still tracking below the central bank's 2% objective, though, the pace of tightening is expected to remain gradual. We don't expect a rate hike at next week's FOMC meeting but do expect the Fed will eventually raise the fed funds range by 100 basis points over the course of 2018.
More Modest Firming in Canadian Inflation in December
Highlights:
- Headline CPI inflation eased to 1.9% from 2.1% in November but due almost entirely to a large monthly drop in energy prices.
- Excluding food & energy, year-over-year price growth dipped to 1.7% from 1.8% in November.
- The Bank of Canada's preferred 'core' measures ticked higher, on balance. Both the 'median' and 'trim' measures at 1.9% are essentially in line with the Bank of Canada's 2% inflation target.
Headline CPI growth matched expectations, rising 1.9% from a year ago in December. That was down from 2.1% in November, but almost entirely because of a monthly drop in the volatile energy component. Food price growth continued to tick higher with the year-over-year rate rising to 2.0% in December. Excluding the food & energy components, price growth eased to 1.7% from 1.8% in November but that was still well-above a recent low of 1.2% in September. The Bank of Canada's preferred measures of core inflation ticked higher on balance. Both the CPI-trim and CPI-median measures at 1.9% are effectively right in line with the Bank of Canada's 2% inflation target. The CPI-common is still lower, at 1.6%, but up from 1.5% in November.
Weakness in consumer demand never seemed likely to be behind the absence of more significant inflation pressures last year given rising household spending and debt levels. The firming in underlying price pressures in recent months alongside better wage growth numbers nonetheless should further reassure the Bank of Canada that the economy is indeed now at least close to bumping up against long-run capacity limits. Risks to the outlook remain, particularly around NAFTA renegotiations, but we expect the stronger economy will ultimately warrant further gradual interest rate hikes from the central bank this year.
GBPJPY Stands Near 19-Month High; Bullish Bias Remains
GBPJPY remains in a bullish phase and is trying to hit again the 19-month high of 156.07 resistance level. The price rebounded on the 154.40 support barrier and is creating a bullish movement. The bullish picture in the medium term is further supported by the MACD, which is rising and above its red signal line.
In the 4-hour chart, momentum indicators are pointing to a neutral bias but remain in positive territory, Specifically, the Relative Strength Index (RSI) is flattening, and the MACD oscillator is moving sideways and trying to post a bullish crossover with its trigger line.
If price action remains positive, there is scope to test the aforementioned 19-month high. Clearing this key level could see additional gains towards the significant psychological level of 160.00 taken from the high in June 2016.
If the 154.40 support fails, then the focus could shift to the downside towards the 23.6% Fibonacci retracement level around 154.00 of the up-leg from 146.95 to 156.07. If this level is breached, it could increase downside pressure until the 153.70 support barrier. From here, GBPJPY could be on the path towards the 153.10 low.
USDJPY – Bias Remains Negative after Mixed US Data
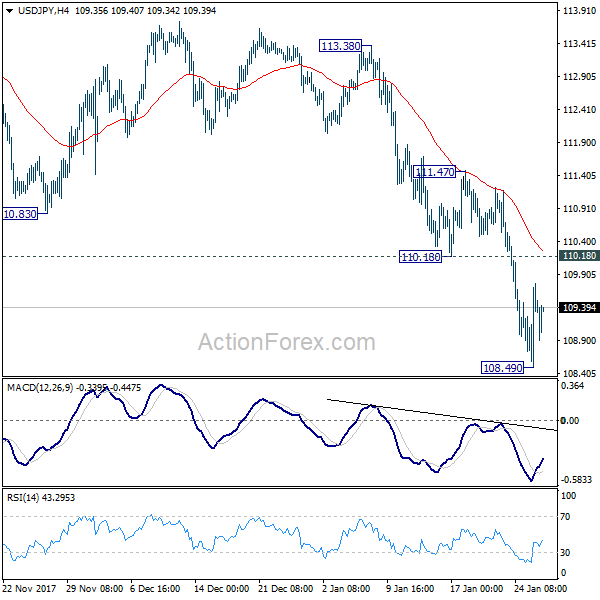
The US dollar moved higher across the board after of US data on Friday showed mixed results. Key event was release of US Q4 GDP which fell below expectations, showing US economic growth slowed in the fourth quarter. GDP increased 2.6% at annual rate, falling below the forecast for 3% growth and Q3 numbers were revised lower to 2.6% from 3.2% initially. On the other side, upbeat Dec US Durable Goods Orders improved negative tone from GDP miss (2.9% in Dec vs 0.8% f/c and upward revised Nov figure from 1.3% to 1.7%). The dollar was also affected by contradictory comments from top US officials in economic forum in Davos this week, as US Treasury Secretary Mnuchin favored weaker dollar as better for the US economy, while US President Trump opposed the statement, preferring stronger US currency, which confused markets and resulted in in increased volatility in the markets on Thursday and Friday. The USDJPY pair stays in the downtrend which accelerated in past three weeks and showing signs of continuation, lacking the catalyst for stronger recovery, as Thursday's unexpected shift from Donald Trump seems to be insufficient to spark stronger recovery, despite extended studies which also warn of correction. Friday's close in red would neutralize existing hopes for stronger recovery action (upside attempts were limited at 109.75 on Thu/Fri), with additional negative signal coming from long red weekly candle (the pair is on track for the third consecutive bearish weekly close). Bears need confirmation on firm break and close below 109.10 (base of thick weekly Ichimoku cloud, which was dented on Thursday's spike to 108.50) to open way for retest of 108.50 and extension towards key m/t support at 107.31 (08 Sep low). To neutralize persisting bearish threats, close above falling 10SMA (110.29) is required.
Res: 109.59; 109.76; 110.00; 110.29
Sup: 108.90; 108.50; 108.26; 108.12
The U.S. Economy Ends 2017 With Solid Momentum
The American economy grew by 2.6% (annualized) in the fourth quarter according to the BEA's advance estimate, slightly below market expectations for a 3% print, but a very solid result nonetheless.
As expected, consumers led the way, as spending rose 3.8%, rebounding from a hurricane-dampened 2.2% pace in the third quarter. Purchases of durable goods were the big story, rising 14.2% driven by strong growth in motor vehicles. The need to replace cars damaged by late summer hurricanes boosted purchases in the fourth quarter. Moreover, non-durable goods spending was also likely boosted by hurricane-related restocking, up 5.2%, while services spending accelerated more modestly to 1.8%.
Business investment had an impressive quarter, up 6.8%. Spending on equipment rose 11.4%, improving on the significant momentum that built through 2017. Growth in intellectual property outlays rose 4.5%, while non-residential structures rose a more modest 1.4%.
Residential investment snapped two-quarters of contraction rising 11.6%. Residential structures were impacted by disruptions related to Hurricanes Harvey and Irma in the third quarter, with activity clearly rebounding in the fourth quarter.
With domestic demand running full tilt, imports also rebounded 13.9%, after two quarters of unexpected weakness. Exports were also up a solid 6.9%, but that wasn't enough to keep net exports from exerting a significant drag on growth. Net exports subtracted 1.1 percentage points from growth as a whole, after adding 0.4 percentage points to real GDP growth in the third quarter.
Inventory investment was also a drag on headline growth, subtracting 0.7 percentage points from the headline figure.
Key Implications
The headlines may read that GDP growth was below expectations in the fourth quarter of 2017, but with final domestic demand up 4.3% in the quarter, it is hard to see any real disappointment in today's report. Smoothing out the quarterly ups and downs, the U.S. economy was running at a healthy 2.5% pace year-on-year to end 2017. This is well-above the economy's potential growth rate (around 2.0%) and is consistent with ongoing declines in the unemployment rate, which at 4.1% is already below its estimated long-run level.
It also shows that the U.S. economy was doing quite well even before the Tax Cuts and Jobs Act came into play. The TCJA is expected to provide a modest boost to the U.S. economy over the next few years. However, with unemployment already so low, it is also likely to spark higher inflation and speed the pace of Fed rate hikes slightly.
The Fed already knew that the economy had healthy momentum to end 2017, but the hard numbers give further comfort and support the case for another rate hike in March.
Canada: Energy Prices Keep Inflation Elevated in December
Consumer prices rose 1.9% year-on-year in December, a modest deceleration from November's 2.1% pace. On a month-on-month basis, prices were up 0.2%.
Price growth was widespread, with seven of eight major categories seeing increases. Telephone services led household operations, furnishings and equipment costs lower, down 0.3% year-on-year, likely a reflection of discounted wireless service plans offered in the month.
Energy prices fell month-on-month, leading year-on-year price growth to 4.5%, from 7.6% in the month prior.
The Bank of Canada's preferred measures of core inflation ticked up again: CPI-common rose a tick to 1.6% year-on-year, with a matching rise in CPI-trim, to 1.9%. CPI-median was unchanged at 1.9%.
Key Implications
Looking past the energy-led deceleration in inflation, hot growth of the Canadian economy in 2017 now appears to be turning into somewhat hotter price growth.
CPI-trim, at 1.9% year-on-year in December, is a far cry from the 1.2% pace seen in the spring months, with the other two Bank of Canada core measures following suit, albeit more modestly. While the Phillip's curve relationship between growth and inflation may not be what it used to be, today's data provides some evidence that it is not yet dead.
The Bank of Canada will likely take comfort both in that the growth-inflation nexus remains intact, and in their decision to increase the key policy rate to 1.25% earlier this month. Risks and uncertainty may result in increased caution, but ultimately, achieving the inflation control target will require further monetary tightening. We remain of the view that the balance of risks versus fundamentals favours the next rate hike falling in July.
Bitcoin Crumbles, Dollar Stumbles While Euro Gains
Unified threats articulated by a chorus of financial heavyweights on cryptocurrency regulations during the Davos conference, have exposed Bitcoin to significant downside risks.
Sentiment towards the cryptocurrency is turning increasingly bearish amid regulation fears, with recent news of a massive exchange in Japan halting client withdrawals further souring investor appetite. In the past, Bitcoin displayed unyielding resilience against a slew of negativity, but now price action suggests that bulls are tired, exhausted and close to waving the white flag. Although the bias towards Bitcoin is currently tilted to the downside, lessons of the past have taught investors how inherently volatile and erratic the cryptocurrency can be.
Focusing on the technical picture, there seems to be a painful struggle for prices to keep above the psychological $10,000 support level. A break below $10,000 may invite a further decline back toward $9000, $8400 and $8000, respectively. Alternatively, bulls need to push prices back above $11,900 to jump back into the game.
Dollar pressured despite Trump remarks
The Dollar found itself under renewed selling pressure during Friday's trading session despite US President Donald Trump stating that he expects the currency to get "stronger and stronger". It seems that comments from Mnuchin stating a weaker Dollar is "good" for American trade, still has a lot of weight and this is reflected in the Dollar's heavily bearish price action.
From a technical standpoint, the Dollar Index remains firmly bearish on the daily charts. A breakdown and daily close below 89.00 could open a clean path towards 88.50 and 88.00, respectively.
Currency spotlight – EURUSD
The Euro punched above 1.2500 during Thursday's trading session after Mario Draghi stated that economic data indicated "solid and broad" growth. Bulls were injected with further inspiration to propel the Euro higher, after Draghi expressed optimism over inflation potentially rising in the medium term.
While concerns were raised over exchange volatility causing some uncertainty which "required monitoring", the overall tone of the ECB meeting remained hawkish-consequently boosting the Euro. From a technical standpoint, the EURUSD remains bullish on the daily charts. A breakout and daily close above 1.2500 could encourage an incline higher towards 1.2560 and 1.2600, respectively. In an alternative scenario, a failure for prices to keep above 1.2500 could trigger a decline back to 1.2440 and 1.2370, respectively.
Commodity spotlight – Gold
A severely depressed US Dollar has strongly supported Gold this week, with the yellow metal currently trading above $1355 during early trading on Friday. The fact that the Dollar remains under pressure, despite Donald Trump recently backing a stronger currency, continues to highlight the lack of buying sentiment. With the Greenback likely to remain on the back foot in the near term, Gold has further upside potential. Taking a look at the technical picture, the yellow metal is heavily bullish on the daily charts. A weekly close above $1360 could invite a further appreciation higher towards $1375.
USD/JPY Mid-Day Outlook
Daily Pivots: (S1) 108.70; (P) 109.19; (R1) 109.90; More...
Intraday bias in USD/JPY remains neutral for consolidation above 108.49 temporary low. At this point, deeper fall is still expected as long as 110.18 support turned resistance holds. Below 108.49 will target next fibonacci support at 106.48. Nonetheless, break of 110.18 will be the first sign of near term reversal and will turn bias back to the upside for 111.47 resistance.
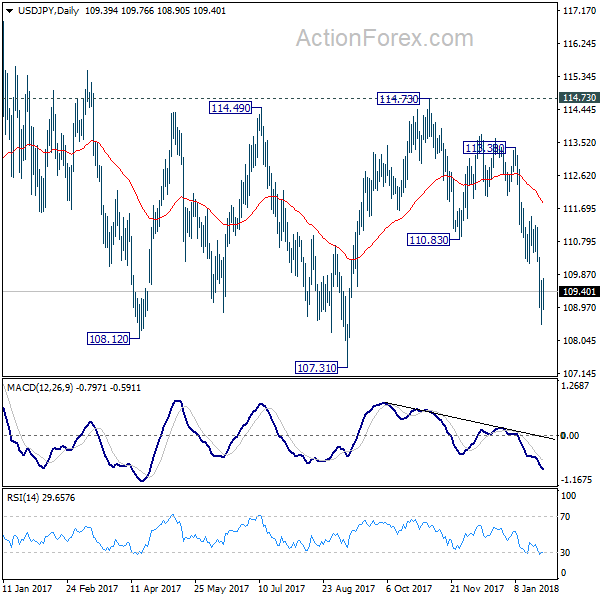
In the bigger picture, current development argues that the corrective pattern from 118.65 is extending. There is risk of dropping further to 61.8% retracement of 98.97 to 118.65 at 106.48. But this level should provide strong support to contain downside and bring resumption of rise from 98.97. However, sustained break of 106.48 will now likely send USD?JPY through 98.97 to resume the corrective fall from 125.85 (2015 high).
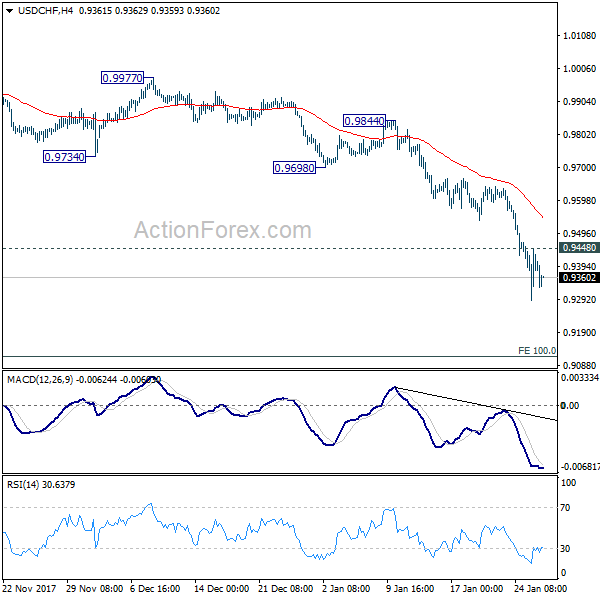
USD/CHF Mid-Day Outlook
Daily Pivots: (S1) 0.9310; (P) 0.9388; (R1) 0.9488; More...
Intraday bias in USD/CHF remains on the downside with 0.9448 minor resistance intact. Current decline should now target next key fibonacci level at 0.9115. On the upside, above 0.9448 minor resistance will turn intraday bias neutral and bring consolidations first.
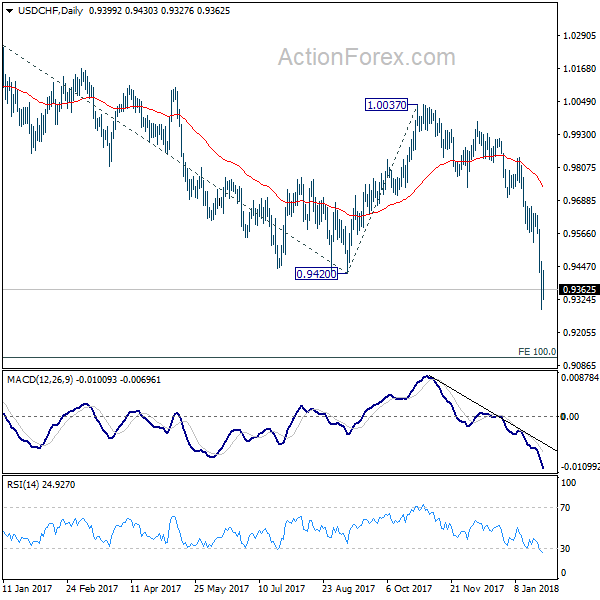
In the bigger picture, the strong break of 0.9420 support suggests that fall from 1.0342 is developing into a medium term down trend. Deeper fall should be seen to 100% projection of 1.0342 to 0.9420 from 1.0037 at 0.9115.
EUR/USD Mid-Day Outlook
Daily Pivots: (S1) 1.2327; (P) 1.2432 (R1) 1.2501; More....
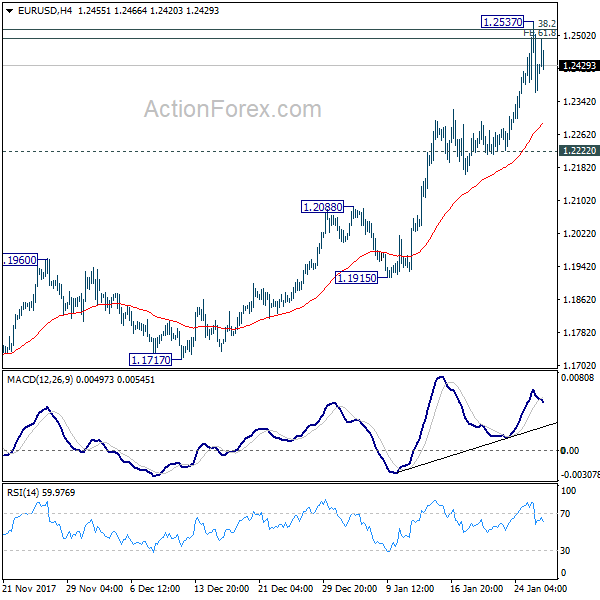
Intraday bias in EUR/USD remains neutral for consolidation below 1.2537 temporary top. Focus stays on 1.2494/2516 cluster resistance zone. Sustained break of 1.2494/2516 will target 100% projection of 1.0569 to 1.2091 from 1.1553 at 1.3075 next. In case of deeper retreat, outlook will stay bullish as long as 1.2222 support holds.
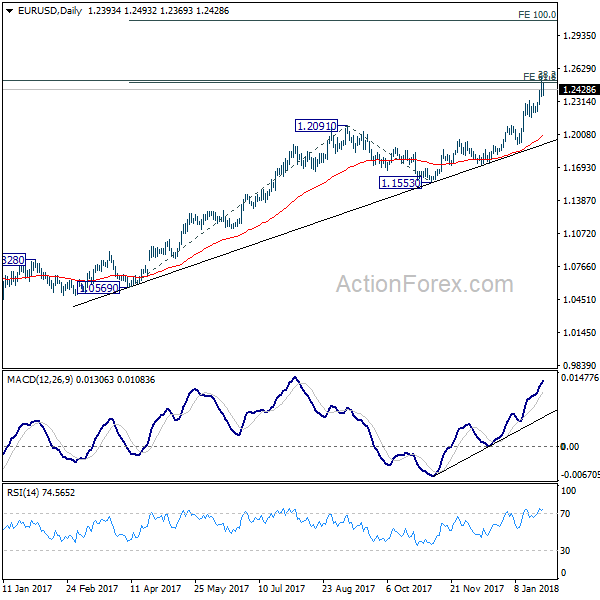
In the bigger picture, rise from 1.0339 medium term bottom is still seen as a corrective move for the moment. But key fibonacci level at 38.2% retracement of 1.6039 (2008 high) to 1.0339 (2017 low) at 1.2516 is looking vulnerable. Sustained break of 1.2516 will carry larger bullish implication and target 61.8% retracement of 1.6039 to 1.0339 at 1.3862. Nonetheless, rejection from 1.2516 will maintain long term bearish outlook and keep the case for retesting 1.0039 alive.