Sample Category Title
EUR/USD: ECB Interest Rate Decision
EUR/USD: ECB Interest Rate Decision
The Euro growth was muted against the Greenback on the ECB interest rate decision announcement. Though, the European single currency managed to reach the peak after the Bank’s President Mario Draghi stated that economic figures indicate solid and broad expansion with inflation likely to increase in the mid-term. The European Central Bank opted to keep the key interest rates at the same level with the quantitative easing programme remaining at €30B per month until September 2018, in line with market expectations.
From the US side, as the country’s President Donald Trump announced that he wanted stronger US Dollar, contracting the Treasury Secretary comments, EUR/USD fell back below the 1.2400 a few hours later.
Forex Technical Analysis: EUR/USD, USD/JPY, GBP/USD
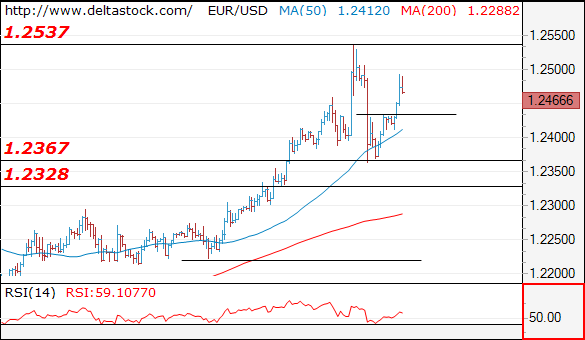
EUR/USD
Current level - 1.2466
The short-lived spike to 1.2537 was followed by a massive sell-off to 1.2360 and my outlook is bearish again below 1.2540, for another leg towards 1.2330.
| Resistance | Support | ||
| intraday | intraweek | intraday | intraweek |
| 1.2500 | 1.2500 | 1.2440 | 1.2330 |
| 1.2540 | 1.2870 | 1.2330 | 1.2220 |
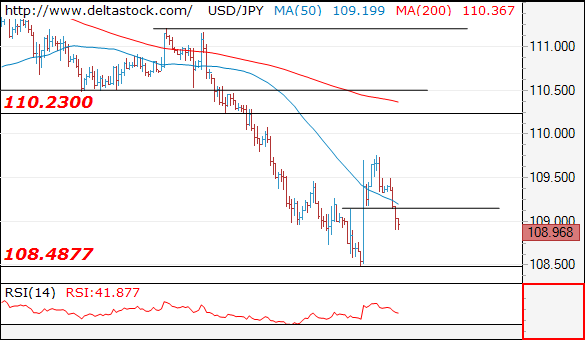
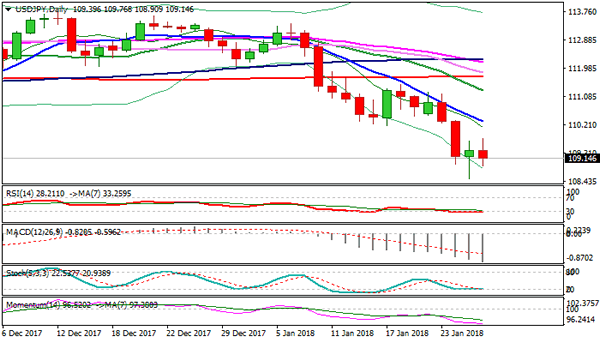
USD/JPY
Current level - 108.96
A reversal has been confirmed at 108.50 and the bias is positive, for a break through the initial hurdle at 109.15, towards 110.20 resistance area.
| Resistance | Support | ||
| intraday | intraweek | intraday | intraweek |
| 109.15 | 110.20 | 108.50 | 108.50 |
| 110.20 | 112.00 | 108.50 | 107.30 |
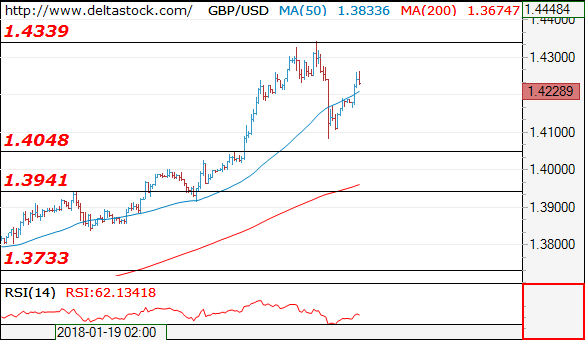
GBP/USD
Current level - 1.4228
Yesterday's second test of 1.4340 failed as well and the massive sell-off signals a broader consolidation pattern before renewal of the uptrend towards 1.4730. Intraday I favor a reversal of the rise from 1.4080 and another slide towards 1.4050 static support. Minor intraday support lies at 1.4190.
| Resistance | Support | ||
| intraday | intraweek | intraday | intraweek |
| 1.4340 | 1.4340 | 1.4190 | 1.3940 |
| 1.4340 | 1.4730 | 1.4050 | 1.3730 |
Technical Outlook: USDJPY – Bears Attempt To Neutralize Positive Signals From Thursday’s Bounce, US GDP Data In Focus
The pair came under renewed pressure on Friday and probes again below 109 handle, following short-lived recovery attempts, inspired by comments from President Trump, which stalled at 109.75.
Fresh weakness attempts to neutralize bullish signal from Thursday strong downside rejection (108.50) and positive close.
Bearish daily techs maintain negative bias with near-term action being capped by falling thick hourly cloud (cloud base is currently at 109.25 and will fall to 109.00 later today.
Bears need close below cracked Fibo 76.4% of 107.31/114.73 rally at 109.06 (after repeated failures on Wed / Thu) to generate stronger bearish signal.
Extension below 108.50 (Thursday's low) would confirm bearish continuation and expose initial target at 108.12 (11 Sep low) which guards key m/t support at 107.31 (08 Sep low).
Bullish scenario requires stronger recovery through key near-term barriers at 110.00 zone (hourly cloud top / daily Tenkan-sen) to generate stronger reversal signal.
US GDP data are in focus today and expected to provide fresh signals for the dollar. US economy is expected to have grown 3% in Q4, less than 3.2% in Q3 and 3.3% in Q2, but holding at high levels (near the highest in one year) which could be seen as positive signal).
Upbeat US GDP numbers today would offer fresh support for the greenback and possibly spark stronger recovery, while release below 3% would put dollar under fresh pressure.
Res: 109.76, 110.00, 110.15, 110.30
Sup: 108.90, 108.50, 108.26, 108.12
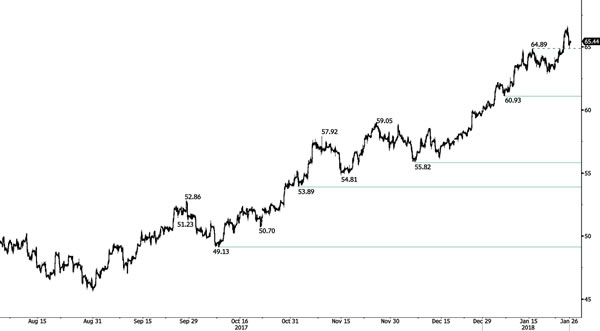
CRUDE OIL Upward Trend Maintained
Crude oil keeps increasing. Strong support is given at 60.93 (05/01/2018 low). Expected to keep increasing as demand remains strong.
In the long-term, crude oil has recovered after its sharp decline last year. However, we consider that further weakness is very likely. For the time being the pair lies in an upside trend since June 2017. Support lies at 42.20 (16/11/2016) while new resistance point is located at 77.83 (20/11/2014). Crude oil is trading largely above its 200 DMA.
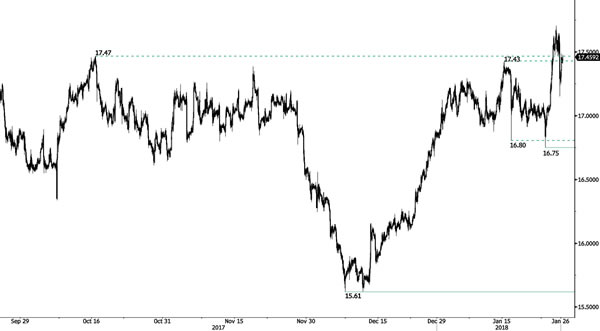
SILVER Growing Pressure
Silver has been bouncing on hourly support at 17.1539 (25/01/2018) and continues its hike. The short-term technical structure is turning positive. Hourly resistance lies at 18.21 (08/09/2017 high).
In the long-term, the trend remains negative. Further downside is very likely. The pair is trading slightly above its 200 DMA. Resistance is located at 21.58 (10/07/2014 high). Strong support can be found at 11.75 (20/04/2009).
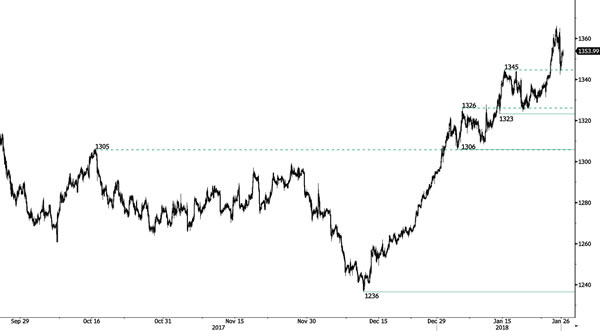
GOLD Rising (Continued)
Gold increases and exceeds 1'350. Hourly support is at 1'323 (12/01/2018 low). The technical structure indicates further short-term upside moves.
In the long-term, the technical structure suggests that there is a growing upside momentum. A break of 1'392 (17/03/2014) is required to confirm it. A major support can be found at 1'045 (05/02/2010 low).
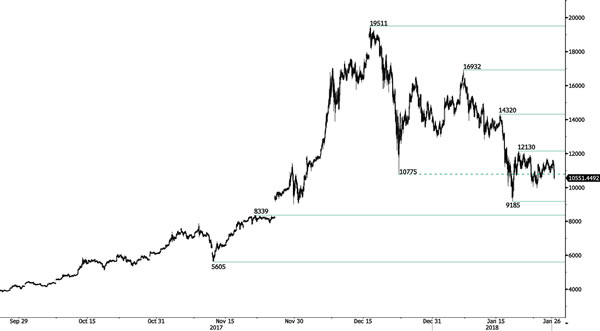
BITCOIN Decreasing
Bitcoin is heading downward. Hourly support is at 9'185 (17/01/2018 low). In the short-term, the technical structure suggests further decrease.
In the long-term, the digital currency has had an exponential growth but also presented important downturns. There is decent likelihood that the currency could stabilize between 9'000 - 12'000 in 2018. Bitcoin is trading far above its 200 DMA (5K+ gap).
EUR/CHF Weaker Decline
EUR/CHF bearish momentum decelerates. Hourly support at 1.1607 (18/12/2017 low) is near. Hourly resistance is at 1.1832 (15/01/2018 high). Expected to show further short-term downside moves.
In the longer term, the technical structure has reversed. Strong resistance is given at 1.20 (level before the unpeg). Yet, the ECB's slowing QE program is likely to cause buying pressures on the euro, which should weigh in favour of the EUR/CHF. Support can be found at 1.0184 (28/01/2015 low) and 1.0082 (27/01/2015 low).
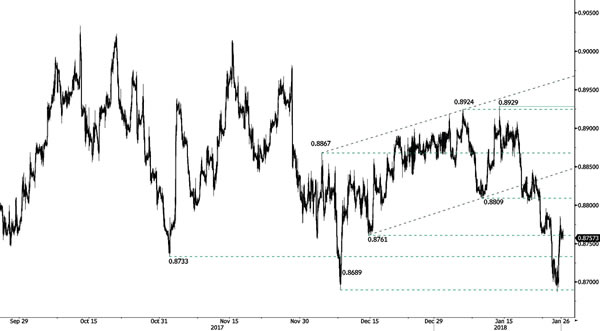
EUR/GBP Downside Skewed
.
EUR/GBP is declining after sharp rise yesterday. The pair is again distancing the resistance at 0.8929 (01/12/2017 high). Hourly resistance at 0.8689 (08/12/2017 low) has been reached. Expected to show further decline.
In the long-term, the pair has largely recovered from lows in 2015. The technical structure suggests a growing upside momentum. The pair is trading below the range of its 200 DMA. Strong resistance can be found at 0.9500 (psychological level).
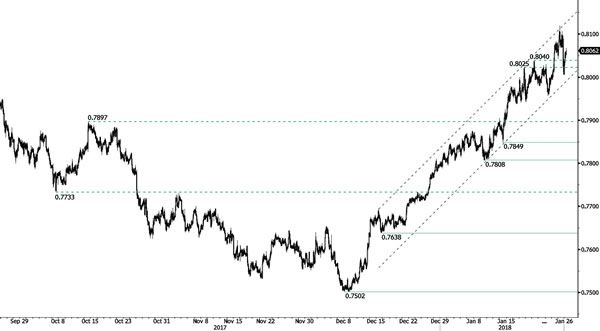
AUD/USD Rebouncing
AUD/USD's upside pressures keeps growing. Support stands at 0.7849 (12/01/2018 low). The technical structure indicates further short-term upside move.
In the long-term, the trend is turning positive. Key support stands at 0.6009 (31/10/2008 low). A break of the key resistance at 0.8164 (14/05/2015 high) is needed to invalidate our long-term bearish view (drawing near).