Sample Category Title
Technical Outlook: WTI OIL Bulls Eye Fibo Target At 66.75 As Strong Bullish Sentiment Offsets Reversal Signals For Now
WTI oil price hit new over three-year high at $66.42 on Thursday, in extension of three-day rally which accelerated on Wednesday.
Fresh boost to oil price came from another decline in weekly crude inventories as EIA report on Wednesday showed draw of 1.1 million barrels, neutralizing fears after API report on Tuesday showed the first build of crude stocks in ten weeks.
Oil price remains well supported by production cut from main world oil producers, which started last year and is set to last until the end of 2018.
Rally on Wednesday completed shallow correction from $64.87 to $62.80 and extension higher signaled a continuation of broader recovery rally which eyes next target at $66.75 (50% retracement of $107.45/$26.04 fall).
Bulls so far ignored overbought conditions on daily chart, but bearish divergence on daily RSI / MACD, continues to warn.
Rising 10SMA offers solid support at $64.45 and should keep the downside protected, guarding lower pivots at $63.13 (rising 10SMA) and $62.80 (correction low), loss of which would generate stronger bearish signal.
Res: 66.42, 66.75, 67.14, 68.00
Sup: 65.72, 64.87, 64.45, 63.13
Today’s ECB Meeting A Yawner
Draghi to keep its ammo for March meeting
With all the noise created by Trump's visit in Davos, the first ECB meeting of the year will almost go unnoticed. The single currency printed another multi-year high earlier this morning as EUR/USD reached 1.2459 before consolidating at around 1.2415. In spite of the apparent calm prevailing in the FX market, the option market tells a different story.
Indeed, the 1-week implied volatility on EUR/USD surged to 10.73% compared to around 7% a week ago. Looking at the 25-delta risk reversal, we notice that calls are slightly more expensive than puts - implied volatility difference between calls and puts stands at 0.435% - which suggests that the market is rather bullish EUR/USD.
Even though there is nothing major to expect from today's ECB meeting as rates and the rate of asset purchase will be most likely maintained at current levels, investors are looking to get further information regarding the monetary policy outlook. In other words, many believe that it is time to adjust the central bank's forward guidance against the backdrop of accelerating economic growth and improving inflationary outlook.
We believe the ECB is in no hurry to update its monetary policy, especially against the backdrop of surging single currency. Mario Draghi will set aside any big announcement for the March meeting. The ECB President may however give some positive comments about the EU economy and/or avoid complaining about the EUR strength. So an upside reaction in EUR crosses cannot be exclude.
Trans-Pacific Partnership (TPP): towards an alternative of NAFTA agreements?
Monday's fruitless negotiations between the United States and its Canadian – Mexican counterparts has brought many uncertainties to the question if the trilateral 'American' arrangement might hold. During its sixth meeting with regard to NAFTAS's terms of trade among partners, the Trump administration brought to the table conditions that the two others can hardly endure: 1) the NAFTA agreements should be repealed by any of the members within a five year time period; 2) rescind article 19 of the NAFTA treaty which stipulates that the right to appeal for the 'Binational Panel' declaratory opinion with regards to antidumping or countervailing statutes (suggesting that members could make unilateral trade-related decisions without consulting their partners); 3) access to public USA market must be restrained for foreign counterparts; 4) 'origin rules' need to be reinforced for the automotive industry by imposing a 85% provenance of automotive components (currently 65%) within the member countries and adding that 50% of the constituents have to be USA-based; 5) Canadian agricultural Supply Management System has to be abolished.
Out of these lengthy negotiations (supposed to end up next Tuesday), there is talk of advancing TPP agreements between its 11 members excluding the USA since its withdrawal decision of the project in January 2017 (Trump naming it a 'job killer'). The parties have the willingness to accelerate the project by solving contentions among them and come up with a final accord as early as March 2018.
We maintain our stance that NAFTA agreement will be maintained, as they remain a big contributor for the New World (NAFTA countries representing 34% of total US exports). Furthermore, since the arrival of Trump's provocative and isolating political behavior, we remain subdued as whether the US could develop new cross-country trade agreements for now, thus forcing US negotiators to remain flexible with NAFTA stakeholders.
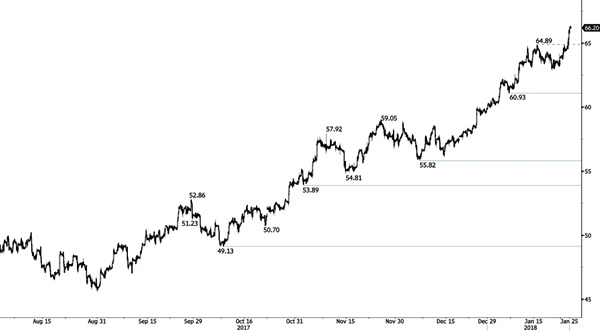
CRUDE OIL Bounce Continues
Crude oil is increasing. Hourly resistance given at 64.89 (15/01/2018 ) is broken. Strong support is given at 60.93 (05/01/2018 low). Expected to keep increasing as demand remains strong.
In the long-term, crude oil has recovered after its sharp decline last year. However, we consider that further weakness is very likely. For the time being the pair lies in an upside trend since June 2017. Support lies at 42.20 (16/11/2016) while new resistance point is located at 77.83 (20/11/2014). Crude oil is trading largely above its 200 DMA.
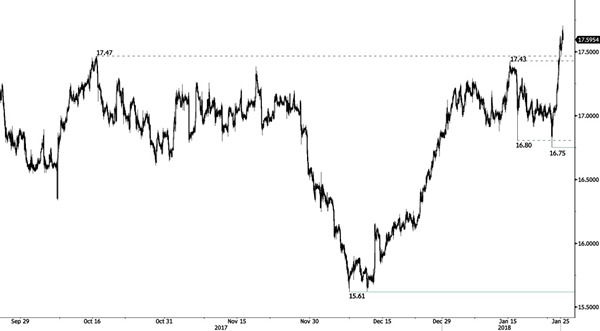
SILVER Bullish Momentum Continues
Silver is continuing its hike to higher ends after a sharp correction (12/08/2017 low at 15.61). The short-term technical structure is turning positive, as hourly resistance at 17.43 (15/01/2018) is now broken. Further resistance lies at 18.21 (08/09/2017 high). Hourly support is at 16.75 (23/01/2018 low).
In the long-term, the trend remains negative. Further downside is very likely. The pair is trading slightly above its 200 DMA. Resistance is located at 21.58 (10/07/2014 high). Strong support can be found at 11.75 (20/04/2009).
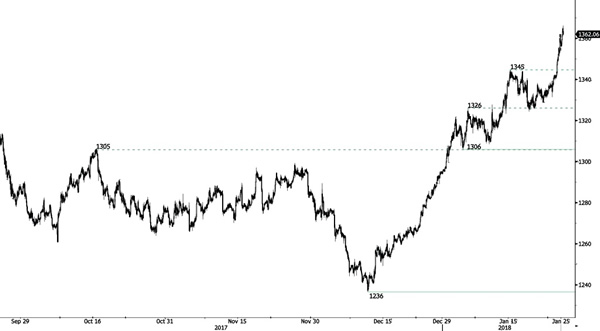
GOLD Rising
Gold increases and exceeds the 1345 resistance point (15/01/2018). Hourly support is maintained at 1'306 (04/01/2018 low). The commodity even outreached the strong resistance landmark at 1357 (08/09/2017 high). The technical structure indicates further shortterm upside moves.
In the long-term, the technical structure suggests that there is a growing upside momentum. A break of 1392 (17/03/2014) is required to confirm it. A major support can be found at 1045 (05/02/2010 low).
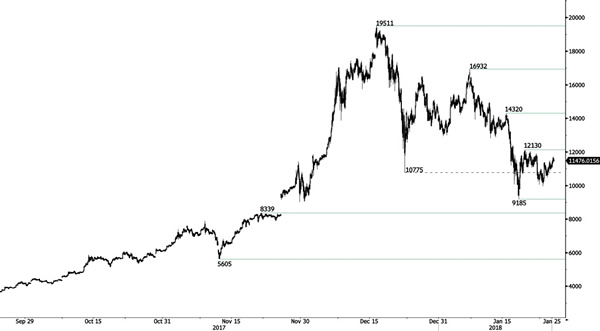
BITCOIN Upside Move
Bitcoin is heading upward. Hourly support is at 9'185 (17/01/2018 low). In the short-term, the technical structure suggests further increase.
In the long-term, the digital currency has had an exponential growth but also presented important downturns. There is decent likelihood that the currency could stabilize between 9'000 - 12'000 in 2018. Bitcoin is trading far above its 200 DMA (5K+ gap).
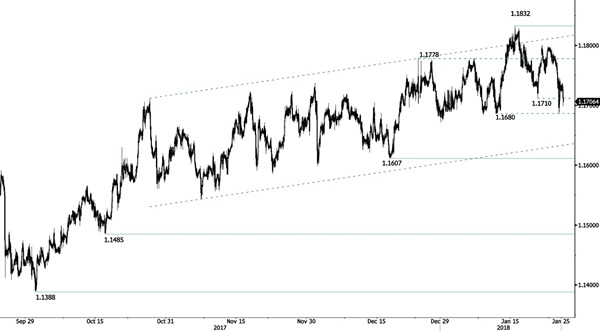
EUR/CHF Declining
EUR/CHF is heading lower. The pair broke resistance point at 1.1710 (19/01/2018) and approaching resistance at 1.1680 (10/01/2018).Hourly resistance is at 1.1832 (15/01/2018 high). Expected to show further short-term downside moves.
In the longer term, the technical structure has reversed. Strong resistance is given at 1.20 (level before the unpeg). Yet, the ECB's slowing QE program is likely to cause buying pressures on the euro, which should weigh in favour of the EUR/CHF. Supports can be found at 1.0184 (28/01/2015 low) and 1.0082 (27/01/2015 low).
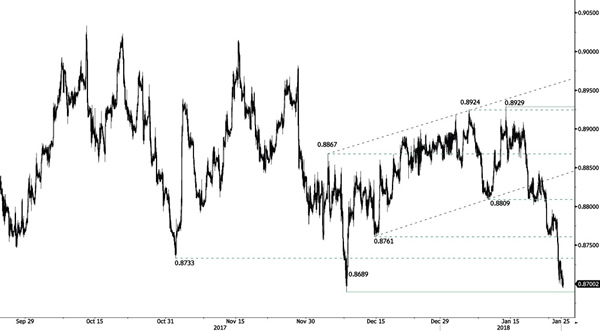
EUR/GBP Decreasing
EUR/GBP is declining. The pair is distancing the resistance at 0.8929 (01/12/2017 high) and endures downward pressure. Support at 0.8761 (14/12/2017 low) is broken while resistance at 0.8689 (08/12/2017) is being monitored. Expected to show further decline.
In the long-term, the pair has largely recovered from lows in 2015. The technical structure suggests a growing upside momentum. The pair is trading below the range of its 200 DMA. Strong resistance can be found at 0.9500 (psychological level).
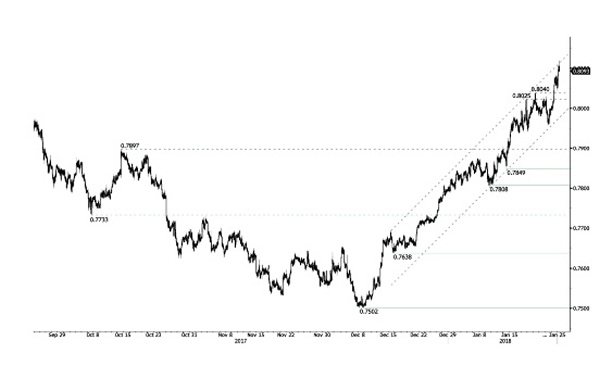
AUD/USD Riding Higher
AUD/USD's upside pressures are growing. Hourly resistance given at 0.8040 (19/01/2018) is outpaced. Support stands at 0.7849 (12/01/2018 low). The technical structure indicates further short-term upside move.
In the long-term, the trend is turning positive. Key supports stands at 0.6009 (31/10/2008 low). A break of the key resistance at 0.8164 (14/05/2015 high) is needed to invalidate our long-term bearish view (drawing near).
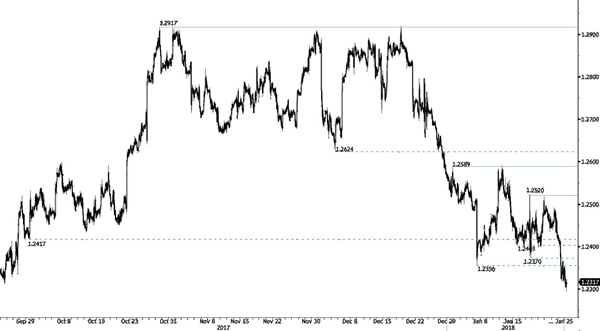
USD/CAD Continued Decline
USD/CAD is decreasing. Resistance points 1.2370 (17/01/2018) and 1.2356 (05/01/2018) are now exceeded. Hourly resistance is given at 1.2520 (17/01/2018 high) while further resistance given at 1.2589 (01/01/2018) is momentarily out of reach. The technical structure indicates that additional weakness is achievable.
In the longer term, the pair has broken longterm support that can be found at 1.2461 (16/03/2015 low). New support point is identified at 1.2128 (18/06/2015 low). Strong resistance is given at 1.4690 (22/01/2016 high). The pair is likely to head lower. The pairs is trading below 200 DMA.