Sample Category Title
GBP/USD Mid-Day Outlook
Daily Pivots: (S1) 1.3934; (P) 1.3980; (R1) 1.4046; More.....
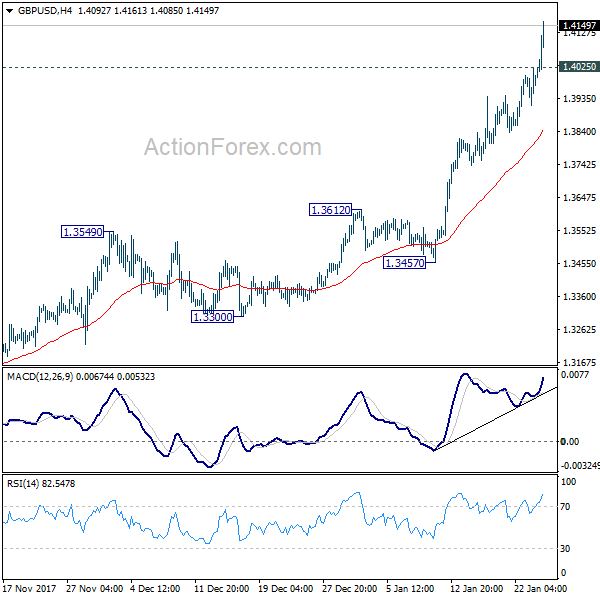
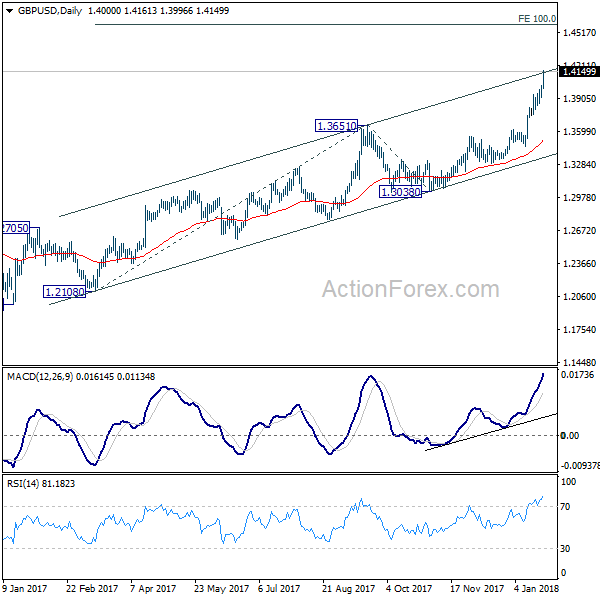
GBP/USD accelerates to as high as 1.4161 so far today. Intraday bias remains on the upside for further rally. Firm break of medium term channel resistance will bring further upside acceleration to 100% projection of 1.2108 to 1.3651 from 1.3038 at 1.4581 next. On the downside, below 1.4025 minor support will turn intraday bias neutral and bring consolidation. But retreat should be contained well above 1.3612 resistance turned support to bring another rise.
In the bigger picture, sustained break of 1.3835 key resistance level indicates that rebound from 1.1946 is at least correcting the long term down from from 2007 high at 2.1161. In that case, further rise should be seen back to 38.2% retracement of 2.1161 (2007 high) to 1.1946 (2016 low) at 1.5466. Medium term outlook will now stay bullish as long as 1.3038 support holds.
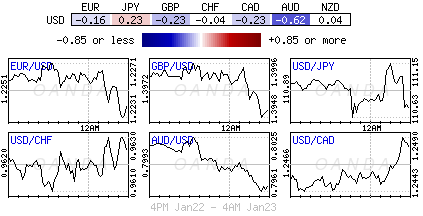
Dollar Selloff Accelerates With Mnuchin Backing, Sterling Jumps on Wage Growth
Dollar's broad based selloff resumes today as traders hit the accelerator. The key factors behind are improving economic outlook in other major economies. At the same time US Treasury Mnuchin's backing of a weaker dollar is triggering the acceleration. While economic data from Eurozone continued to be solid, it's following Dollar as the second weakest one. Sterling emerges as the strongest one today as data suggest faster wage growth. Aussie and Kiwi come as second and third.
Mnuchin: A weaker dollar is good for us
US Treasury Secretary Steven Mnuchin s expressed that a weaker dollar is welcomed by the country. Mnuchin said in a press conference at the World Economic Forum in Davos that "obviously a weaker dollar is good for us as it relates to trade and opportunities." And, the short term movements are "not a concern of ours at all". He also added "longer term, the strength of the dollar is a reflection of the strength of the U.S. economy and the fact that it is and will continue to be the primary currency in terms of the reserve currency."
UK wage growth accelerating
UK jobless claims rose 8.6k in December above expectation of 2.3k. Claimant count rate also rose to 2.4%. ILO unemployment rate was unchanged at 4.3% in November. Average weekly earnings, including bonus, rose 2.5% 3moy. However, average earnings growth, excluding bonus, accelerate to 2.4%, up from 2.3%. Some economists perceived the data as confirming underlying upward pressure in wages. And considering improved Brexit prospects, there is prospect of BoE hiking more than once this year. But that's subject to an early outcome in the Brexit deal, or at least the transition deal.
Eurozone PMIs suggests "super strong" Q1
Eurozone PMI manufacturing dropped to 59.6 in January, down from 60.6 and missed expectation of 60.3. However, Eurozone PMI services rose to 57.6, up from 56.6 and beat expectation of 56.4. Germany PMI manufacturing dropped to 61.2, down from 63.3 and missed expectation of 63.0. Germany PMI services rose to 57.0, up from 55.8 and beat expectation of 55.5. France PMI manufacturing dropped to 58.1, down from 58.8 and missed expectation of 58.6. France PMI services, however, rose to 59.3, up from 59.1, above expectation of 58.9.
Markit chief business economist, Chris Williamson noted in the release that if the January figures are maintained, they are consistent with "super-strong" Q1 growth at 1%. He said that "the Eurozone has got off to a flying start in 2018, with business activity expanding at a rate not seen for almost 12 years. The acceleration of growth pushes the survey data into territory consistent with the economy expanding at a super-strong quarterly rate approaching 1%,"
And, "with employment growing at the fastest pace for 17 years, an improving labour market should feed through to higher consumer spending, which should help further drive the economic upturn as 2018 proceeds, as well as higher wages. Price pressures are meanwhile running at their highest for almost seven years, accelerating further at the start of 2018. Higher oil prices have pushed up costs, but pricing power more generally has improved as demand outstrips supply for many goods, leading to a sellers' market."
Japan PMI manufacturing hits near 4 year high
Japan PMI manufacturing rose to 54.4 in January, up from 54.0 and beat expectation of 54.3. The index has now stayed in expansionary region above 50 for the 17th consecutive month. January's reading was also the highest since February 2014. IHS Markit economist Joe Hayes noted in the statement that "the strongest reading in the PMI since February 2014 was supported by quickened rates of output and employment growth."
Also from Japan, adjusted trade balance showed surplus of JPY 86.8b, below expectation of JPY 270b. Nonetheless, the set of data is pretty strong. Exports rose 9.3% yoy to JPY 7.3T, largest since September 2008. Exports to China, the biggest trading partner, jumped 15.8% yoy and hit record JPY 1.5T. Imports jumped even larger by 13.9% yoy.
GBP/USD Mid-Day Outlook
Daily Pivots: (S1) 1.3934; (P) 1.3980; (R1) 1.4046; More.....
GBP/USD accelerates to as high as 1.4161 so far today. Intraday bias remains on the upside for further rally. Firm break of medium term channel resistance will bring further upside acceleration to 100% projection of 1.2108 to 1.3651 from 1.3038 at 1.4581 next. On the downside, below 1.4025 minor support will turn intraday bias neutral and bring consolidation. But retreat should be contained well above 1.3612 resistance turned support to bring another rise.
In the bigger picture, sustained break of 1.3835 key resistance level indicates that rebound from 1.1946 is at least correcting the long term down from from 2007 high at 2.1161. In that case, further rise should be seen back to 38.2% retracement of 2.1161 (2007 high) to 1.1946 (2016 low) at 1.5466. Medium term outlook will now stay bullish as long as 1.3038 support holds.
Economic Indicators Update
| GMT | Ccy | Events | Actual | Forecast | Previous | Revised |
|---|---|---|---|---|---|---|
| 23:30 | AUD | Westpac Leading Index M/M Dec | 30% | 0.10% | ||
| 23:50 | JPY | Trade Balance (JPY) Dec | 0.09T | 0.27T | 0.36T | 0.29T |
| 0:30 | JPY | PMI Manufacturing Jan P | 54.4 | 54.3 | 54 | |
| 8:00 | EUR | France Manufacturing PMI Jan P | 58.1 | 58.6 | 58.8 | |
| 8:00 | EUR | France Services PMI Jan P | 59.3 | 58.9 | 59.1 | |
| 8:30 | EUR | Germany Manufacturing PMI Jan P | 61.2 | 63 | 63.3 | |
| 8:30 | EUR | Germany Services PMI Jan P | 57 | 55.5 | 55.8 | |
| 9:00 | EUR | Eurozone Manufacturing PMI Jan P | 59.6 | 60.3 | 60.6 | |
| 9:00 | EUR | Eurozone Services PMI Jan P | 57.6 | 56.4 | 56.6 | |
| 9:30 | GBP | Jobless Claims Change Dec | 8.6K | 2.3K | 5.9K | |
| 9:30 | GBP | Claimant Count Rate Dec | 2.40% | 2.30% | 2.30% | |
| 9:30 | GBP | Average Weekly Earnings 3M/Y Nov | 2.50% | 2.50% | 2.50% | |
| 9:30 | GBP | ILO Unemployment Rate 3Mths Nov | 4.30% | 4.30% | 4.30% | |
| 14:00 | USD | House Price Index M/M Nov | 0.40% | 0.50% | ||
| 14:45 | USD | US Manufacturing PMI Jan P | 55 | 55.1 | ||
| 14:45 | USD | US Services PMI Jan P | 54.4 | 53.7 | ||
| 15:00 | USD | Existing Home Sales Dec | 5.72M | 5.81M | ||
| 15:30 | USD | Crude Oil Inventories | -6.9M |
USD/CAD Is Below The Chuvashov’s Fork
Overnight support was found on Oil, as prices have begun to rise once again. This is positive for CAD relative to USD. The USD/CAD is currently below both Weekly and Daily L4 support levels, indicating a strong downtrend. At this point, we can see that the price is trapped below the Chuvashov's fork (magenta trend lines) and a retest of POC zone 1.2385-1.2400 could see some fresh shorts. However short term rejections are possible also around 1.2365 (blue dotted line). Target is Weekly L5 - 1.2322 where we could see some profit taking and a bounce. USD/CAD long trades are possible if the fork is broken. The break of 1.2440 should be a potential long towards 1.2490 and 1.2544.
W H3 - Weekly Camarilla Pivot (Weekly Interim Resistance)
W H4 - Weekly Camarilla Pivot (Strong Weekly Resistance)
D H4 - Daily Camarilla Pivot (Very Strong Daily Resistance)
D L3 – Daily Camarilla Pivot (Daily Support)
D L4 – Daily H4 Camarilla (Very Strong Daily Support)
POC - Point Of Confluence (The zone where we expect price to react aka entry zone)
Technical Outlook: USDCAD: Bears Accelerated On Break Of Pivotal Supports
The USDCAD pair fell sharply on Wednesday, extending bear-leg from 1.2508 (19 Jan lower top).
Fresh bearish extension generated strong negative signal on break below pivotal supports at 1.2387 (Fibo 61.8% of 1.2061/1.2916 rally) and former lows which marked double-bottom at 1.2355/60.
Eventual close below 1.2387 Fibo support after several false breaks and close below 1.2355/60 lows, will be another bearish signal for continuation of downtrend from 1.2915 triple-top towards next target at 1.2263 (Fibo 76.4% of 1.2061/1.2916).
Bearish daily techs and negative outlook for the US dollar are expected to keep the pair under increased pressure.
With no data from Canada scheduled today, focus will turn towards US economic indicators (PMI and Housing data re highlights today) for fresh signals.
Res: 1.2360, 1.2387, 1.2400, 1.2439
Sup: 1.2300, 1.2263, 1.2195, 1.2171
US 500 Index Posts Fresh Record High, RSI Could Be Pointing To Overextended Market
The US 500 index hit a fresh all-time high of 2,842.60 during today’s trading.
The Tenkan-sen line remains above the Kijun-sen line – with both lines maintaining a positive slope – and the RSI indicator continues to rise. All these are indicative of the positive momentum that is in place. However, the RSI is well above the 70 overbought level at 84. This could be a sign of an overstretched market, rendering a pullback in the near-term a possibility.
Further advancing could see the index meeting resistance around the upper Bollinger band at 2,863.70. The 2,900 handle, a potential psychological level, lies not far above; combined with the upper Bollinger band, they might form a resistance area to the upside. Stronger bullish movement would turn the attention to the 3,000 mark, this being another level of potential psychological significance.
Should the index record losses, support could come around the current level of the Tenkan-sen at 2,804.05, with steeper declines shifting the focus to the Kijun-sen at 2,755.40 – the range around this point also encapsulates the middle Bolligner line, a 20-day moving average line.
The medium-term picture is undeniably bullish: the index is in an uptrend with price action taking place above the Ichimoku cloud, as well as above the 50- and 100-day MAs which are heading higher.
Overall, both the short-term bias and the medium-term outlook are bullish, though the overbought RSI might be sounding an alarm in the near-term.
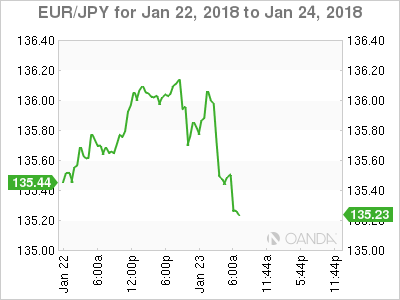
EURJPY Bearish Within Sideways Channel
EURJPY is retreating during today's European session while it has been trading within a narrow range over the last almost two weeks, with upper boundary at the 136.20 resistance level and lower boundary at the 135.15 support barrier.
The pair managed to crawl back towards 135.15 after the bounce off the mid-level of the Bollinger band and a break below the narrow range could endorse the downward pressure until the 134.40 price level, which is the 23.6% Fibonacci retracement level of the up-leg from 127.50 to 136.60. As a side note, euro/yen needs to go through the 135.00 critical psychological barrier before it creates further losses.
On the upside, if prices successfully surpass the region within the bearish crossover of the 20-simple moving average with the 40-SMA, this could shift the short-term outlook to a more bullish one as it could take the pair towards the 136.20 barrier.
In the 4-hour chart, momentum indicators are suggesting further downside tendency. The Relative Strength Index (RSI) is standing below the 50 level and is sloping south, whilst the MACD oscillator entered the bearish territory (but with weak momentum).
Technical Outlook: WTI Oil – Crude Stocks Data Eyed For Fresh Signal
WTI oil price holds firm tone on Wednesday but stays below new high at $64.87, posted on 15 Jan and retested on Tuesday, but gains were limited here. Surprise increase in US crude inventories (API report on Tuesday showed build of crude stocks by 4.8 million barrels, the first increase in ten weeks) slowed bulls. Limited dip was seen after data (easing was contained at $64.30) with subsequent acceleration higher, turning near-term bias higher again. Bullish techs continue to underpin oil price, along with positive sentiment on OPEC-led production cut action which managed to reduce impact of global oversupply and boost oil prices. EIA weekly crude stocks data are in focus today, with forecast for 1 million barrels draw, compared to draw of 6.86 million barrels last week. Markets are concerned about possible increase in crude stocks which could have negative impact on near-term price action. Bulls need firm break above $64.87 barriers to signal bullish continuation and expose next target at $66.75 (50% retracement of $107.45/$26.04 descend). Negative scenario would signal increasing downside risk on break below initial support at $64.08 (rising 10SMA) and would signal extended consolidation. Near-term action is holding within $64.87/$62.80 range with break below $62.80 handle (correction low/rising 20SMA) needed to generate stronger signal of correction.
Res: 64.87, 65.00, 65.35, 65.65
Sup: 64.32, 64.08, 63.69, 62.80
Dollars Decline Deepens As Equities Pull Back
Wednesday January 24: Five things the markets are talking about
There is no rest for the wicked and that includes the once “mighty” dollar, as the buck, for a third consecutive session, extends its decline to a new three year low against most G10 currency pairs overnight. Global equities, again, have had another mixed session, while gold added to its recent gains.
Investors' attention now shifts to tomorrow's European Central Bank (ECB) monetary policy meeting, while keeping one eye on the annual economic conference in Davos, Switzerland.
The dollar remains a key focus as traders increasingly cite concerns about a widening U.S trade deficit and the markets growing belief that G7 monetary policy, ex-U.S, will shift away from their ultra-easy monetary policies this year.
Not aiding the U.S dollar are comments from Treasury Secretary Mnuchin who noted that he “was not concerned about the current level.”
Note: Barring any last minute changes in Washington, President Trump is expected to join other world leaders in Davos.
1. Stocks mixed results
In Japan, the Nikkei share average took a breather overnight after rising to a three-decade high Tuesday, as weakness in exporters offset gains in real estate stocks. The Nikkei dropped -0.4%, while the broader Topix shed -0.3%.
Down-under, Aussie shares closed higher Wednesday, boosted by financial and healthcare stocks. The S&P/ASX 200 index rose +0.3%.
In Hong Kong, the benchmark Hang Seng Index has rallied for a seventh consecutive session to end at a new high, as strength in energy shares offset weakness in IT and finance plays. At the close of trade, the Hang Seng index was up +0.08%, while the Hang Seng China Enterprises index rose +0.97%.
In China, stocks extended their climb, with the main indexes reaching new two-year peaks. At the close, the Shanghai Composite index was up +0.4%, while the blue-chip CSI300 index was up +0.19%.
In Europe, regional indices trade mostly lower, consolidating after recent gains with the exceptions of the Swiss SMI, which trades modestly higher. The U.K's FTSE is underperforming on the back of continued strength in sterling (£1.4090) weighing.
U.S stocks are set to open in the black (+0.2%).
Indices: Stoxx600 -0.1% at 402.3, FTSE -0.5% at 7694, DAX -0.1% at 13544, CAC-40 -0.2% at 5524, IBEX-35 -0.2% at 10588, FTSE MIB -0.2% at 23779, SMI +0.5% at 9595, S&P 500 Futures +0.2%
2. Oil prices ease as U.S. crude inventories rise unexpectedly, gold higher
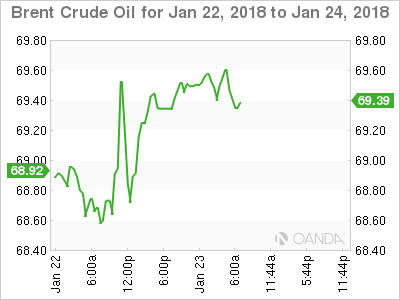
Oil prices have slipped a tad, under pressure from a rise in U.S crude inventories.
Ahead of the U.S open, Brent futures have eased -24c to +$69.72 a barrel, after climbing above +$70 this month for first time in three-years. U.S West Texas Intermediate (WTI) futures are unchanged at +$64.47 a barrel.
Data yesterday from the American Petroleum Institute (API) showed crude inventories rose by +4.8m barrels over the week, compared with expectations for a decline of -1.6m barrels. Gas stocks also rose.
Traders will take their cues from today's official U.S government inventory data (EIA), which is due out at 10:30 am EDT.
Note: Data shows that investors hold more ‘bullish' positions in crude futures and options than at any time on record, which has been encouraged by falling global inventories.
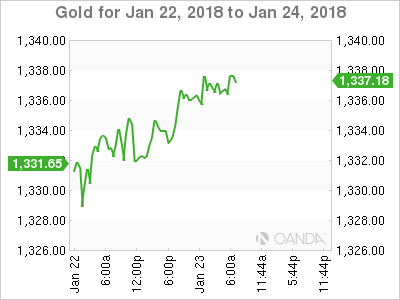
Gold prices have again edged higher, drifting towards its four-month high print of last week, as the U.S dollar sank to a fresh three-year low. Investor worries about a potential trade war has promoted the risk-aversion trading strategy. Spot gold is up +0.1% at +$1,342.30 per ounce.
3. ECB rate decision looms
Ahead of the U.S open, Euro bond yields again have backed up a tad, as caution settles into the fixed income markets ahead of tomorrows ECB rate announcement and press conference.
Tomorrow's event is expected to be livelier than recent meeting, now that ECB policy makers have suggested that ‘early' 2018 for a revision of its policy guidance.
However, the EUR (€1.2332) sitting atop of its three years highs could throw a spanner into the works and encourage President Draghi, in his press conference, to play down talk of an imminent change in the ECB's policy stance.
Note: The EUR has gained +17% outright in the past 12-months – its strength puts downward pressure on inflation.
The yield on 10-year Treasuries has backed up +1 bps to +2.63%. In Germany, the 10-year Bund yield has gained +1 bps to +0.57%, while in the U.K, the 10-year Gilt yield has climbed +1 bps to +1.366%, the highest yield in almost three-months.
4. Dollars downfall continues
The U.S dollar has managed to print fresh lows against most G10 currency pairs after U.S Treasury Secretary Mnuchin said he “welcomed its weakness” and Euro data (see below) showed that the eurozone economy has started the new year at its strongest pace in over a decade.
EUR/USD (€1.2332) is trading atop of its three-year highs. Stronger regional fundamentals have been the ‘single units' biggest supporter. Now that the EUR has breached the psychological €1.2300 handle, tech traders have the sights firmly on the €1.25 barrier.
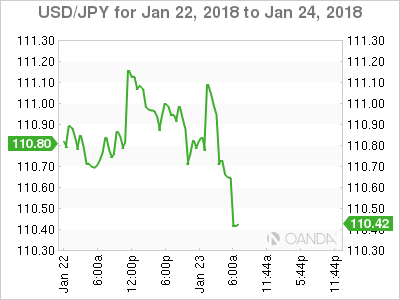
Meanwhile, on the back of the greenback's weakness and despite ‘dovish' talk from the Bank of Japan (BoJ) this week, the yen has pushed through the ¥110 barrier to ¥109.53 for the first time in four-months.
Sterling has managed to trade above the £1.4100 level despite mixed wage and jobs data.
Bitcoin (BTC) is trading at around $11,000.
5. Eurozone economy picks up speed
Data this morning shows that the Purchasing Managers Index collectively for the eurozone rose to 58.6 this month from 58.1 in December, reaching its highest level in almost 12-years.
Note: This mornings reading is consistent with a q/q growth rate of +1%, which would mark a pickup from the +0.7% recorded in the three-months through September and reason why the ECB has halved its monthly purchase of bonds (QE).
Digging deeper, the strong pace of growth appears set to continue over coming months since the flow of new orders was also robust. All the ECB requires now is inflation!
DAX Yawns As German PMIs A Mixed Bag
The DAX is unchanged in the Wednesday session. Currently, the index is trading at 13,557.50, down 0.02% on the day. On the release front, German and Eurozone PMIs were mixed, but continue to show expansion in the manufacturing and services sectors. German Flash Manufacturing PMI slowed to 61.2, shy of the estimate of 63.2 points. There was better news from Flash Services PMI, which accelerated to 57.0. above the forecast of 55.6 points. The trend was similar in the eurozone, as Flash Manufacturing PMI dipped to 59.6, missing the estimate of 60.4 points. Flash Services PMI improved to 57.6, missing the forecast of 56.5 points. On Thursday, Germany releases Ifo Business Climate, and the ECB will make an interest rate announcement.
The German economy is off to a solid start in 2018. The services sector is performing well, as the January Services PMI hit 57.0, its highest level since 2011. Manufacturing PMI missed the estimate, but the reading of 61.2 points to sharp expansion. Job creation continues to gather steam, and companies are exuding strong confidence, despite the political uncertainty. President Angela Merkel is holding coalition talks with the Social Democrats, but negotiations could take weeks before a new government is formed.
The ECB meets on Thursday, and traders should not expect any dramatics at the first policy meeting of 2018. The Bank is expected to retain its pledge to continue buying bonds under its asset-purchase program (QE), which was extended until September. The ECB has trimmed QE from EUR 60 billion to 30 billion/mth, but is likely to hold interest rates for 3-6 months after that. Still, ECB policymakers have hinted that the Bank could wind up QE in September, and this pushed the euro higher in recent weeks. If ECB President Mario Draghi hints at an end to QE, the euro will likely gain ground. Draghi may prefer to keep a low profile until March, after policymakers have had a chance to review updated economic forecasts.
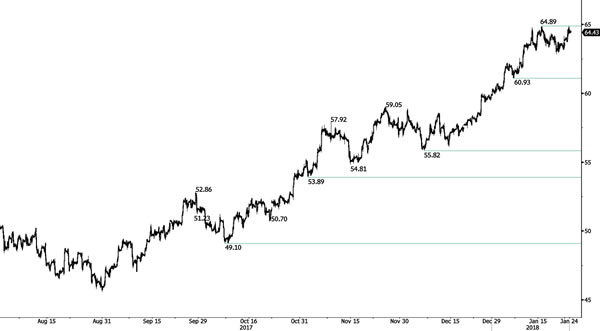
CRUDE OIL Rising
Crude oil is slowly increasing. Hourly resistance is given at 64.89 (15/01/2018 high). Strong support is given at 60.93 (05/01/2018 low). Expected to keep increasing as demand seems very strong.
In the long-term, crude oil has recovered after its sharp decline last year. However, we consider that further weakness is very likely. For the time being the pair lies in an upside momentum since June 2017. Support lies at 42.20 (16/11/2016) while new resistance point is located at 77.83 (20/11/2014). Crude oil is trading largely above its 200 DMA.