Sample Category Title
UK Retail Sales the Next Risk Event for Sterling
UK retail sales data for December are due for release at 0930 GMT on Friday, with forecasts pointing to a tumble in monthly terms, but a rebound on a yearly basis. The actual prints could show whether the squeeze in real incomes continues to weigh on consumer spending, and may go a long way in determining whether the BoE will take action anytime soon.
UK retail sales have been on a weakening path for over a year now, something attributed to the squeeze in real incomes that has taken place following the Brexit vote. With UK inflation accelerating but wage growth remaining largely flat, the real disposable income of UK consumers is being squeezed, feeding into a slowdown in retail sales. This is also one of the factors that has kept the Bank of England (BoE) away from pressing the hiking button too often, on concerns that rising borrowing costs could weigh further on incomes and thereby, hurt consumption and economic growth.
So, what are the upcoming data expected to show? In monthly terms, UK retail sales are forecast to have fallen in December. The headline print is expected to dip by 0.6% m/m after rising 1.1% m/m in November, while the core number - which excludes fuel for automotives - is anticipated to decline 0.8% m/m, having risen 1.2% m/m previously. That said, both of these measures are expected to accelerate to 3.0% in yearly terms. This implies that even though retail spending in December may have been softer than November, it may have still been 3.0% higher compared to a year ago (i.e. December 2016).
Better-than-anticipated prints could ease some concerns regarding a slowdown in UK consumption and perhaps spur bets for the BoE to deliver more than one 25bps rate increase this year. Something like that could bring the pound under renewed buying interest. In this scenario, sterling/dollar could surge and challenge the round figure of 1.3900, where an upside break could even see scope for extensions towards 1.3940, near the pair's latest highs.
On the other hand, if retail sales disappoint relative to the forecasts, then sterling/dollar could correct lower and target the 1.3800 support zone. Should sellers prove strong enough to overcome that territory, the next support area that could come into play is 1.3750. As always, the magnitude of any market reaction will depend on the extent of the deviation of the actual prints from the forecasts.
As for what the major gauges of retail sales showed during the month, the Visa consumer spending index slid somewhat further in December to -1.0% y/y, while the British Retail Consortium (BRC) retail sales monitor held flat at +0.6% y/y. Both of these indicators come in contrast with the official forecasts, which expect retail sales to accelerate in yearly terms.
Chinese Economy Advanced at a Healthy 6.9% Pace in 2017, But Decelerated Towards Year-End
Chinese real gross domestic product (GDP) rose by 6.8% (year-on-year) in the fourth quarter, in line with consensus expectations. On a quarter-over-quarter basis, growth slowed to a 1.6% (6.6% annualized) pace, but the deceleration was widely expected. Growth in the second and third quarters was revised up a touch, boosting annual growth by about 0.1 of a percentage point. Overall, the Chinese economy expanded at a 6.9% pace last year, a bit firmer than the 6.7% pace recorded in 2016.
Nominal GDP grew 11.0% (y/y) in the fourth quarter, slightly weaker than in the previous quarter. In 2017, nominal GDP rose by 11.2%, with the gap between real and nominal GDP largely explained by a 6.4% rise in producer prices. It's worth noting that 2017 saw the first increase in producer prices since 2011.
Growth in economic activity was broad-based on an industry basis. Primary industry firmed up, increasing 4.5% y/y in the fourth quarter, while secondary (construction and manufacturing) activity decelerated to its slowest pace of the year at 5.5%. On a positive note, growth in tertiary (services) industries accelerated to 8.2% y/y, marking its best rate of advance during 2017. Service industries comprise the bulk of economic activity in China, and contributed just over half of the GDP growth in last year.
Fixed asset investment (excluding rural areas) remained at a sub-8.0% pace in the fourth quarter (reported on a year-over-year, year-to-date basis). Fixed asset investment has been slowing consistently since early-2013 when it was rising by around 20% per year, reflecting the shift away from investment toward services. Moreover, at 7.2% in 2017, fixed asset investment increased at the slowest rate on record.
Key Implications
The Chinese economy recorded a healthy advance in 2017 despite a slowdown in credit-fueled construction. Overall, growth beat the target of "about 6.5%" announced early in 2017 by Chinese authorities.
Efforts by Chinese authorities to slow credit growth in order to manage financial stability risks, seem to have borne some fruit. Credit growth slowed in 2017, helping China's debt-to-GDP ratio level off. Moreover, firming growth in the services sector is an encouraging sign that the process of the rotation away from a dependency on debt-financed investment is well underway. But, there's still much work still to be done, with restructuring industries saddled with overcapacity and resolving bad debts being top of mind. As such, we anticipate policymakers will continue to maintain a tightening bias in domestic credit conditions this year.
We anticipate that the Chinese economy will grow at a 6.5% pace this year. Although strong global demand should help support Chinese exports, policies aimed at improving air quality and environmental conditions, together with tighter credit conditions and the closure of inefficient firms, are likely to exert some drag on the output of primary and secondary industries (e.g. mining, manufacturing, and construction). Nevertheless, growth of 6.5% is still above the trend-pace of growth in China, estimated to be between 5.75% and 6.25%
Sunset Market Commentary
Markets:
The German Bund opened lower today, catching up with the Note future's weakness in yesterday's US close. Trading developed in a narrow sideways range after this opening. The US Note future marginally underperformed with US yields lured by key resistance levels. The 5-yr yield tested the 2.42% mark (2011 top), but a break didn't occur. The US 10-yr yield pierced through 2.6% and heads for a test of the 2016 & 2017 top at 2.63%/2.64%. The move in the US Note future was a slight extension of yesterday's reflation boost. Today's mixed US eco data didn't impact trading. The German yield curve bear steepens at this moment with yield changes ranging between -0.3 bps (2-yr) and +2.2 bps (30-yr). The US yield curve shifts in similar fashion with yields 0.8 bps (2-yr) to 2.6 bps (30-yr) higher. 10-yr yield spread changes versus Germany are narrowly mixed with Italy, Spain and Portugal outperforming (-3 to 4 bps). The Austrian treasury launched a new 10-yr bond via syndication (€4bn Feb2028). The bond was priced to yield MS -18 bps compared to MS -17 bps guidance. Total bids exceeded €15bn.
USD trading was technical in nature today. After a nice rebound yesterday, the dollar gained few more ticks in Asia this morning, but the additional 'gain' couldn't be sustained. The dollar even faced again modest selling pressure during European dealings. This was especially the case for USD/EUR. USD/JPY showed a bit more resilience. ECB's Weidmann at a conference in Frankfurt rejected IMF calls for Germany to reduce its surpluses. The impact on markets was limited. The interest rate differentials widened again slightly in favor of the dollar. It was not enough to help the dollar, as was often the case of late. The US data were mixed and mostly softer than expected (housing data & Philly Fed), but jobless claims declined to a very low 220 000. The data hardly affected USD trading. EUR/USD trades in the 1.2240/50 area. USD/JPY hovers near 111.20. In a broader perspective, the dollar trades off the intraday lows, but there is still no clear technical sign that a more sustained USD rebound might be on the cards.
Over the previous days, sterling was in relatively good shape even as there were no eco data or Brexit news to support the move. EUR/GBP maintained most of yesterday's (largely euro inspired) decline. A break below the 0.8810 area could open the way to the 0.8700 range bottom which we assume to be solid. The December UK retail sales data scheduled for tomorrow are the next point of reference for sterling trading.
Most European equity indices trade with limited gains after a big underperformance versus the US yesterday. US indices open with marginal losses today awaiting more guidance from earnings from bellwethers in the coming days.
News Headlines:
Britain's statistical agency has made mistakes in its measurement of the telecoms sector, failing to spot huge cost-efficiencies of up to 90% over a five-year period, it admitted this week. The error, which covers the period from 2010-2015, means that inflation statistics may have been significantly too high and economic growth figures too low.
Republican leaders in the US Congress stepped up their efforts to pass a temporary extension in funding government operations and avert a shutdown, scheduling a vote on the measure for later today.
US filings for unemployment benefits plummeted to the lowest level in almost 45 years (220k) in a sign the job market will tighten further in 2018. Building permits printed close to expectations for December (-0.1% M/M), but housing starts disappointed (-8.2% M/M). The January Philly Fed Business outlook dropped more than forecast, from 27.9 to 22.2. Details showed declines in the activity components while price components surged.
AUDJPY is Trading Slightly Below 2-Month Peak of 89.05
AUDJPY is edging higher and is trying to retest the more than two-month high slightly above the 89.00 strong psychological level. The price was supported by the 20-day simple moving average several times during the previous sessions, failing to drop below it.
Momentum indicators are moving in the positive areas in the short-term with the RSI just below the 70 level, heading to the upside. Moreover, the stochastic oscillator is also running in the bullish territory, with the %K line holding above the %D line, suggesting a strong upside movement.
If price actions climb above the 89.05 resistance level, it could open the door for the next immediate resistance barrier of 90.30 taken from the high on September 21.
On the flip side, in case of a bearish movement, immediate support could come at 87.20. A drop below the aforementioned barrier would open the way towards the 40-day SMA at 86.60.
Having a brief look at the weekly timeframe, the technical indicators are endorsing the bullish scenario. The RSI indicator is moving north in the bullish area, while the stochastic oscillator is holding within the overbought zone.
US: Homebuilders Take a Breather at the End of 2017
U.S. homebuilding activity took a breather in December, registering a paltry 1,192k starts at an annualized rate, marking a decrease of 107k from the slightly upwardly revised November figure. The headline disappointed markets that expected a slight moderation to 1275k. Building permits, in contrast, surprised to the upside, clocking in at 1,302k in December.
Single family starts accounted for the decline, declining by 112k to 836k, from an upwardly revised (+18k) November reading. The more volatile multifamily segment saw building tick up by 5k to 356k, from a downwardly revised (-16k) November reading.
Single family permits rose for the fourth consecutive month, to a healthy 881k. Multi-family permits fell (-17k) to 421k.
Activity in the South weighed heavily on the headline number (-96k), after November set a post-recession record for single-family starts. The other regions reported modest pullbacks in activity in the 3-4k range.
For the year as a whole, starts averaged 1207k, an increase of 30k (2.5%) from 2016 levels as gains in single family homebuilding (up 67k to 851k) more than offset the decline in multifamily units (down 37k). Permits also increased in 2017, rising by 51k to 1258k.
Key Implications
Today's setback appears to be more of a blip in homebuilding activity rather than a beginning of a new trend lower. The decline follows two strong months that were partly boosted by previous delays resulting from hurricane activity. Moreover, housing construction in December was likely thwarted by heavy snowfall while an overarching scarcity of construction workers hangs over the market. Despite these factors, we remain of the view that homebuilding will continue to pick-up, albeit very gradually, supported by single family homebuilding.
New single family homes sales rose sharply and reached a post-recession record in November, indicating that demand is firmly intact as persistent wage gains and still-low mortgage rates facilitate home buying. That being said, the housing market is not sheltered from the effects of tax reform. The $10,000 cap on the state and local tax deduction, which includes property taxes, will impact demand in high-tax regions. Adding to this will be the lower cap on the mortgage interest deduction (down from $1M to $750k), which may put some downward pressure on high-priced markets including those in New York and the District of Columbia. The additional uncertainty may have led to a slight pullback in builder confidence in January. Nonetheless, optimism in the housing market remains within reach of the 18-year high hit in December.
Looking ahead, a shrinking pool of construction workers will be the biggest barrier to homebuilding in 2018, while rising mortgage rates and home prices will add further downward pressure. Despite this, a healthy labor market and accelerating wages will support demand, while tight inventories and rising prices will incentivize new homebuilding. As such, we expect residential investment to edge higher this year, led by particular strength in the single family segment.
Global Shares Mixed, Crude Oil Steady
A strong sense of optimism over sustained global growth continues to stimulate investor appetite for riskier assets, supporting World shares.
Asian stocks marched to record highs on Thursday before ending mixed, following reports that China's economy grew 6.9% in 2017 - the fastest pace in two years and well above market expectations. In Europe, shares were buoyed by improving market sentiment and strong corporate earnings. With the Dow Jones closing above 26,000 for the first time on Wednesday, Wall Street could remain supported as US equity bulls linger in the vicinity this afternoon.
Currency spotlight - EURUSD
The Euro stood strong against major currencies last year and has already entered 2018 on an incredibly positive note.
Market optimism over Europe's improving economic conditions and the prospect of the ECB ending its QE program this year, could boost buying sentiment towards the Euro. With the US Dollar still at the mercy of political uncertainty in Washington, the outlook for the EURUSD remains bullish. From a technical standpoint, the currency pair is firmly bullish on the daily charts. There have been consistently higher highs and higher lows, while prices are trading above the 50 Simple Moving Average. The Breakout above 1.2200 could open a clear path towards 1.2320 and 1.2440, respectively. A scenario where the EURUSD breaks back below 1.2200 could trigger a decline towards 1.2090.
Commodity spotlight - WTI Crude
Oil prices held steady near multiyear highs during Thursday's trading session, thanks to falling crude inventories and reports of Nigerian militants threatening to launch attacks on the nation's oil facilities.
The story around oil's incredible resurgence continues to revolve around major supply disruptions, geopolitical risk, and investor optimism over OPEC's production cuts rebalancing the saturated markets. Although price action suggests that WTI Crude still has further upside potential, this could be limited by rising production from U.S Shale. From a technical standpoint, WTI Crude is bullish on the daily charts. The breakout above $64 has opened a path towards $65 and $65.60, respectively. If bulls struggle to maintain control above $64, the next levels of interest will be $63.30, $63.00 and $62.20 respectively.
Let's not forget about Bitcoin
Bitcoin aggressively clawed back losses during Wednesday evening and even extended gains on Thursday with prices trading around $11,760 as of writing. There is a suspicion that the appreciation witnessed has nothing to do with a change of sentiment towards Bitcoin but a technical bounce which could pave the way to further downside. That said, when it comes to Bitcoin, traders must be prepared to expect the unexpected. Taking a look at the technical picture, Bitcoin is at risk of depreciating further if prices dip back below $11,000.
USD/JPY Mid-Day Outlook
Daily Pivots: (S1) 110.55; (P) 110.94; (R1) 110.70; More...
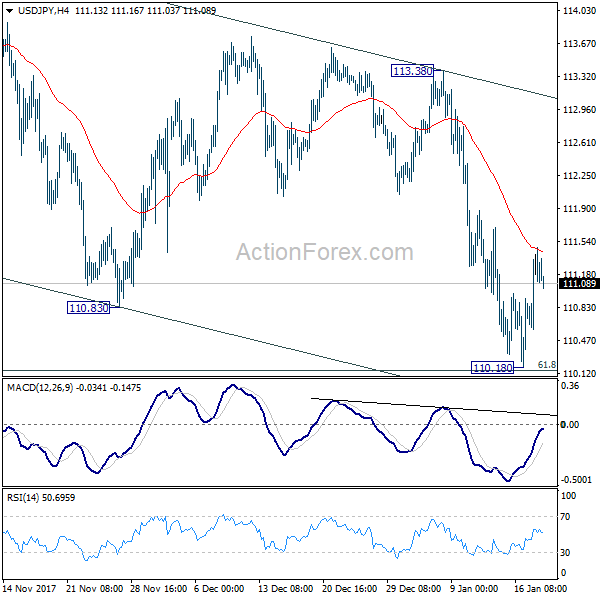
At this point, further rise is still mildly in favor in USD/JPY for 113.38 resistance. Correction from 114.73 could have completed with three waves down to 110.18, ahead of 61.8% retracement of 107.31 to 114.73 at 110.14. Break of 113.38 should confirm this bullish case. However, below 1101.8 will extend the correction lower. But we'd again look for bottoming signal in next fall.
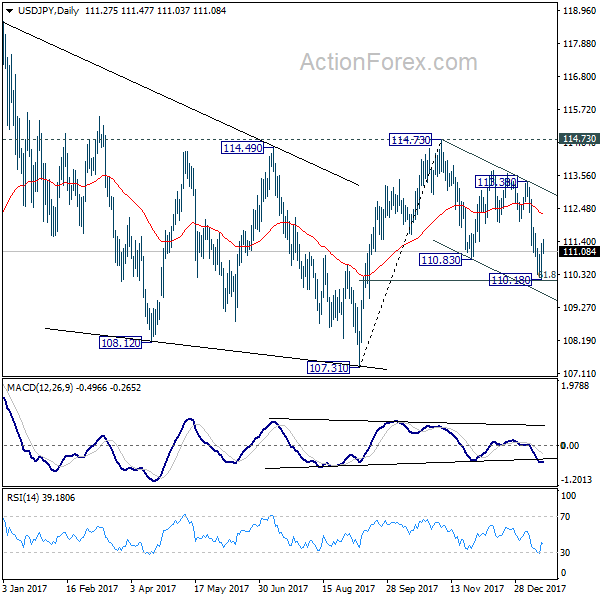
In the bigger picture, we're holding on to the view that correction from 118.65 is completed at 107.31. And medium term rise from 98.97 (2016 low) is going to resume soon. Sustained break of 114.73 should affirm our view and send USD/JPY through 118.65. However, break of 107.31 will dampen this view and extend the medium term fall back to 98.97 low.
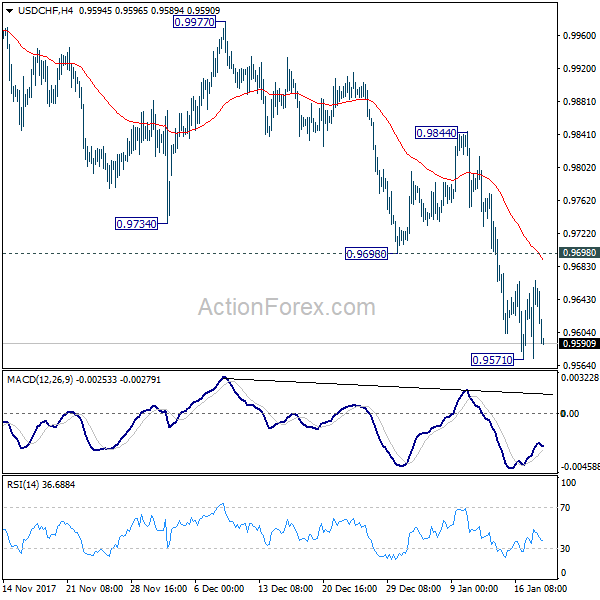
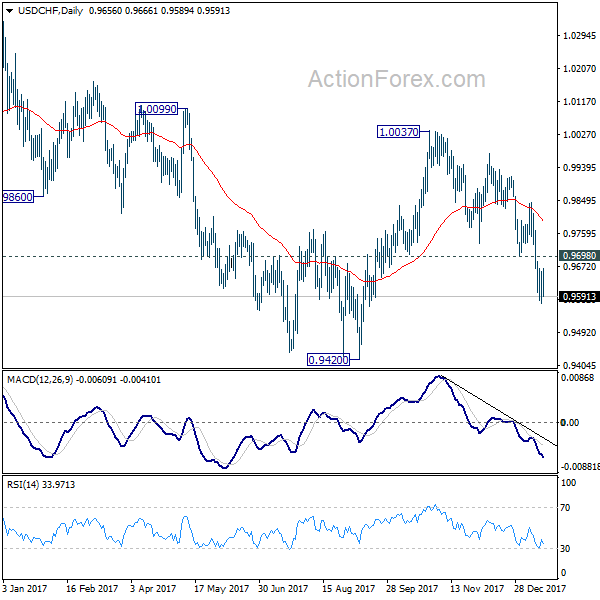
USD/CHF Mid-Day Outlook
Daily Pivots: (S1) 0.9596; (P) 0.9627; (R1) 0.9683; More....
Intraday bias in USD/CHF remains neutral for consolidation above 0.9571 temporary low. As long as 0.9698 support turned resistance holds, deeper fall could be seen to 0.9420 low. Nonetheless, break of 0.9698 will indicate short term bottoming. Intraday bias would then be turned back to the upside for 0.9844 key near term resistance next.
In the bigger picture, range trading continues between 0.9420/1.0342. At this point, 0.9420 appears to be a strong support level. Therefore, in case of decline attempt, we don't expect a firm break of this level. Nonetheless, strong break of 1.0342 is also needed to confirm upside momentum. Otherwise, medium term outlook will stay neutral.
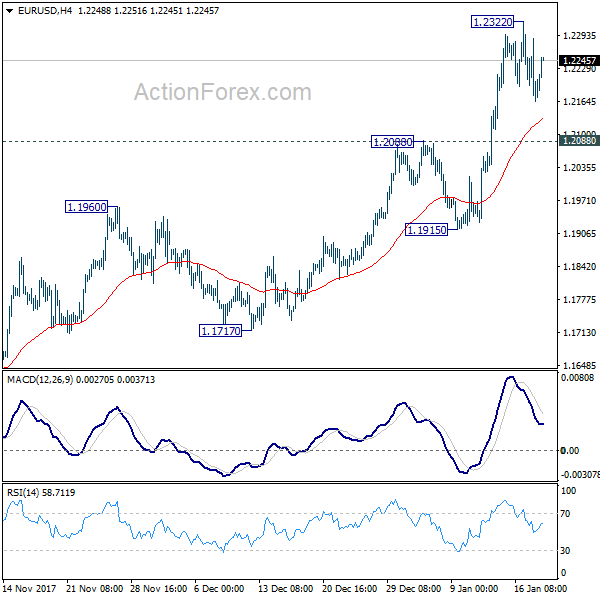
EUR/USD Mid-Day Outlook
Daily Pivots: (S1) 1.2132; (P) 1.2228 (R1) 1.2279; More....
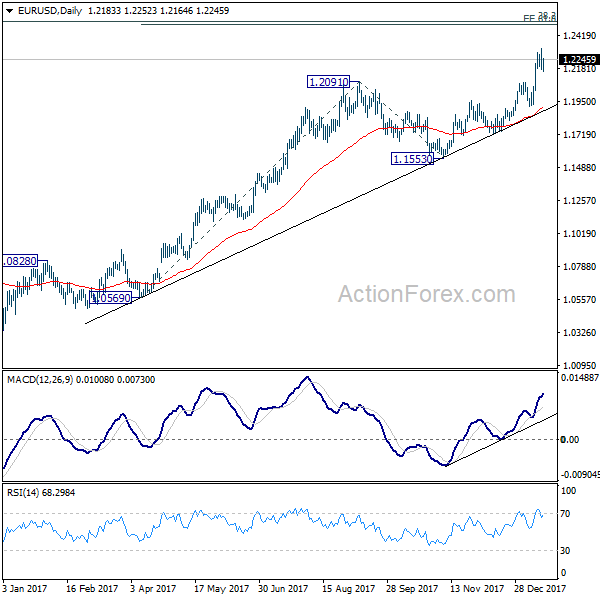
EUR/USD recovers mildly but stays in range below 1.2322 temporary top. Intraday bias remains neutral for the moment. Also, as long as 1.2088 resistance turned support stays intact, near term outlook remains bullish. Current medium term rally would target 1.2494/2516 key resistance zone next. At this point, we'd expect strong resistance from there to limit upside and bring reversal. On the downside, break of 1.2088 will argue that EUR/USD has topped earlier than expected. In that case, intraday bias will be turned to the downside for 1.1915 support first.
In the bigger picture, rise from 1.0339 medium term bottom is still seen as a corrective move for the moment. Therefore, in case of another rally, we'd be expect 38.2% retracement of 1.6039 (2008 high) to 1.0339 (2017 low) at 1.2516 to limit upside and bring reversal. That is also close to 61.8% projection of 1.0569 to 1.2091 from 1.1553 at 1.2494. Break of 1.1553 support will confirm completion of the rise. However, sustained break of 1.2516 will carry larger bullish implication and target 38.2% retracement of 1.6039 to 1.0339 at 1.3862.
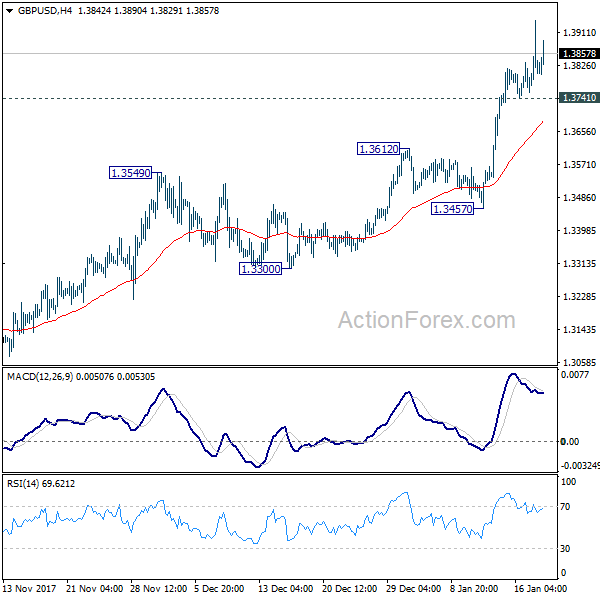
GBP/USD Mid-Day Outlook
Daily Pivots: (S1) 1.3741; (P) 1.3841; (R1) 1.3927; More.....
GBP/USD's rally is trying to regain momentum above 1.3835 key resistance level. Intraday bias is mildly on the upside at this point. Sustained trading above 1.3835 will carry larger bullish implication and should target long term fibonacci level at 1.5466 next. On the downside, though, break of 1.3741 minor support will indicate rejection from 1.3835 and turn bias to the downside for 1.3457.
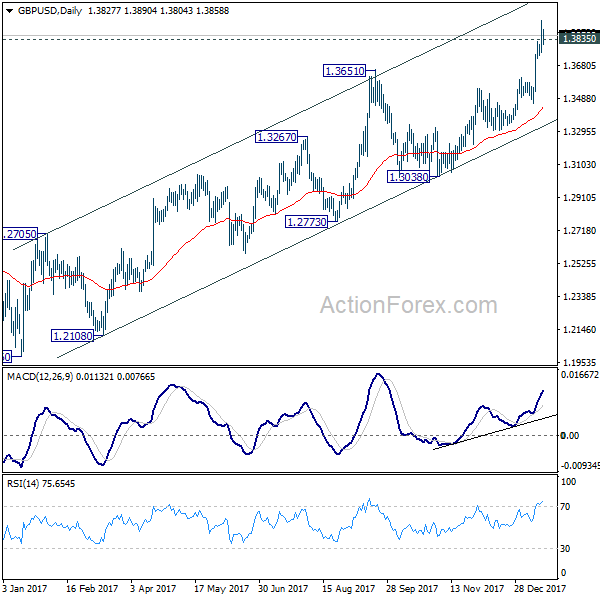
In the bigger picture, sustained break of 1.3835 key resistance level will indicate that rebound from 1.1946 is at least correcting the long term down from from 2007 high at 2.1161. In that case, further rise should be seen back to 38.2% retracement of 2.1161 (2007 high) to 1.1946 (2016 low) at 1.5466. Nonetheless, rejection from 1.3835 will maintain medium term bearishness and thus, the risk retesting 1.1946 ahead.