
Sample Category Title
EUR/USD Daily Outlook
Daily Pivots: (S1) 1.2181; (P) 1.2222 (R1) 1.2281; More....
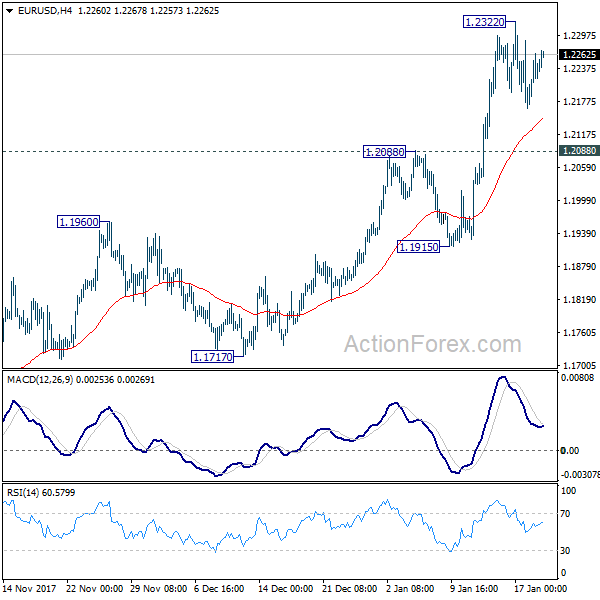
EUR/USD is staying in consolidation below 1.2322 and intraday bias remains neutral. Near term outlook remains bullish with 1.2088 resistance turned support intact, and further rise is expected. Above 1.2322 will resume medium term rally to 1.2494/2516 key resistance zone next. At this point, we'd expect strong resistance from there to limit upside and bring reversal. On the downside, break of 1.2088 will argue that EUR/USD has topped earlier than expected. In that case, intraday bias will be turned to the downside for 1.1915 support first.
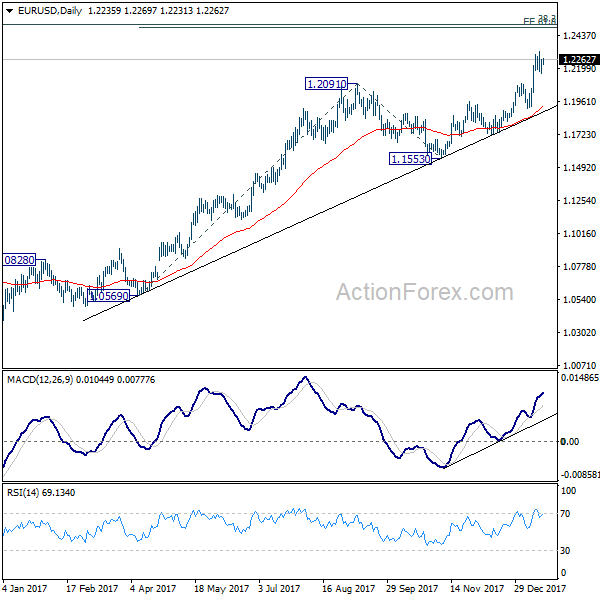
In the bigger picture, rise from 1.0339 medium term bottom is still seen as a corrective move for the moment. Therefore, in case of another rally, we'd be expect 38.2% retracement of 1.6039 (2008 high) to 1.0339 (2017 low) at 1.2516 to limit upside and bring reversal. That is also close to 61.8% projection of 1.0569 to 1.2091 from 1.1553 at 1.2494. Break of 1.1553 support will confirm completion of the rise. However, sustained break of 1.2516 will carry larger bullish implication and target 38.2% retracement of 1.6039 to 1.0339 at 1.3862.
Elliott Wave View: SPX More Upside Expected
SPX Short Term Elliott Wave view suggests that Index is rallying as 5 waves impulse Elliott Wave structure from 12/2/2017 low. Up from 12/2/2017 low (2605.52), Minute wave ((i)) ended at 2665.19, Minute wave ((ii)) ended at 2624.75, Minute wave ((iii)) ended at 2807.54, and Minute wave ((iv)) ended at 2768.87. Index has since broken above Minute wave ((iii)) at 2807.54 suggesting that Minute wave ((v)) higher has started.
Near term, rally from Minute wave ((iv)) at 2678.87 is unfolding as 5 waves impulse where Minutte wave (i) ended at 2807.04. Minute wave (ii) pullback is in progress towards 2781.8 - 2790.94 and while dips stay above Minute wave ((iv)) at 2768.87, expect Index to extend higher within Minute wave ((v)) before ending the 5 waves rally from 12/12/2017 low. We do not like selling the Index.
SPX 1 Hour Elliott Wave Chart
USD/JPY Showing Positive Recovery Signs
Key Highlights
- The US Dollar found support after trading as low as 110.19 against the Japanese Yen.
- There was a break above a short-term bearish trend line with resistance at 111.15 on the 4-hours chart of USD/JPY.
- The pair faces many resistances on the upside at 111.80 and 112.00.
- The US Building Permits in Dec 2017 declined by 0.1%, less than the forecast of -1.0%.
USDJPY Technical Analysis
The US Dollar was under pressure this week as it traded below the 110.50 level against the Japanese Yen. The USD/JPY pair is now recovering and is showing positive signs from the 110.19 low.
The pair has moved above the 23.6% Fib retracement level of the last decline from the 113.38 high to 110.19 low. More importantly, there was a break above a short-term bearish trend line with resistance at 111.15 on the 4-hours chart.
The upside move was stalled near the 111.40 level and the 38.2% Fib retracement level of the last decline from the 113.38 high to 110.19 low. A proper break above the 111.40-50 levels is needed for buyers to step up the momentum.
The next major resistances on the upside are 111.80 and 112.00, but a break above the mentioned levels won’t be easy. On the downside, the pair is likely to find support at 110.80. Should there be more declines below 110.80, the pair could accelerate back towards the last low of 110.19.
Technically, indicators are showing positive signs on the 4-hours chart of USD/JPY. Having said that the pair has to move past 111.50 and 111.80 to keep the momentum intact.
Recently, the US saw the release of the Building Permits Change figure for Dec 2017 by the US Census Bureau. The forecast was slated for a decline of 1%, but the actual was a bit lower as the decline was 0.1%.
On the other hand, the Housing Starts Change posted a decline of 8.2%, which was much higher than the forecast of -1.7%. The US Dollar declined after the release, and USD/JPY tested the 110.80 support area.
Other majors such as EUR/USD started a fresh upside wave and moved above 1.2220. GBP/USD also moved higher towards the 1.3900 level.
China Achieves Full Year GDP Growth Target In 2017
China's economic activities ended last year with a strong tone. GDP growth expanded +6.8% y/y in 4Q17, beating consensus of +6.7%.Serctor-wise, growth in the services sector accelerated to +8.3%, from +8% in the third quarter. By contrast, growth in the manufacturing sector slowed to +5.7% y/y from 6% the third quarter. From a quarter ago, the economy expanded +1.6%, down from an upwardly revised +1.8% in the third quarter. For 2017 as a whole, China's economy expanded +6.9%, up from 6.7% in 2016 and more than meeting the government's target of “around +6.5%”.
Look at the December activity data, IP growth expanded +6.2% y/y in December, beating consensus of, and November's, +6.1%. Concerning individual industries, steel products, ferrous metal, and electricity production improved from the same period last year, but crude oil manufacturing and automobile manufacturing growth decelerated. Urban fixed asset investment grew +7.2% y/y for the full year in 2017, exceeding expectations of a +7.1% increase. Note, however, that this is the first December since 1996 that urban FAI did not expand from the prior year, thanks to the government tightening policies specified to curb the property market. A good point to note in the FAI data is that manufacturing FAI growth soared to +10.2% y/y, the fastest since May 2015, possibly signaling a robust outlook in the broad economy.
Retail sales grew +9.4% y/y, slowing from consensus of, and November's, +10.2%. While the strong reading in November was mainly driven by the one-off factor of the double 11 festival, the weakness in the combined reading of November and December might offer a warning signal.
Overall, China economy remained upbeat last year, despite the government's targeted tightening policies. We expect the PBOC to maintain a prudent and neutral monetary policy this year as anti-corruption, delveraging and debt reduction remain the keys objectives of the government.
GBP/USD Daily Outlook
Daily Pivots: (S1) 1.3826; (P) 1.3869; (R1) 1.3936; More.....
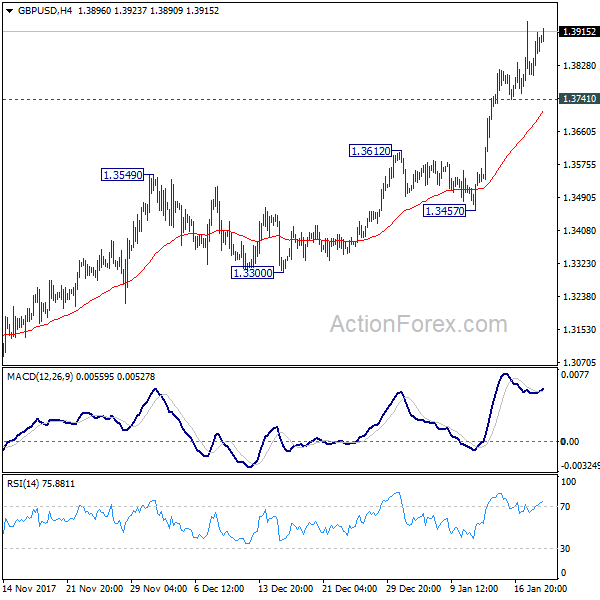
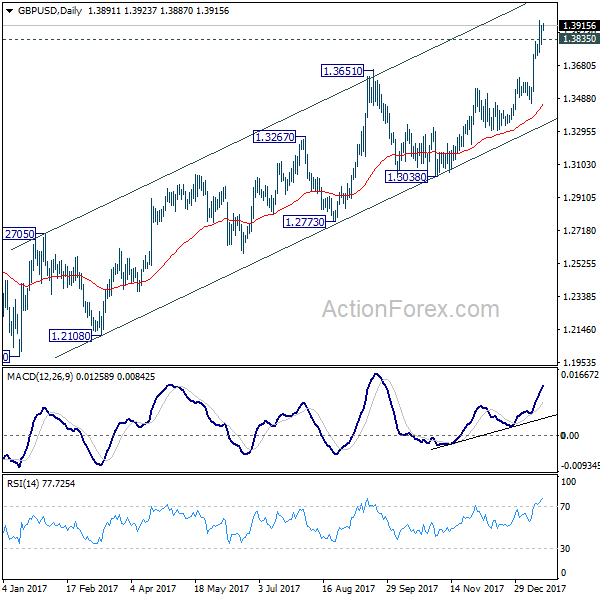
Intraday bias in GBP/USD remains on the upside at this point. As noted before, sustained trading above 1.3835 will carry larger bullish implication and should target long term fibonacci level at 1.5466 next. On the downside, though, break of 1.3741 minor support will indicate rejection from 1.3835 and turn bias to the downside for 1.3457.
In the bigger picture, sustained break of 1.3835 key resistance level will indicate that rebound from 1.1946 is at least correcting the long term down from from 2007 high at 2.1161. In that case, further rise should be seen back to 38.2% retracement of 2.1161 (2007 high) to 1.1946 (2016 low) at 1.5466. Nonetheless, rejection from 1.3835 will maintain medium term bearishness and thus, the risk retesting 1.1946 ahead.
Sterling Stays Strong as Retail Sales Loom, Dollar the Weakest One
Sterling continues to trade as the strongest major currency for the week. Fundamentally, focus will turn to retail sales data to be published today. Technically, GBP/USD should have already taken out 1.3835 key resistance. GBP/JPY also broken 153.66 near term resistance for rally resumption. The next to be watched is 0.8688 support in EUR/GBP, which is still a bit far away from the current 0.8810 level.
Dollar on the other hand, is trading as the weakest one as diversification theme is in play. Other markets in the US are looking good. DOW reached record intraday high at 26153.42 before closing lower by -0.37% at 26017.81. The lost of momentum is not unusual considering the strength of recent rise. 10 year yield closed up 0.33 at 2.611. And 2.621 key resistance (2016 high) is finally in sight. In usual circumstances, we'd expect strength in yield to support the greenback. But it remains to be seen when the two will re-couple.
San Francisco Fed William in race for Fed Vice
San Francisco Fed president John Williams appear to be a funning for the position of Vice Chair of Fed, to fill up the vacancy left by Stanley Fischer. Williams said it's would be a "great honor" to be number two under Jerome Powell. And he "welcome such an opportunity to contribute to the important mission of the Fed.
House approved bill to avoid government shut down
The US House approved the bill to avoid government shutdown on Thursday night. The final vote was 230-197, with 6 Democrats voting for the bill and 11 Republicans against it. Vote in the Senate is delayed to Friday but that should just be procedural.
Aussie strong on rate hike bets
Australian dollar's recent strength can be explained by investors' expectation of RBA tightening ahead. While the central bank continued to sound neutral in its communications, the bond markets are telling another story. The spread between 3 year bond yield and RBA policy rate jumped to 75 basis points today, hitting the widest level since May 2010. That comes after another month of stellar job data released earlier in the week. The strong setting to the start of 2018 could be putting up pressure for the RBA to follow other global peers to hike later in the year.
New Zealand manufacturing PMI tumbled sharply
New Zealand business NZ manufacturing PMI dropped sharply to 51.2 in December, down from 57.7. While it still stayed above 50 which signals expansions, the slowdown is notable. Looking in to the details, all five of the sub-indices declined with the biggest fall seen in new orders, from 57.3 to 50.2. BNZ noted that "anecdotal evidence, across the economy, suggests there was a post-election hiccup in activity as businesses put off major spending."
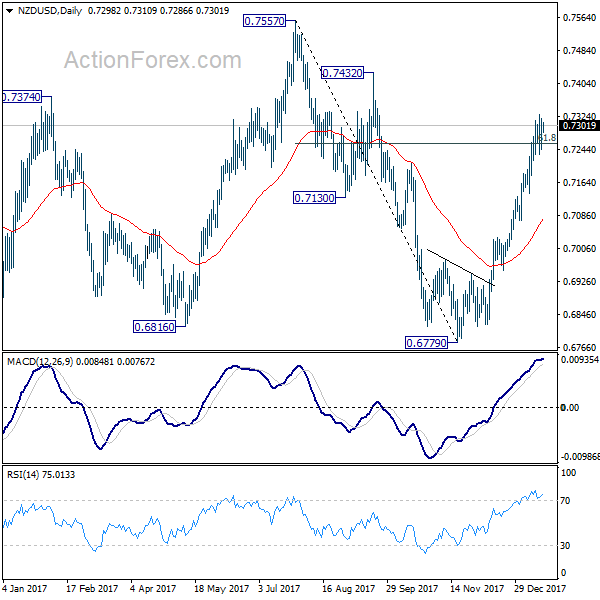
But overall, the data does little to hinder recent rally in NZD/USD, which rides on dollar's weakness. Now with 61.8% retracement of 0.7557 to 0.6779 taken out, the pair should be targeting 0.7432/7557 resistance zone. There is no clear sign of resumption of long term rise from 0.6102 (2015 low) yet. Hence, we'll pay attention to topping signal in this resistance zone.
Looking ahead
German PPI, Eurozone current account and Swiss PPI will be released in European session. But the main feature will be UK retail sales. Canada will release manufacturing sales and international securities transactions and US will release U of Michigan sentiment later in the day.
GBP/USD Daily Outlook
Daily Pivots: (S1) 1.3826; (P) 1.3869; (R1) 1.3936; More.....
Intraday bias in GBP/USD remains on the upside at this point. As noted before, sustained trading above 1.3835 will carry larger bullish implication and should target long term fibonacci level at 1.5466 next. On the downside, though, break of 1.3741 minor support will indicate rejection from 1.3835 and turn bias to the downside for 1.3457.
In the bigger picture, sustained break of 1.3835 key resistance level will indicate that rebound from 1.1946 is at least correcting the long term down from from 2007 high at 2.1161. In that case, further rise should be seen back to 38.2% retracement of 2.1161 (2007 high) to 1.1946 (2016 low) at 1.5466. Nonetheless, rejection from 1.3835 will maintain medium term bearishness and thus, the risk retesting 1.1946 ahead.
Economic Indicators Update
| GMT | Ccy | Events | Actual | Forecast | Previous | Revised |
|---|---|---|---|---|---|---|
| 21:30 | NZD | Business NZ Manufacturing PMI Dec | 51.2 | 57.7 | ||
| 7:00 | EUR | German PPI M/M Dec | 0.20% | 0.10% | ||
| 7:00 | EUR | German PPI Y/Y Dec | 2.30% | 2.50% | ||
| 8:15 | CHF | Producer & Import Prices M/M Dec | 0.60% | |||
| 8:15 | CHF | Producer & Import Prices Y/Y Dec | 1.80% | |||
| 9:00 | EUR | Eurozone Current Account (EUR) Nov | 31.3B | 30.8B | ||
| 9:30 | GBP | Retail SalesM/M Dec | -0.90% | 1.10% | ||
| 13:30 | CAD | Manufacturing Sales M/M Nov | 2.00% | -0.40% | ||
| 13:30 | CAD | International Securities Transactions (CAD) Nov | 20.81B | |||
| 15:00 | USD | U. of Mich. Sentiment (JAN P) | 97 | 95.9 |
Market Morning Briefing: Dollar-Yen Has Been Trading Around 111
STOCKS
Dow (26017.81, -0.37%) is likely to test levels near 26200 as mentioned yesterday and could come off a bit from there. Dax (13281.43, +0.74%) moved up slightly today and could eventually test 13400 on the upside. Near term is bullish for both Dow and the Dax.
24000-24200 region is very crucial for Nikkei (23836.84, +0.31%). A sharp rejection if not seen from these levels could indicate fresh bullishness coming in for the medium term. Currently trading below 24000, the index needs to come off towards 23600 or lower in the coming sessions.
Shanghai (3493.26, +0.53%) has immediate resistance near 3510 and it could produce a rejection towards 3450 in the medium term. A break above 3510, if seen could take the index to higher levels of 3550 in the longer run. Watch price action near 3510.
Sensex (35260.29, +0.51%) and Nifty (10817.00, +0.26%) have tested the upside resistance near 10900 and 35600 respectively and is likely to come off in the near term. As mentioned yesterday, there is not much of an upside expected and prefer a sharp fall from current levels.
COMMODITIES
Brent (68.47) and WTI (62.98) have come off as expected. Weekly resistance on the Brent and 3-day resistance on the WTI has been holding well and Brent is likely to come off towards 67.70 or lower in the coming sessions. WTI on the other hand may test 62.50-62.00 on the downside. Near term looks bearish.
Gold (1329.83) is trading above interim support near 1325 and while that holds, the index could move up towards 1340-1345 again in the coming sessions. Near term looks bullish.
Copper (3.2075) may gradually move down to test 3.15 on the downside before bouncing back from there. Some narrow and ranged movement is possible below 3.30. Near term looks bearish.
FOREX
Dollar Index (90.504) has dropped after touching a high of 91 yesterday but is likely to now respect support near 90.4-90.5 as see n on daily line charts. The last 2 days have seen US yields rise to multi-year highs (see Interest Rates below), thereby reflecting a possible shift in investment from debt to US equities. This should be bullish for the US Dollar in the near term, keeping the Dollar Index above 90.4-90.5.
Against our expectations, Euro (1.2244) again rose instead of testing 1.21-1.215. However, with some bullish prospects ahead for the Dollar, we might see Euro range between 1.21-1.225 for the next 2-3 sessions. There is near term resistance on weekly candles near 1.225 which should hold for now.
Dollar-Yen (111.01) has been trading around 111 for the past 2-3 days and we could expect an upmove towards 112 in the next couple of sessions as the Dollar shows signs of strengthening.
Euro-Yen (135.96) has been inching towards 136 for the past 4-5 sessions and having finally seen a high of 136.02 yesterday, we can expect another week of slow upmove before it tests resistance near 137 on the daily candles.
Pound (1.3901) as expected, breached resistance near 1.385 on the daily candles once again and is now trading near 1.39. It might now look to test higher resistance near 1.41 on the weekly candles in the coming week.
The Aussie (0.8013) has finally moved past the important resistance of 0.80 on the weekly line chart. We might have to wait for a couple of sessions for this breach to be confirmed, in which case, the next target for the Aussie would be 0.82 (seen as higher resistance on the 3 day line chart).
Dollar-Rupee (63.8575) could come down towards 63.70/60 in the near term. The Dollar Index’s movement for the next few sessions could prove to be an important indicator for Dollar-Rupee. While the Dollar Index stays below 91, we might not see Dollar- Rupee go past 64.
INTEREST RATES
US yields have touched new highs as unemployment data in the US exceeded expectations and built on the positive sentiment created by yesterday’s Beige Book release by the Fed. As investors move from US debt to US equities, the 10 Year (2.6311%) has shot up past resistance on the short term chart near 2.61% much earlier than expected. Similarly, US 5 Yr (2.4231%) , US 2 Yr (2.0475%) & US 30 Yr (2.9089%) are all up. With such a rise in yields, we could however expect some inflow into US debt next week, leading to consolidation near current levels before the next rise.
The rise in yields have provided some pause to yield curve flattening with yield differentials between US 10 Yr – 5 Yr (0.208%) & US 30Yr – 10Yr (0.278%) rising and indicating that respective supports near 0.19% and 0.24-0.25% will hold for the time being.
Japanese 10 Yr yield (0.084%) is continuing its ranging between 0.07% and 0.088% on short term charts while the 5 Yr (-0.08%) and 30 Yr (0.83%) show some potential for further rise towards resistances at -0.1% and 0.85% respectively on the long term charts.
Lowdown, Showdown And Shutdown
Market overview
The DXY traded with a slight negative bias overnight but never really threatened an aggressive interday move lower with both EURUSD and USDJPY confined to their recent ranges. Most of the subtle shifts are on the back of misgivings over a possible U.S. government shutdown as lawmakers struggled to forge a federal budget deal.
Yesterday's Apple headlines suggest Repatriation is taking a leading position in the current market narrative. While a win-win for equity markets and the US economy. However, it is highly unlikely US equity gains will translate into discernible support for the struggling US dollar.
AS we saw yesterday when the news hit there's no question FX traders tend to jump first and ask questions later. But the bulk of the repatriation “yardage” is sitting in USD dollar accounts overseas, suggesting the weight of transaction will be little more than a back office ledger transaction and corresponding Bank account adjustment. And while there will be heaps of standing order on a daily basis to covert the initial waves of non-US dollar denominated residual repatriation flows, the volumes will be quickly consumed by the markets. All and all the repatriation flows are unlikely to make this year's FX highlight reel.
Stocks and commodity prices were not immune from choppy and toppy price actions overnight while US fixed income markets continued to unwind flatteners with US 10y yields testing 2.62%
Lowdown, Showdown and Shutdown
As usual, the focus is back on Washington with the markets digesting the lowdown in the budget showdown that could lead to a potential shutdown. Of course, a Government closure will have minimal impact on the US economy and the sun is sure to rise on Monday, but the markets will temporarily wobble in predictable unthinking fashion if lawmakers fail to table a last-minute agreement. The air is ripe with the stench of partisan politics, which has remained as stubbornly intense and polarising as ever. But it all comes down to the Senate vote where the GOP fiscal hawks could stay as staunch as ever leaving the Republicans scrambling for funding votes.
Pardon the interruption
If a shutdown occurs, history tells us the dollar will sell off marginally in the ensuing weeks but t the scope for weakness will be somewhat limited. Also, as for markets in general, we should expect investors to look past Washington contempt regardless of the length of the interruption but apparently from a more risk adverse perspective. Ignore the noise and stay the course.
Oil markets overview
The Energy Information Administration reported a more substantial than expected drop in inventories than the market has predicted which continues to “draw “attention to the bullish oil market narrative causing oil prices to rebound overnight.
However, with speculation mounting that OPEC and Russia are planning an exit strategy from production cut agreement. The top side could be limited as traders will be keen sell contrarian risk as even the slightest glimpse of a policy shift from OPEC, traders will be tripping over themselves to get downside exposure.
Mind you; I do not mind throwing a few barrels into the mix as an about-face from OPEC will trigger a precipitous price drop given extended hedge fund positioning.
For proper measures, S&P updated its 2018 Brent assumption from $50 to $60
Equity markets overview
A predictable air of caution has engulfed global equity markets as we approach the final bell for US budget showdown. But in the bigger scheme of things this case of hic-ups is likely to pass as quickly as it arrived
But more to the point, after the Dow nudged in to record territory on Wednesday, there's a natural propensity for investors to take some profit and when combined with updraft on UST 10y trading at 2.62 comes a greater appeal for Cross asset rotation out of stocks into bonds.
Gold markets overview.
The shine has come off gold this week as the confluence of early week key drivers of risk has failed to unfold. There has been little to no escalation on the geopolitical landscape, in fact, its much calmer. While Washington remains a political quagmire, a nonchalant attitude appears to have permeated investors psyche ahead of the Budget showdown. Equity market remains frothy with the Dow crossing into record territory and triggering equity hedges to reduce. Apple repatriation investment flow is a win-win for equity market and the US economy. Traders positioned for more downside dollar risk which has failed to materialise this week.
The market has been offloading risk after touching a four-month high but will likely look to re-engage longs next week if the weaker USD narrative unfolds more aggressively
G-10 and the RMB
The Yuan
GDP growth for the full year accelerated for the first time in seven years, which should lift stocks and global commodity prices, and add more credibility to the bullish sentiment on the yuan
And while the larger than expected GDP suggests officials will have more room to address the growing debt problem, as China continues to place controlling risk and to deleveraging at the forefront of financial policy in 2018 but of course but of course with reforms and deleveraging comes economic headwinds. However, with mainland regulators hell-bent on market stability and attracting capital inflows, the potential economic headwinds are a short-term pain for long-term gain.
In a delayed response to the Chinese data, USDCNH traded extremely heavy into the close driven on the back of onshore corporates selling as did interbank speculators. The stronger Yuan consensus trade is back in vogue.
But the removal of the counter-cyclical mechanism and the subsequent policy misinterpretations derailed bulk of short positions. So Traders have likely not established long Yuan positions in size they want suggesting a move lower. And while dealers may be reluctant to chase the market lower without a stronger USD downtrend signal to re-emerging in G-10, they will undoubtedly be looking to sell tactically into and USDCNH pullbacks.
The Australian Dollar
The Aussie employment rounded off a stupendous year for the domestic labour markets leaving the RBA both happy and sad, glad the economy is growing but sorry the currency is rising. However given the volatility in the in the Employment series, the real focus should be on CPI later in the month and with only twenty-five, bp's priced into the 2018 curve and a measly five bps priced into May the risk is for much higher Aussie on a stronger CPI print. It's hard not to remain positive on the Aussie more so as the dwindling differential storyline has turned as insignificant a sentiment driver as its ever been.
Sure, it's a bit tricky trading around psychologically significant points like the 80 level, but given the Aussie is trading strong beta to the USD, it becomes as much of a US dollar storyline than a domestic one this stage. If US dollar weakness returns in earnest, as it is expected to do, commodity markets remain firm, traders will be scrambling for topside risk much to the chagrin of RBA policymakers, and the Aussie could head for .8250.
The Euro
ECB Members and mysterious “unnamed sources” were conspicuous by their absence after making best effort to squelch the EURO rally by efficiently raising the spectre of volatility in FX markets. Just look at Wednesday 140 pip top to bottom range within a 3-hour period with minimal to no news. Traders soon cooled their jets realising that this exercise in futility becomes little more than passing the buck while throwing spaghetti at the wall hoping something sticks.
It is becoming a predictable trend for the EBC to intervene after the market breaks topside and takes out another significant big figure. Moreover, it is almost as if the ECB wants to punish the markets for buying the EURO by giving traders just enough rope to hang themselves and then springing the trapdoor. It is probably a good idea if they want to tame the voracious markets appetite for Euros, best not table a hawkish leaning ECB minutes….”just saying.”
But given all the noise this week, and even with IMM non-commercial positioning for EUR is at a 10-year high. But in reality the market is still undeposited for an eventual shift in ECB language.
The Japanese Yen
The JPY continues to be a mystery in the making. But the strategy unfolding into next week is sure to remain tactically long on the risk of an overtly dovish BoJ. According to some recent articles, some players in the market have overblown the probability for a shift in BoJ policy, and some of that unwind alone could push USDJPY closer to 113.Smart money bets are for the BoJ to stay the YCC course.
Asia FX
The Malaysian Ringgit
Not expected any surprises or significant moves ahead of the weekend as the Ringgit has been a pillar of stability this week. The markets are pricing at roughly 70 % rate hike probability which suggests we could see an uptick in volatility early next week ahead of the MPC meeting which will be a significant influence over the near-term direction. In fact its the day we've been building for the past three months
Oil prices remain firm although the market did not make any significant headway overnight. The US dollar is trading with a negative bias ahead of the budget showdown, but US yields continued to ratchet higher. All in all, we should expect the MYR to remain relatively range bound today unless there is an unexpected shift in the broader USD dollar narrative as the Ringgit is trading powerful Beta to the USD this week.
The Korean Won
BoK held interest rates yesterday, but the market is trading of little more than technical levels.There appears to a tactical line of discussion either side of the 1070 levels where the markets spent the majority of the yesterday, and it seems we have headed for a similarly quite day with a slight skew to seel dollar ahead of the opening salvo.
The Indian Rupee
$INR edged lower on FPI inflows with SENSEX surging +1.00% following news that the government is considering higher FDI limits on banking stocks.
USD/CAD Canadian Dollar Flat As NAFTA Comments Keep Loonie Under Pressure
The Canadian dollar is flat versus its US counterpart on Thursday. The US dollar fell against most major after the Trump Administration criticized the GOP plans for another short term funding bill to avoid a government shutdown. The loonie did not take part as Trump also issued another threat directed at NAFTA in a tweet targeting the proposed wall between Mexico and the United States. The Bank of Canada (BoC) hiked rates 25 basis points on Wednesday and for all the hawkish rhetoric about the economy even the central bank had to admit that the fate of NAFTA remains uncertain.
The growing risk the US pull out of the trade agreement has been already been voiced by anonymous Canadian officials and has put the loonie under pressure versus the US dollar. The three members of NAFTA originally wanted to avoid going into 2018 without the details of the deal hammered down. Mexican presidential elections in July and the US primaries in November could interfere with the already divisive topic and could politicize even further forcing it decision based on populism and not economics.
The sixth round of negotiations will kick off in Montreal on January 23 and will go until the 28. This round is of particular note given that the Foreign ministers will rejoin the talks after skipping the November and December talks.
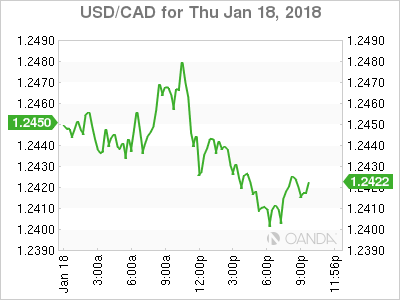
The USD/CAD was flat on Thursday. The currency pair is trading at 1.2435 after the gains for the loonie after the central bank decision to raise rates were quickly erased on concerns about the end of NAFTA.
The Bank of Canada (BoC) has now hiked three times since the summer of 2017. After two rate cuts in 2015 Governor Poloz had been cautious to remove the stimulus, but that suddenly changed in July in which various members of the monetary policy team dropped heavy hints that a hike was coming. The BoC followed that with a small surprise by hiking one month ahead of the expected date in September. The tone of the CB changed to one more neutral with no rate moves expected until the end of the first quarter.
The November and December job reports in Canada changed all that. Both had gains of 70,000 jobs and brought the unemployment rate to a 40 year low. Governor Poloz had a tough task, keep removing stimulus but at the same time warn about potential headwinds. His strategy was to focus on the actions of the Trump Administration. The tax cuts approved in December in the US could end up reducing investment in Canada, just as the negative impact of the end of NAFTA could derail the Canadian growth story.
The USD has failed to gain traction in 2018 and politics is very much a part of what is wrong with the greenback this year. US congress is having trouble finding a way got avoid a government shutdown with the clock ticking down and President Trump complicating matters. The primaries in the fall are not looking good for the Republican party, but they are finding it challenging to break away from the President and that could cost them control of the House and the Senate.
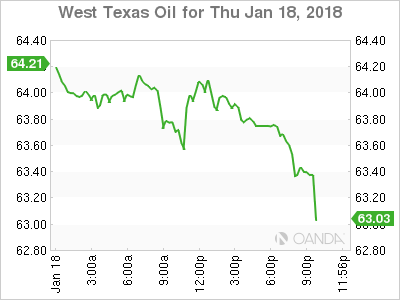
West Texas Intermediate rose in the last 24 hours. The price of WTI is trading at $63.91 after the Energy Information Administration (EIA) released it’s weekly US crude inventory data. Oil inventories dropped 6.9 million barrels nearly doubling the forecasted drawdown. The lower than expected subdued some of the concerns that the Organization of the Petroleum Exporting Countries (OPEC) oil production cuts would be under assault from higher US output. boosted oil prices higher. OPEC released its own forecasts with an emphasis on rising non-OPEC output in 2018. The group expect producers not part of the Vienna based organization and also not part of their oil production cut to increase their supply by 1.2 million barrels a day, and increase of 160,000 from earlier estimates.
The price of oil will continue to be in a tug-o-war between OPEC oil cuts and rising US shale production. For now weather events and other supply disruptions have supported prices, but as those issues disappear energy prices will be under pressure if there are no geopolitical or weather related events that once again limit oil production.
Market events to watch this week:
Friday, January 19
4:30am GBP Retail Sales m/m
Bitcoin Seasonals. Really?
Watch out FX traders. Wednesday was another tumultuous day in the currencies following BoC hike and US dollar initially continued to wilt but caught a strong bid late in the evening. Overnight, Aussie jobs slowed to a higher level than was expected but unemployment edged up, capping AUD at 0.80. Earlier today, US Philly Fed survey eased as well as US jobless claims. Here is a chart suggesting a possible January-February seasonality in Bitcoin's price change. Could it be a result of Chinese selling Bitcoin in January to help Chinese New Year purchases?
The Bank of Canada delivered a rate hike that was 90% priced in but left the market with few clues about what's coming next and when. The initial reaction in USD/CAD was higher on talk of a dovish hike but the commentary from Poloz didn't back that up. He spoke about wanting to get back to 2.50%-3.50% and increased confidence the economy was on track. At the same time, he spent half the press conference talking about NAFTA risks.
After hitting 1.2520 USD/CAD slowly reversed down to the lows of the day at 1.2370 but part due to a broad US dollar selloff. At the same time, cable soared to a post-Brexit high of 1.3940 as part of a rout on the dollar.
However the selling stopped after the Beige Book. It offered a slightly more-optimistic take on wages and the economy. Earlier in the day, Dallas Fed President Kaplan also made a hawkish shift, saying that his base case is now three hikes this year with the possibility of more.
With that, the dollar began a broad reversal and cable fell back to 1.3820 – more than 120 pips from the high. The euro also fell below 1.22 and USD/JPY rose to 111.30. As part of the same move, bonds sold off and US 10-year yields rose to 2.59% while gold suffered a $10 decline, which is the worst in five weeks.Through it all, the S&P 500 ripped another 26 points higher to close just below the record high.
Sorting through all the 'why' in the market right now is a mammoth task. More important is the 'what' and that's heightened volatility. It was evident in FX lately and it could spread. If so, that's a broader negative for stocks and risk appetite.
It's getting close to the time for caution.