
Sample Category Title
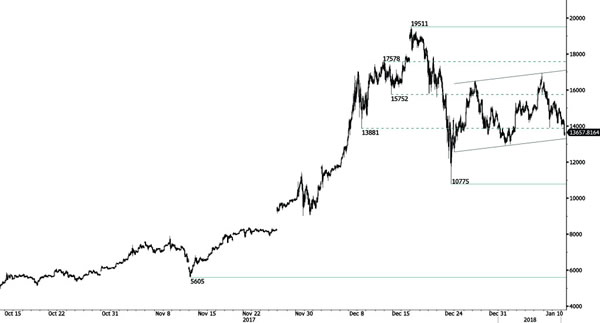
BITCOIN Ready For A Bearish Breakout
Bitcoin is suffering these past few days. The technical structure has shown a tremendous positive short-term momentum so far. Hourly support area located around 10775 (22/12/2017 low). In the short-term, the technical structure suggests a continued bearish momentum. Expected to show further decline.
In the long-term, the digital currency has had an exponential growth. There are decent likelihood that the asset will reach $40'000 in 2018.
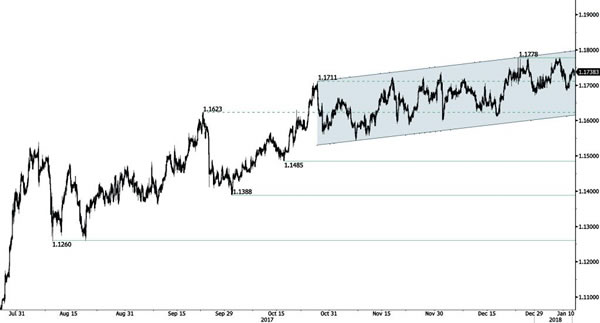
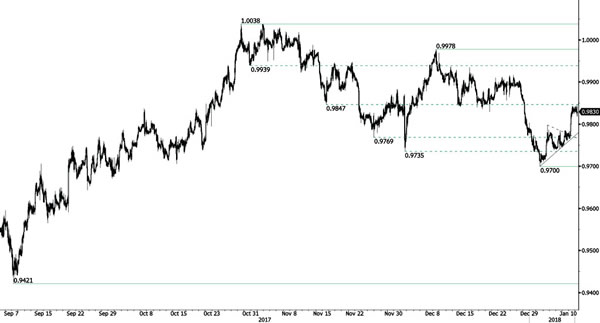
EUR/CHF Slow Increase
EUR/CHF is trading slightly higher. Hourly resistance is given at 1.1778 (25/12/2017 high). Expected to show continued short-term increase.
In the longer term, the technical structure has reversed. Strong resistance is given at 1.20 (level before the unpeg). Yet, the ECB's QE programme is likely to cause persistent selling pressures on the euro, which should weigh on EUR/CHF. Supports can be found at 1.0184 (28/01/2015 low) and 1.0082 (27/01/2015 low).
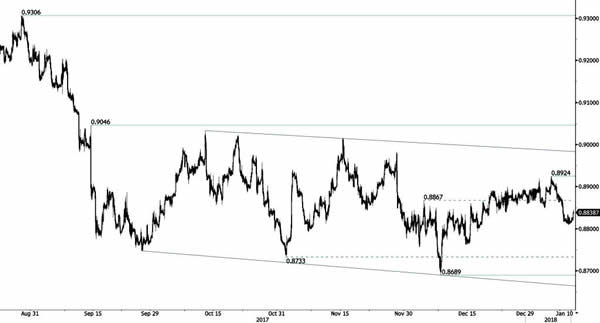
EUR/GBP Skewed To The Downside
EUR/GBP is trading mixed. The pair is trading between support at 0.8689 (08/12/2017 low) and resistance is located at 0.9046 (14/09/2017 high). Expected to show further sideways trading.
In the long-term, the pair has largely recovered from recent lows in 2015. The technical structure suggests a growing upside momentum. The pair is trading above from its 200 DMA. Strong resistance can be found at 0.9500 (psychological level).
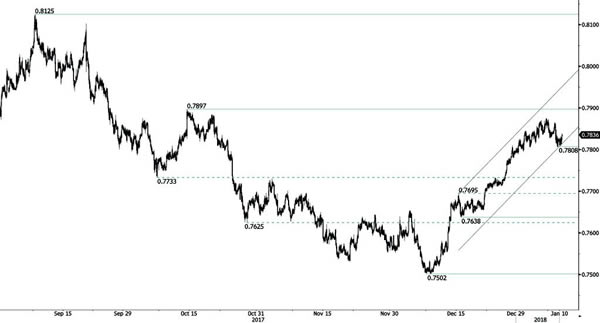
AUD/USD Targeting Resistance At 0.7897
AUD/USD's upside pressures are growing. Hourly resistance given at a distance at 0.7897 (13/10/2017 high). Support stands at 0.7638 (15/12/2017 low). The road is wide open for further upside.
In the long-term, the trend is turning positive. Key supports stands at 0.6009 (31/10/2008 low) . A break of the key resistance at 0.8164 (14/05/2015 high) is needed to invalidate our long-term bearish view.
USD/CAD Short-Squeeze
USD/CAD is skewed to the downside after the pair failed to break hourly resistance at 1.2917 (27/10/2017 high) even thought the pair is bouncing back. Expected to see further shortterm weakness.
In the longer term, the pair has broken longterm support that can be found at 1.2461 (16/03/2015 low). Strong resistance is given at 1.4690 (22/01/2016 high). The pair is likely to head further lower.
USD/CHF Increasing
USD/CHF is trading higher. Hourly support is given at 0.9700 (02/01/2017). Expected to show further short-term upside move.
In the long-term, the pair is still trading in range since 2011 despite some turmoil when the SNB unpegged the CHF. Key support can be found 0.8986 (30/01/2015 low). The technical structure favours nonetheless a long term bullish bias since the unpeg in January 2015.
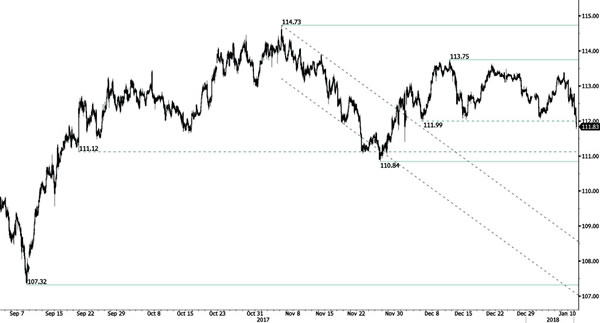
USD/JPY Bearish Breakout
USD/JPY's selling demand is pushing lower and the pair has broken hourly support given at 111.99 (15/12/2017 low). Hourly resistance can be found at 113.75 (12/12/2017 high). The technical structure suggests further short-term downside moves.
We favor a long-term bearish bias. Support is now given at 99.02 (10/08/2013 low). A gradual rise towards the major resistance at 125.86 (05/06/2015 high) seems unlikely. Expected to decline further support at 93.79 (13/06/2013 low).
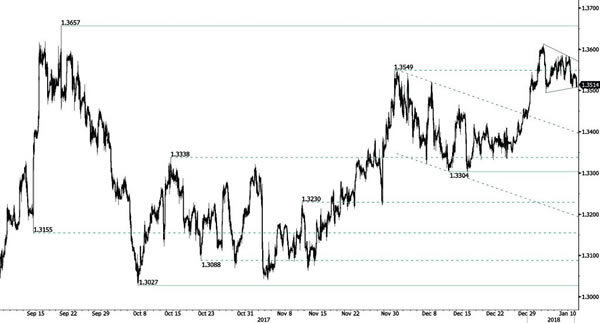
GBP/USD Symetrical Triangle
GBP/USD's selling pressures are increasing. The pair has exited downtrend short-term channel. The technical structure indicates further short-term potential downside. Hourly support is given at a distance at 1.3495 (03/01/2017 low) while hourly resistance can be found at 1.3613 (03/01/2017 high).
The long-term technical pattern is reversing. The Brexit vote had paved the way for further decline. Long-term support can be found at 1.1841 (07/10/2017 low). Long-term resistance given around 1.35 is at stake and indicates a long-term reversal in the negative trend. Yet, it is very unlikely at the moment.
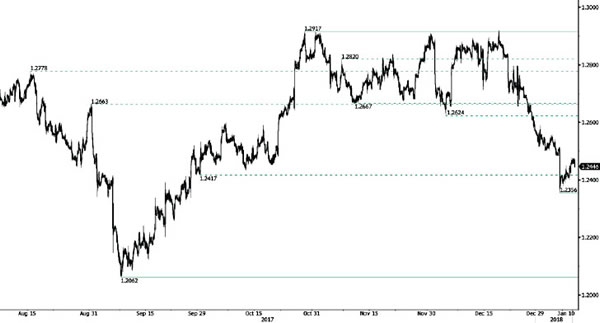
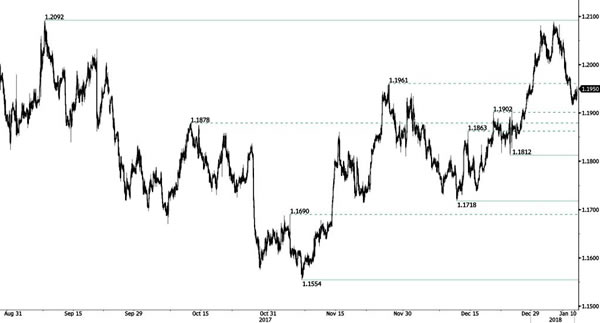
EUR/USD Continued Weakness
EUR/USD keeps on weakening. The pair is now retracing after reaching resistance given at 1.2092 (08/09/2017 high). The road is wide-open for further decline towards support at 1.1812 (25/12/2017 low). Stronger support is given a distance at 1.1718 (12/12/2017 low).
In the longer term, the momentum is now turning largely positive. We favour a continued bullish bias. Key resistance is holding at 1.2252 (25/12/2014 high) while strong support lies at 1.0341 (03/01/2017 low).
Forex Technical Analysis: EUR/USD, USD/JPY, GBP/USD
EUR/USD
Current level - 1.1952
The test of 1.1910 support zone led to a minor reversal and currently a corrective rebound is underway, but it should be limited below 1.2000 area before drowning towards 1.1810.
| Resistance | Support | ||
| intraday | intraweek | intraday | intraweek |
| 1.1960 | 1.2090 | 1.1910 | 1.1910 |
| 1.2000 | 1.2240 | 1.1810 | 1.1715 |

USD/JPY
Current level - 111.86
The downtrend is intact, heading towards 111.00 support area. Initial resistance lies at 112.00, followed by 112.40.
| Resistance | Support | ||
| intraday | intraweek | intraday | intraweek |
| 112.00 | 113.75 | 111.60 | 112.00 |
| 112.40 | 114.70 | 111.00 | 111.00 |

GBP/USD
Current level - 1.3513
The outlook here remains bearish, for a slide towards 1.3460. Minor intraday hurdle lies at 1.354 and crucial on the upside is 1.3580.
| Resistance | Support | ||
| intraday | intraweek | intraday | intraweek |
| 1.3540 | 1.3660 | 1.3500 | 1.3460 |
| 1.3580 | 1.3660 | 1.3460 | 1.3300 |
